
I've begun to incorporate the weekly charts in the Diamond Reports. When I get a large amount of scan results, I find that it helps to narrow down the field by looking at a CandleGlance of the entire list and deleting the obvious "not ready for primetime" stocks. Next, I pull up the daily charts and flip through them on the "10-per Page" setting. Once I've narrowed that down, I look at the weekly charts of the candidates I have left, which are possible short-term investments from the daily charts and possible intermediate-term investments from the weekly charts. I love to get your feedback on these reports as I continue to perfect them, so shoot me an email at erinh@stockcharts.com. I read every one of them!
Welcome to "DecisionPoint Daily Diamonds," a newsletter in which I highlight five "diamonds in the rough" taken from the results of one of my DecisionPoint scans. Remember, these are not recommendations to buy or sell, but simply stocks that I found interesting. The objective is to save you the work of the initial, tedious culling process, but you need to apply your own analysis to see if these stocks pique your interest as well. There are no guaranteed winners here!
Current Market Outlook:
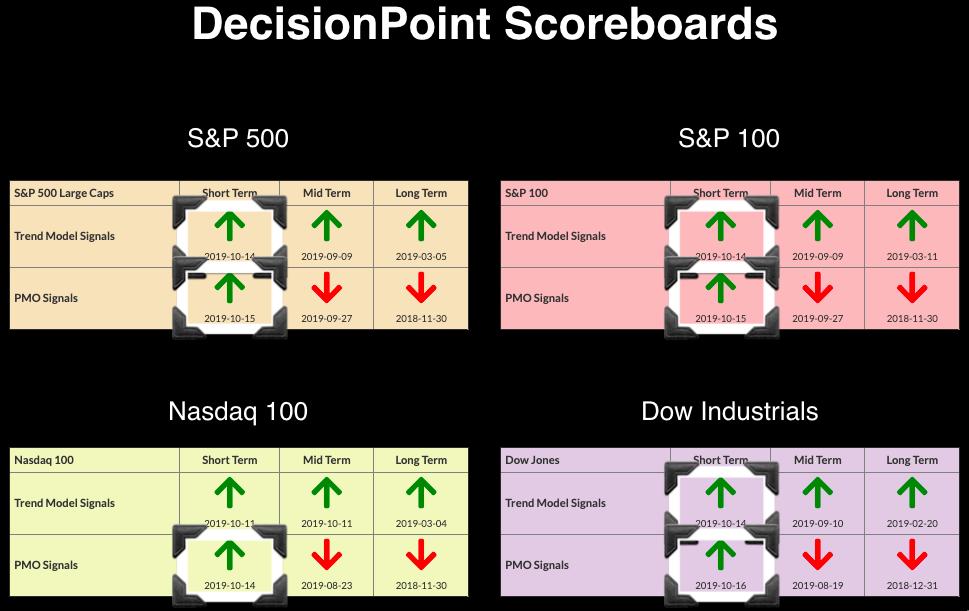
Market Trend: Currently we have Trend Model BUY signals in all three timeframes on the DP Scoreboard Indexes.
Market Condition: The market is overbought and struggling to reach all-time highs, despite Price Momentum Oscillator (PMO) BUY signals appearing this week on the DP Scoreboards. Caution is still warranted.
Market Environment: It is important to consider the "odds" for success. Here are the current percentages on the Silver and Golden Cross Indexes:
- Silver Cross: 55.8% SPX ITTM Buy Signals (20-EMA > 50-EMA)
- Golden Cross: 64.4% SPX LTTM Buy Signals (50-EMA > 200-EMA)
Diamond Index:
- Diamond Scan Results: 61
- Diamond Dog Scan Results: 10
- Diamond Bull/Bear Ratio: 6.1
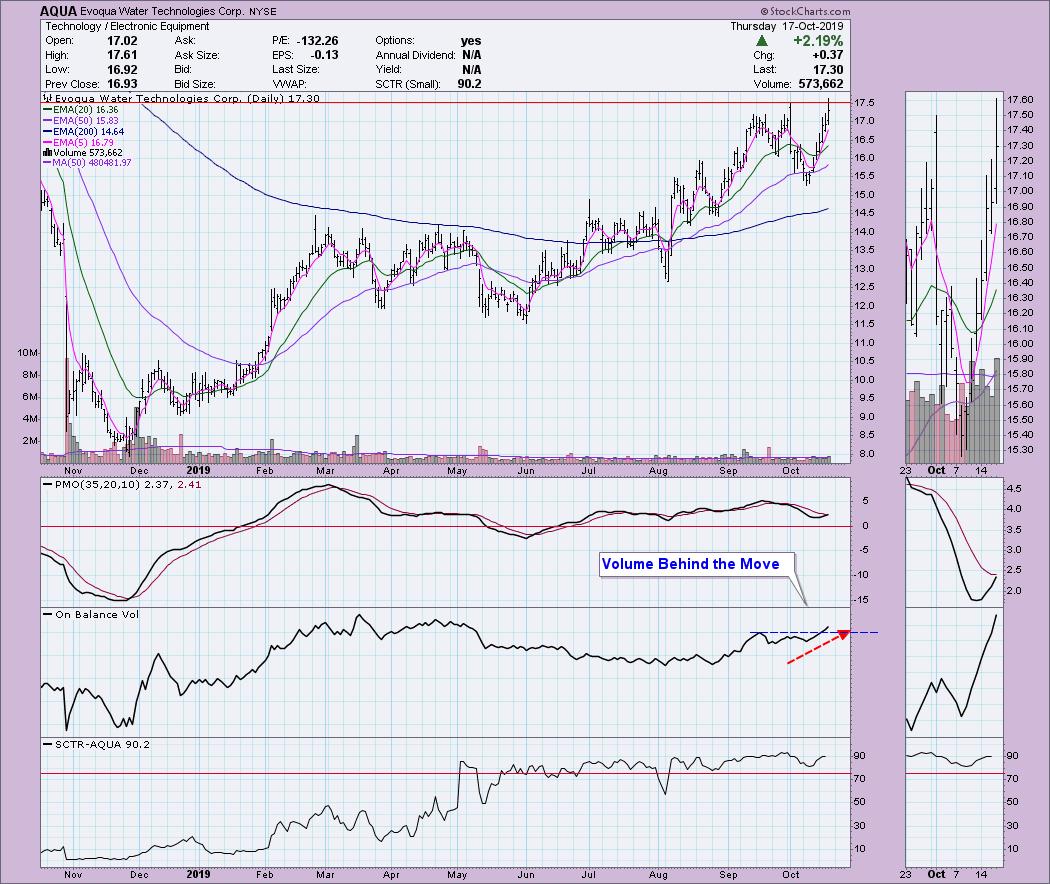
Evoqua Water Technologies Corp (AQUA) - Earnings: N/A
The intraday chart for AQUA broke out but didn't close above overhead resistance. I still like this one, though, given the PMO turning up above the zero line and about ready to give us a clean crossover BUY signal. Volume is coming in strong on this rally. If price closes above $17.50, I like its upside possibilities.
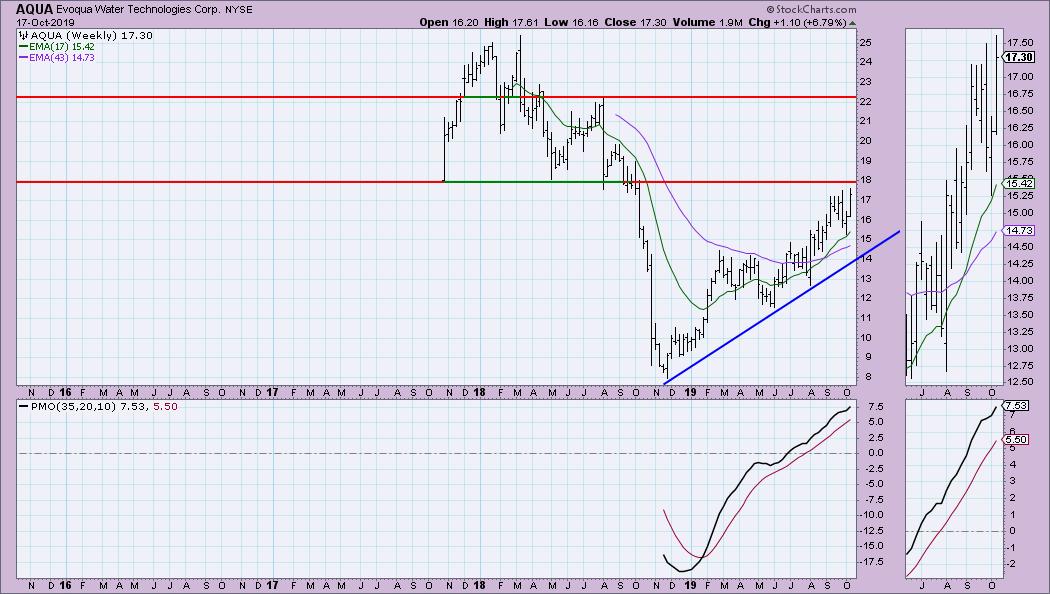
The weekly chart isn't overly bullish, given that $18 could be a problem, but the PMO continues to rise strongly, suggesting it will get that breakout.
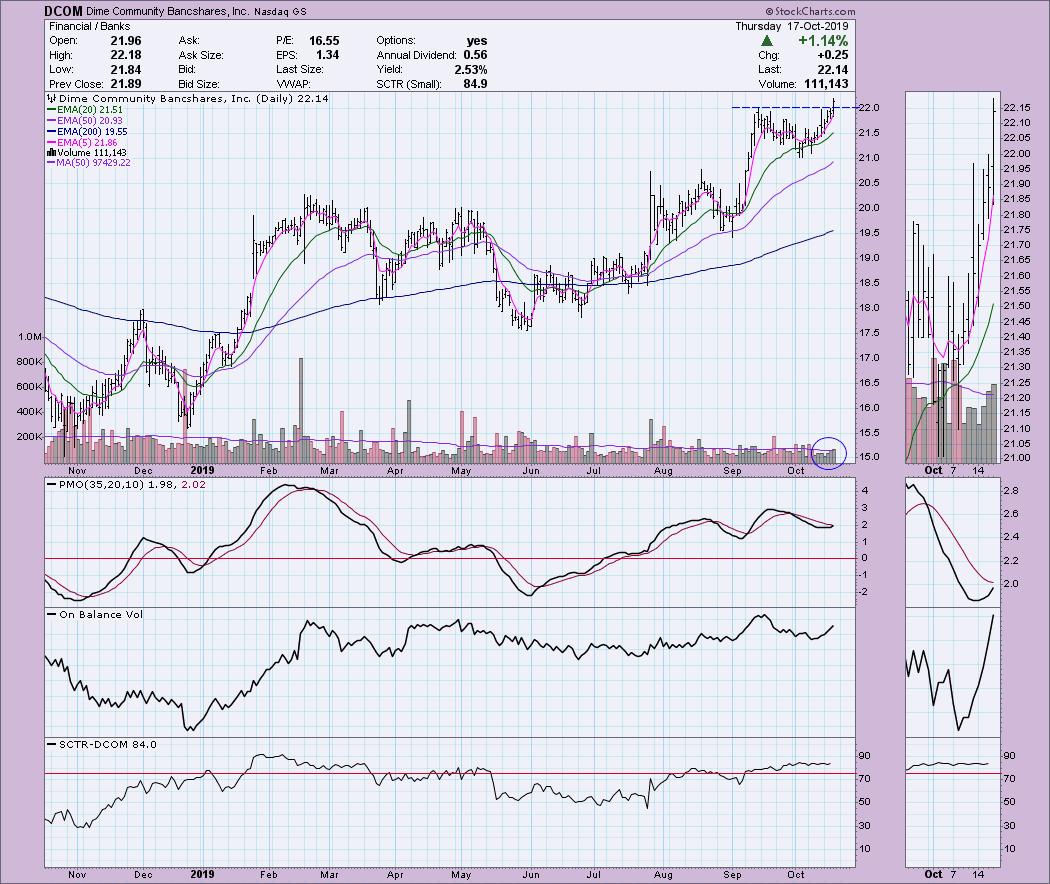
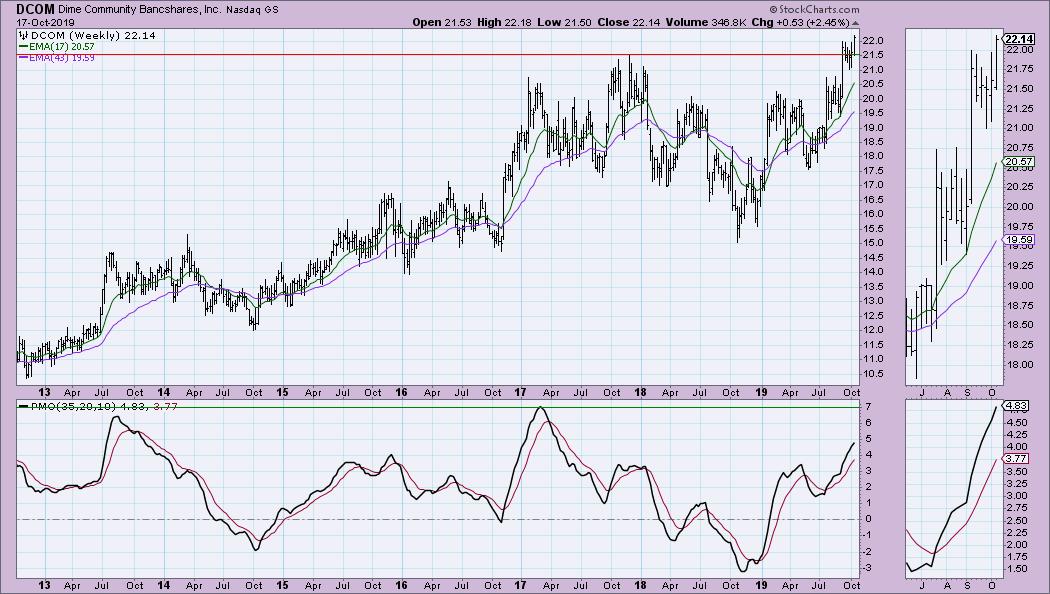
Dime Community Bancshares Inc (DCOM) - Earnings: 10/24/2019
The breakout on DCOM looks better since it did close above resistance. The volume coming in is excellent, although we do have a reverse divergence between OBV tops and price tops. I'm willing to forgive that given today's strong breakout and PMO configuration alongside a healthy SCTR reading.
This week, price is trading completely above overhead resistance at the 2017 top.
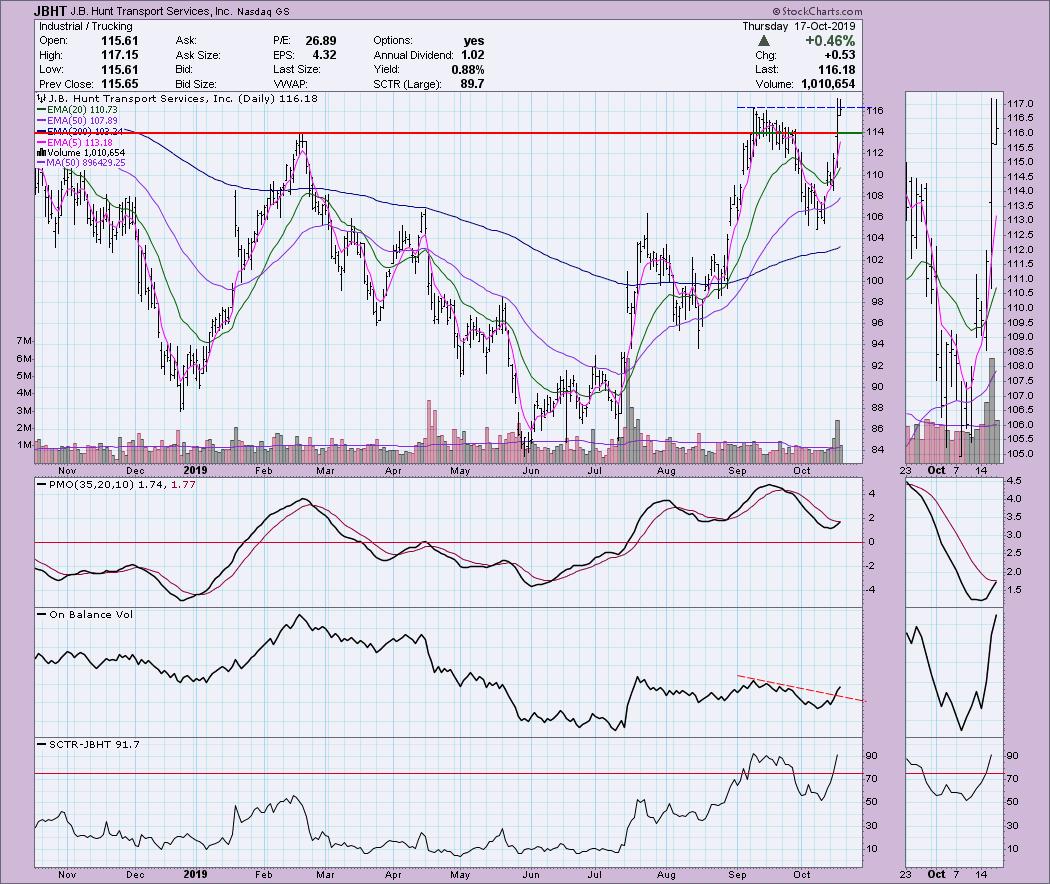
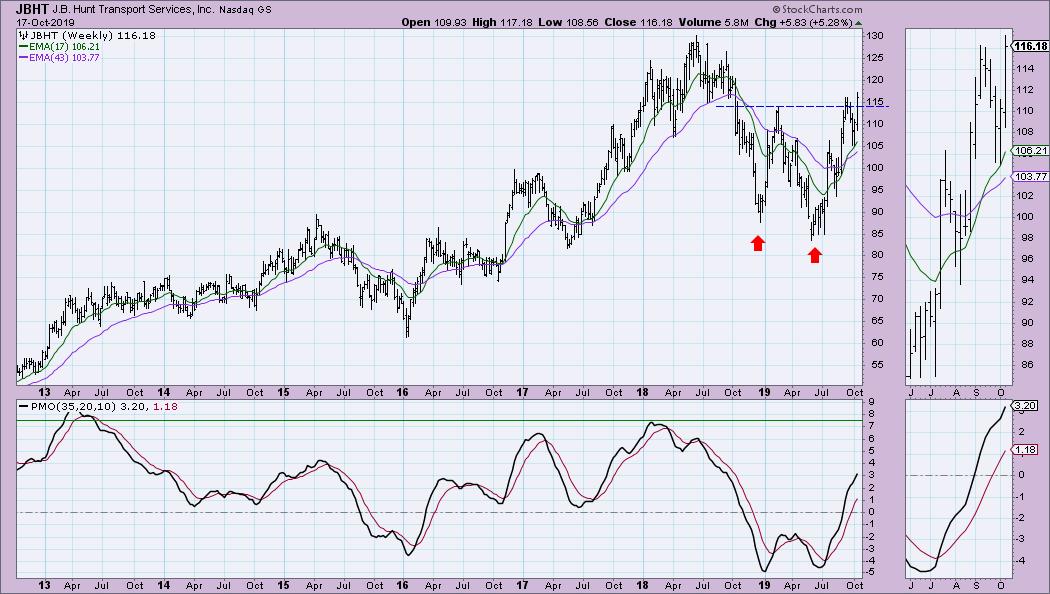
J.B. Hunt Transport Services Inc (JBHT) - Earnings: 1/15 - 1/20/2020
I like this short-term breakout accompanied by a PMO, which is nearing a BUY signal after turning up above the zero line. My caveat on this one is that it looks a bit overbought following a near-vertical rally off the 50-EMA. We may need a pullback before entry. That said, I checked on a few of the "chart breakouts" in yesterday's Diamond report and many of them just continued higher without a pullback. Volume is coming in with three days of above its average readings. The SCTR is on fire.
The breakout on the weekly chart looks especially good since it is the possible execution of a double-bottom formation. The PMO is rising nicely and is far from being in overbought territory. I expect the 2018 high to be challenged.
Constellation Brands, Inc. (STZ) - Earnings: 1/7 - 1/13/2020
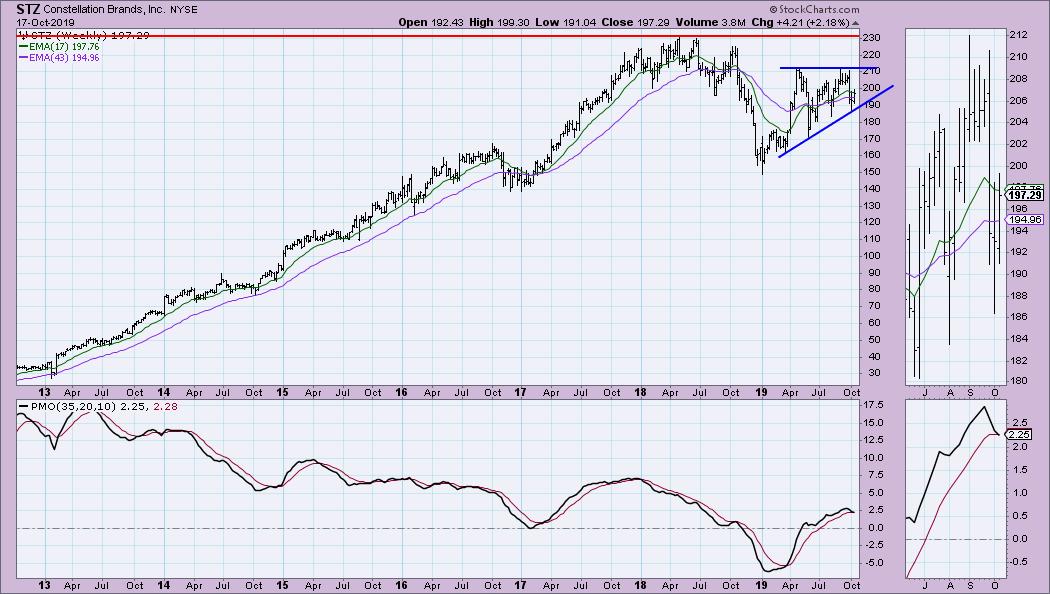
This one is in the relative safety of the Consumer Staples sector. As you can see, Staples stocks tend to spend a lot of time in a trading range and aren't nearly as "sexy" as the big tech and biotech names. Right now, it is breaking out above the 20-EMA. The PMO is bottoming in near-term oversold territory and volume is coming in.
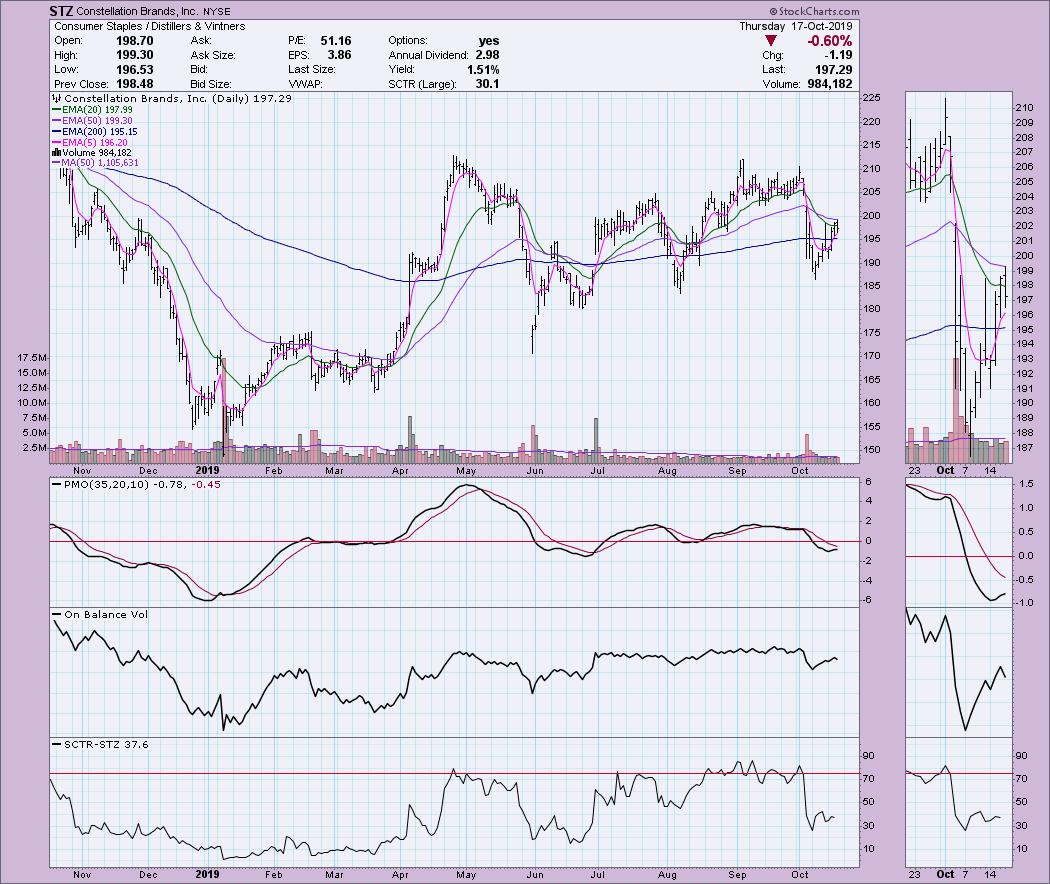
I do see a bullish ascending triangle that looks nearly textbook, so I will forgive the weekly PMO dropping below its signal line. Just be careful in a longer-term investment. I think we will get the test of the $210 level, but, past that, the PMO isn't confirming for anything other than shorter-term investment.
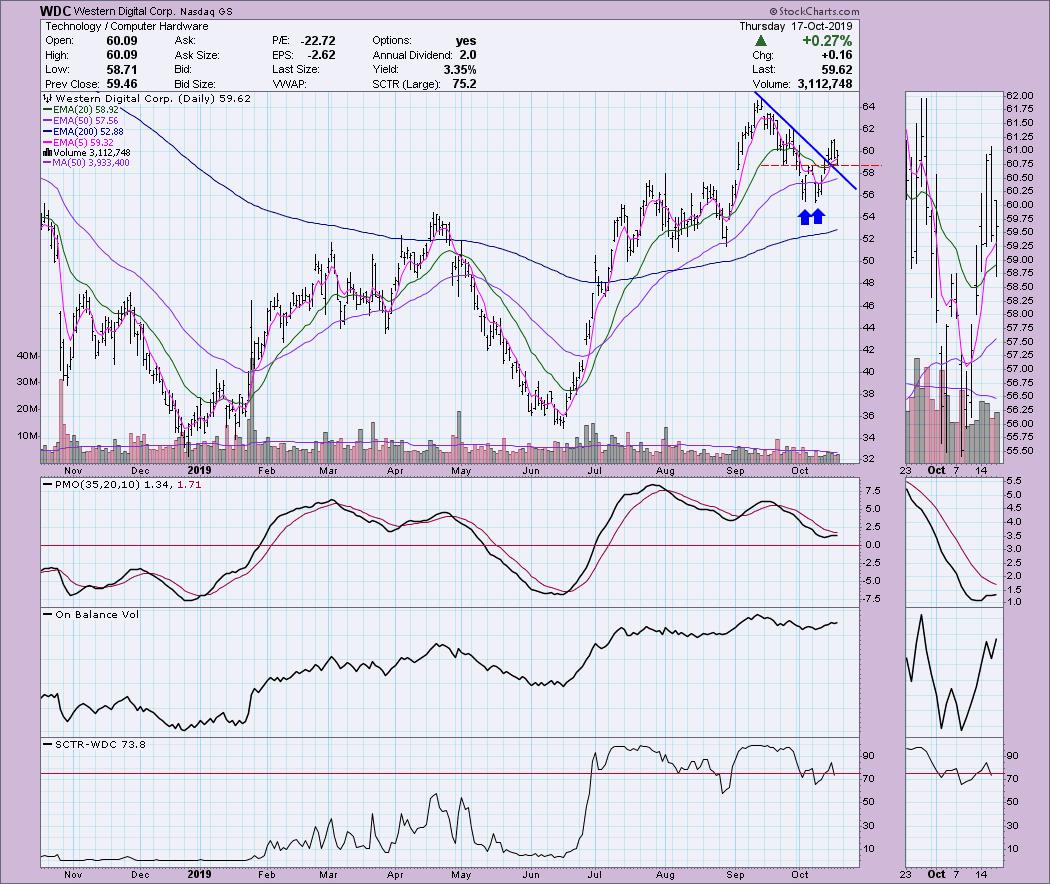
Western Digital Corp (WDC) - Earnings: 10/31/2019
WDC has a double-bottom pattern that executed when price broke above the confirmation line. It has since pulled back, but remains above the confirmation line. I will be watching in the AM to see if it rallies back up. If it does, I will likely get in. The double-bottom pattern suggests a minimum upside target that would put price just below overhead resistance at the September top. Volume has been steadily coming in to the upside, as represented by the rising OBV, and the PMO has flattened (but not turned down) as part of this pullback to the breakout point.
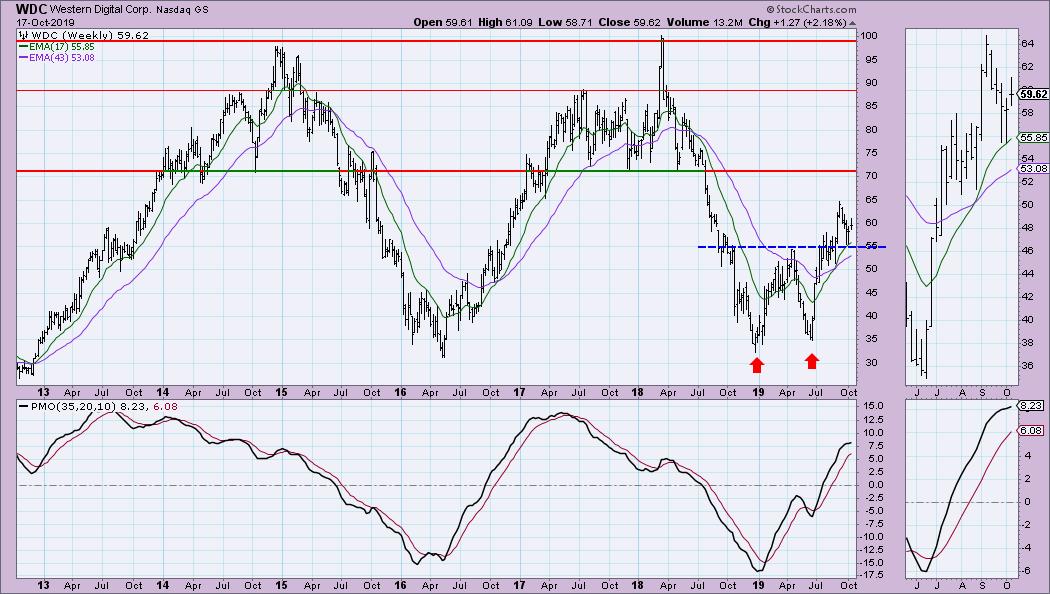
I very much like the large double-bottom on the weekly chart, which is why I will likely invest here. The weekly PMO decelerated, but is now accelerating with the current weekly price action. This double-bottom's minimum upside target is about $75. We could see some resistance at $70, but a break above that would see upside potential move to $90. This fits my intermediate-term investment strategies, which is why I will likely be buying. Just remember, just because I'm buying it, it does not mean it is a "sure thing" - trust me, my portfolio will tell you that I have my share of losers.
Full Disclosure: I do not own any of the stocks above, but I will be putting an order in for WDC sometime tomorrow if $58.50 holds up as support. Be aware not every stock I get into is a winner, so I highly recommend you use your own analysis and risk appetite to determine your course of action. I'm currently about 60% in cash and, should my order go through on WDC, I will only be under that by a little. Position sizing is one of the ways I avoid risk.

SAVE THE DATE!!
Erin Swenlin will be presenting at the TradersExpo in New York City on March 15-17, 2020! You'll have an opportunity to meet Erin and discuss the latest DecisionPoint news and Diamond Scans. The conference is free to attend or view online!
Watch the latest episode of DecisionPoint with Carl & Erin Swenlin LIVE on Mondays 5:00p EST or on the StockCharts TV YouTube channel here!
Technical Analysis is a windsock, not a crystal ball.
Happy Charting!
- Erin
erinh@stockcharts.com
NOTE: The stocks reported herein are from mechanical trading model scans that are based upon moving average relationships, momentum and volume. DecisionPoint analysis is then applied to get five selections from the scans. The selections given should prompt readers to do a chart review using their own analysis process. This letter is not a call for a specific action to buy, sell or short any of the stocks provided. There are NO sure things or guaranteed returns on the daily selection of "diamonds in the rough."
Helpful DecisionPoint Links:
DecisionPoint Shared ChartList and DecisionPoint Chart Gallery
Price Momentum Oscillator (PMO)
Swenlin Trading Oscillators (STO-B and STO-V)
**Don't miss DecisionPoint Commentary! Add your email below to be notified of new updates"**


