 It's only Wednesday, but we've already had quite a few Scoreboard changes this week - BUY signals all around. The Scoreboards would suggest all-time highs should be no sweat, but the short-term indicators aren't on board with that analysis. The VIX is also beginning to look overbought and bearish.
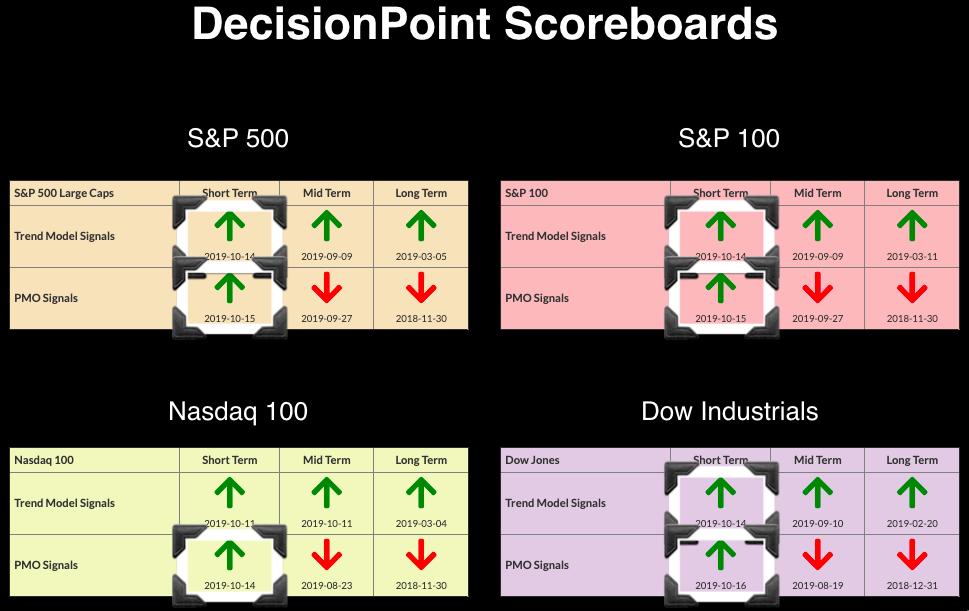
The DecisionPoint Alert presents a mid-week assessment of the trend and condition of the stock market (S&P 500), the U.S. Dollar, Gold, Crude Oil and Bonds.
Watch the latest episode of DecisionPoint on StockCharts TV's YouTube channel here!
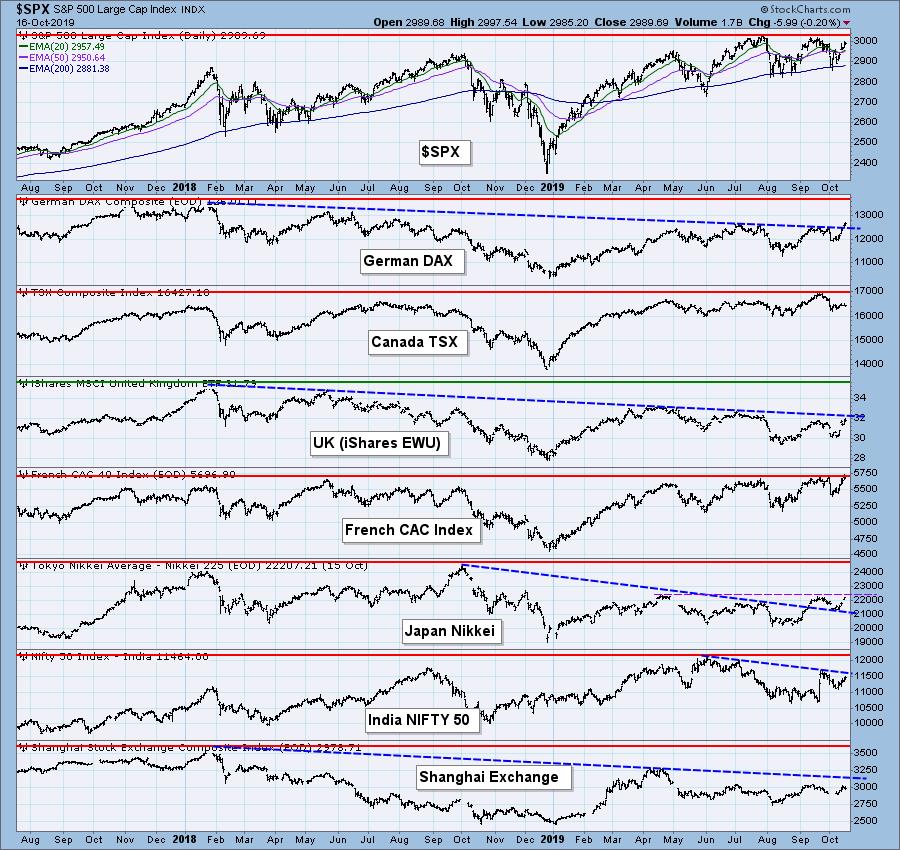
GLOBAL MARKETS
The German DAX is finally seeing a breakout from the declining trend it has been in since reaching all-time highs in January of 2018. French CAC is producing new all-time highs now and it looks like the Nikkei will challenge the 2019 high.
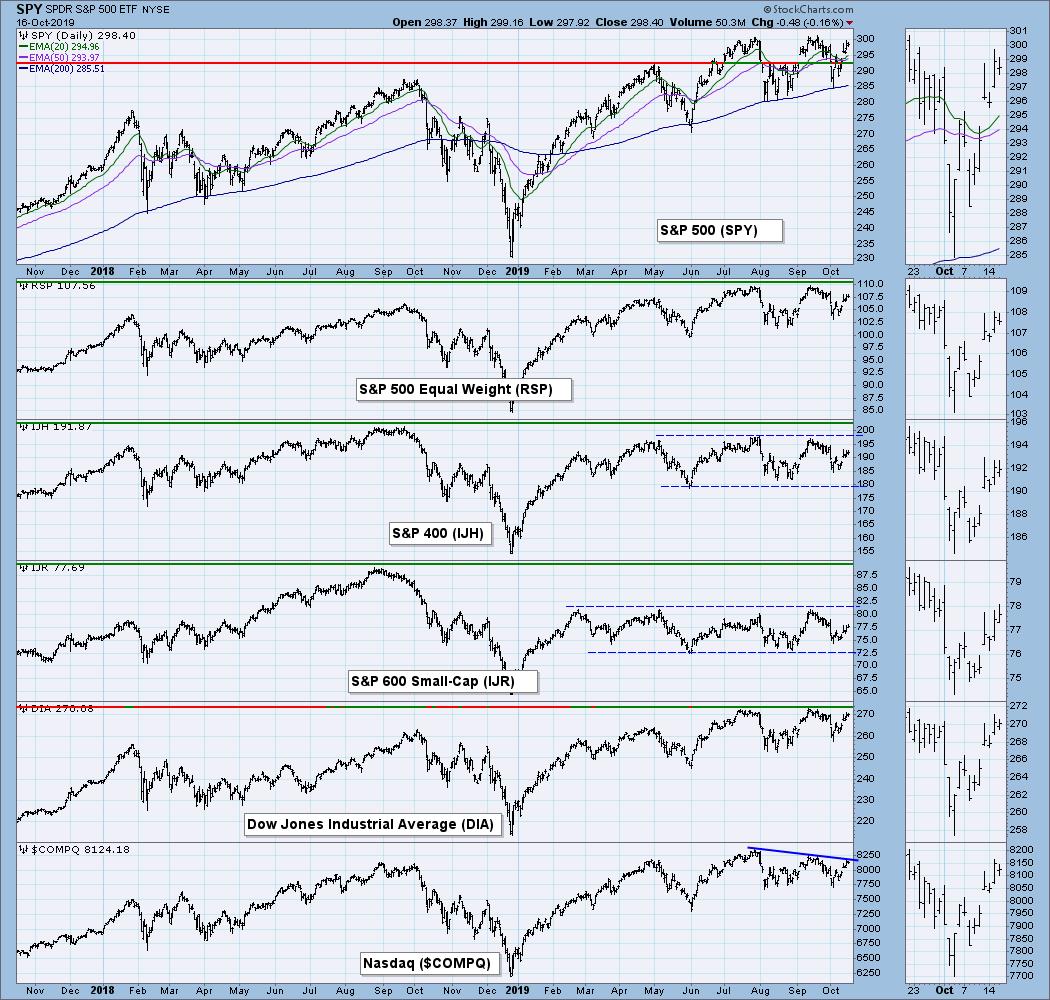
BROAD MARKET INDEXES
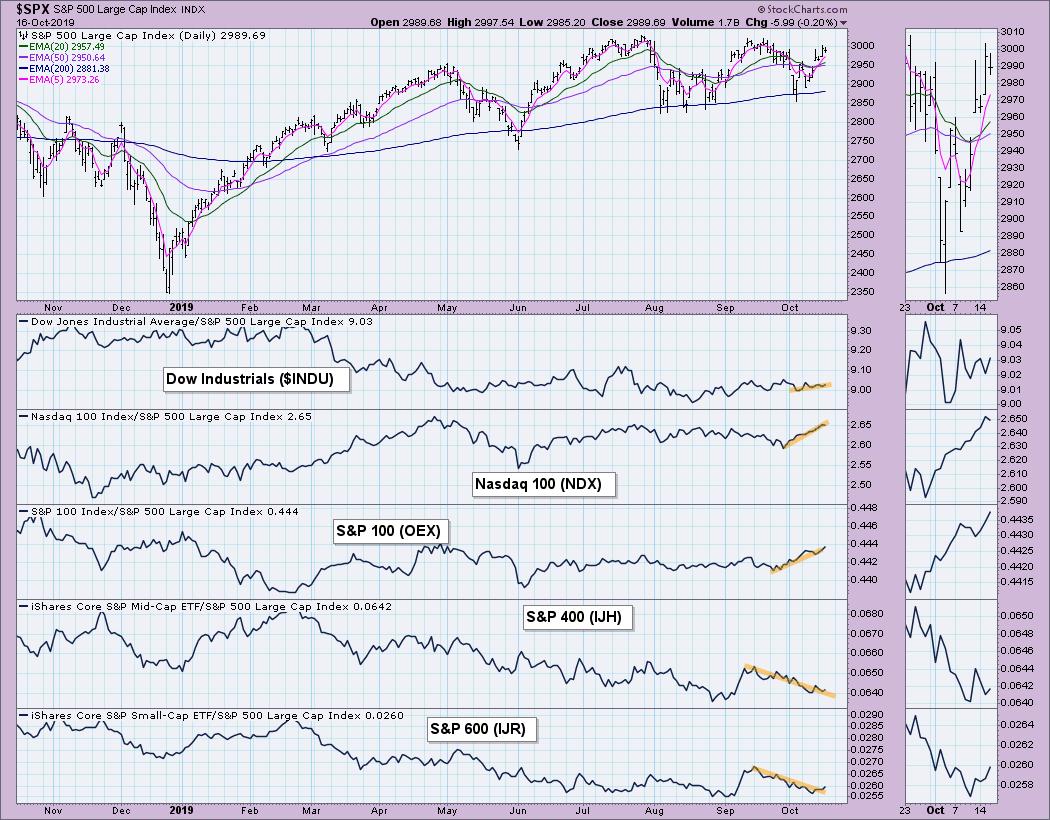
MARKET INDEXES PRICE RELATIVE TO SPX
NDX and OEX are performing better right now, which suggests the larger-cap stocks are leading the current rally off the October low.
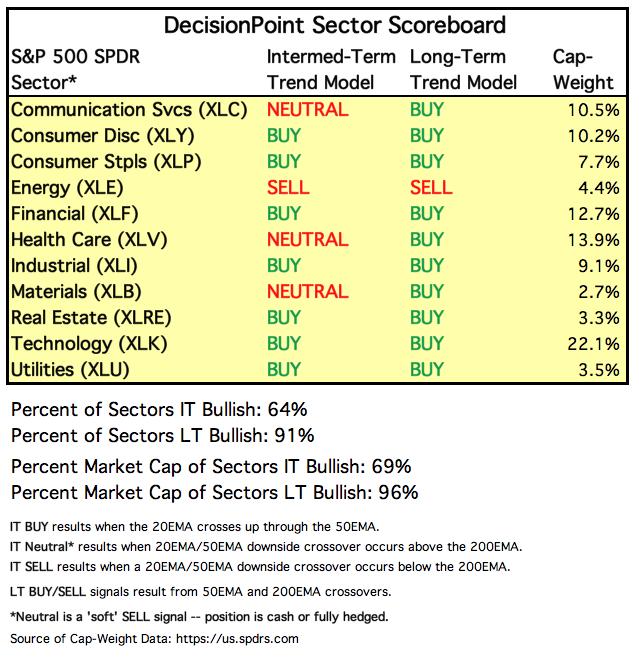
SECTORS
Each S&P 500 Index component stock is assigned to one, and only one, of eleven major sectors. This is a snapshot of the Intermediate-Term and Long-Term Trend Model signal status for those sectors.
STOCKS
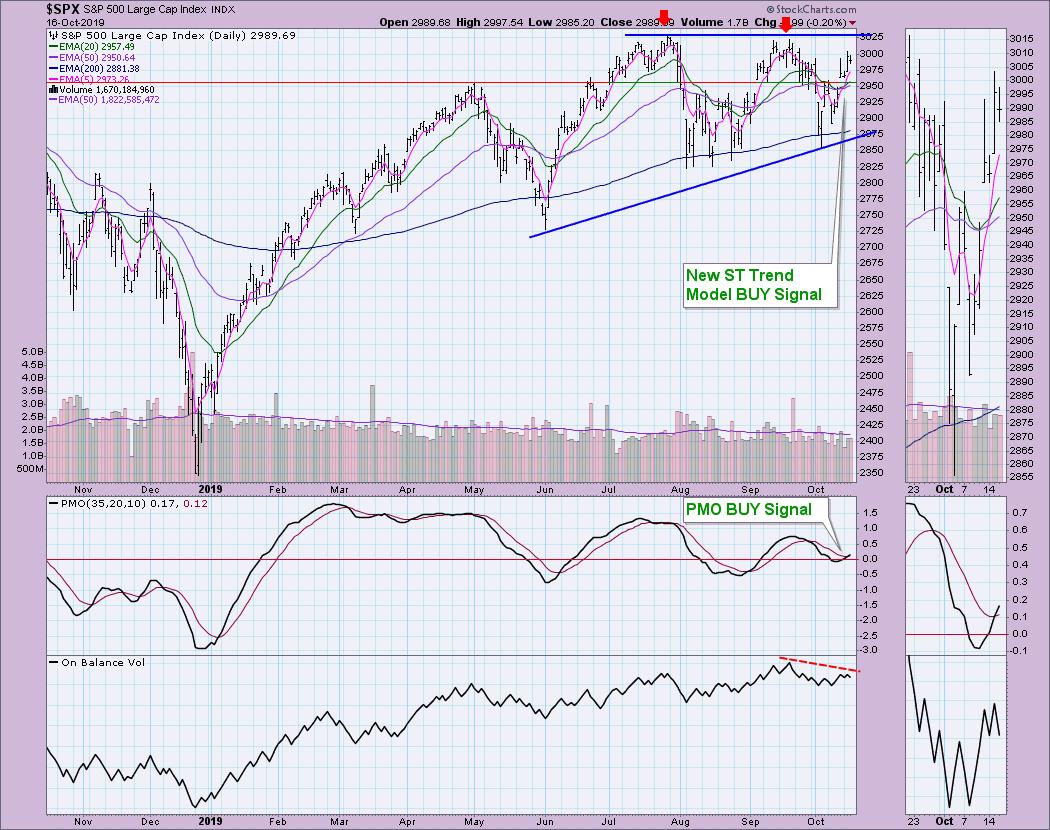
IT Trend Model: BUY as of 9/4/2019
LT Trend Model: BUY (SPY) as of 2/26/2019
SPX Daily Chart: I've annotated the newest BUY signals. The OBV is not confirming this rally. However, if you want to bolster a bullish position on the market, we may have an ascending triangle in play. That would suggest a successful test of all-time highs. The rally off the October low seems "tortured," meaning that, with just about every gain, there has been a subsequent pullback. The PMO looks very good, so it is hard to argue the bearish perspective, but read on about the indicator sets.
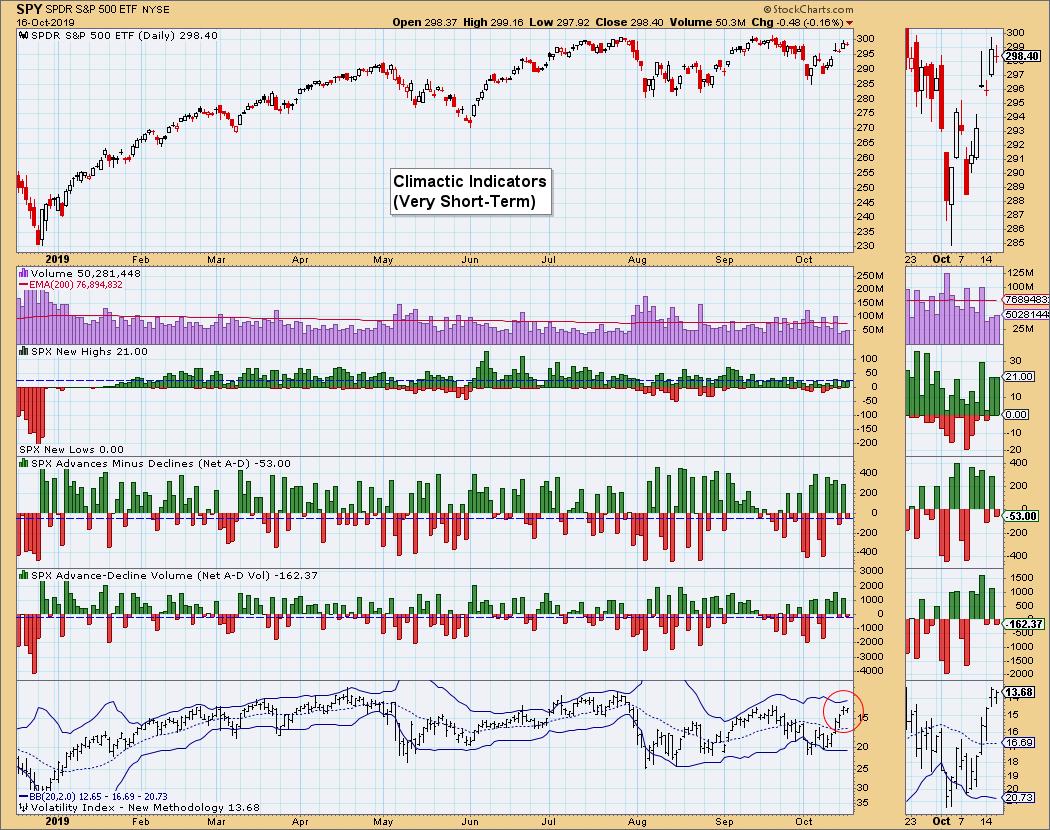
Climactic Market Indicators: No climactic breadth readings, but note the lack of volume this week. Additionally, the VIX is overbought, which could suggest a short-term downside move into the rest of the week.
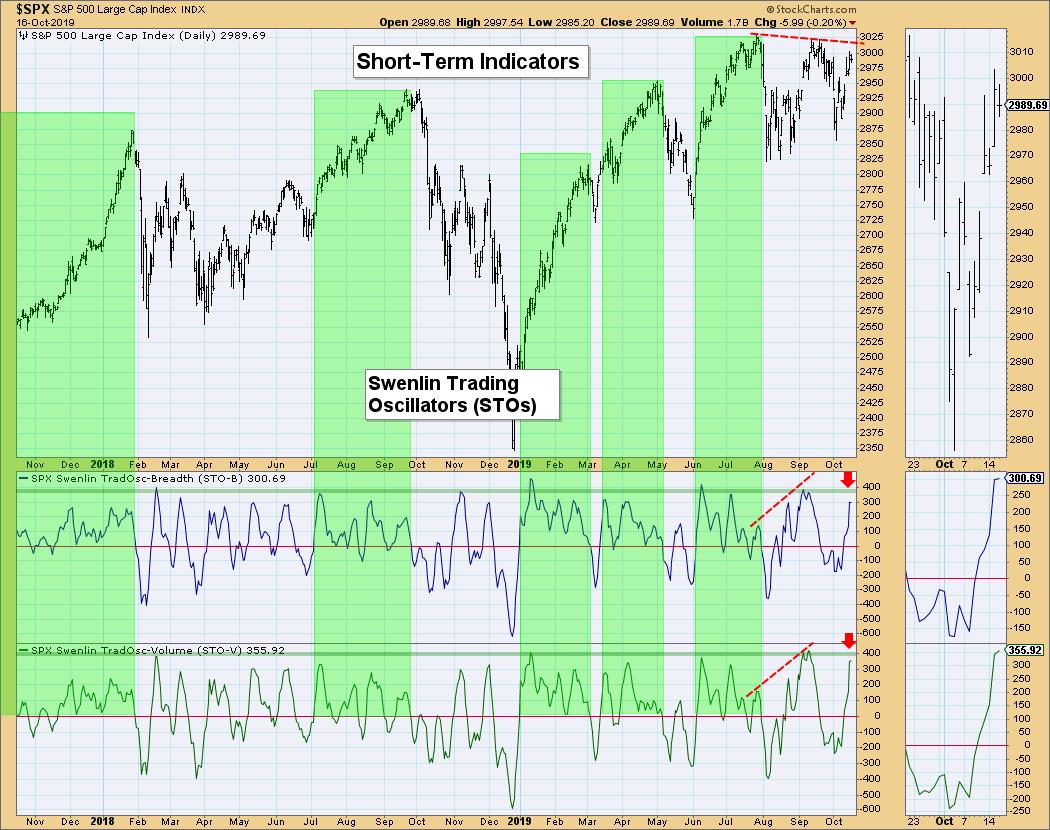
Short-Term Market Indicators: These indicators are very overbought and it appears they are topping. This generally occurs before short-term declines.
Intermediate-Term Market Indicators: The good news is that the IT indicators are looking bullish as they continue to rise after positive crossovers.
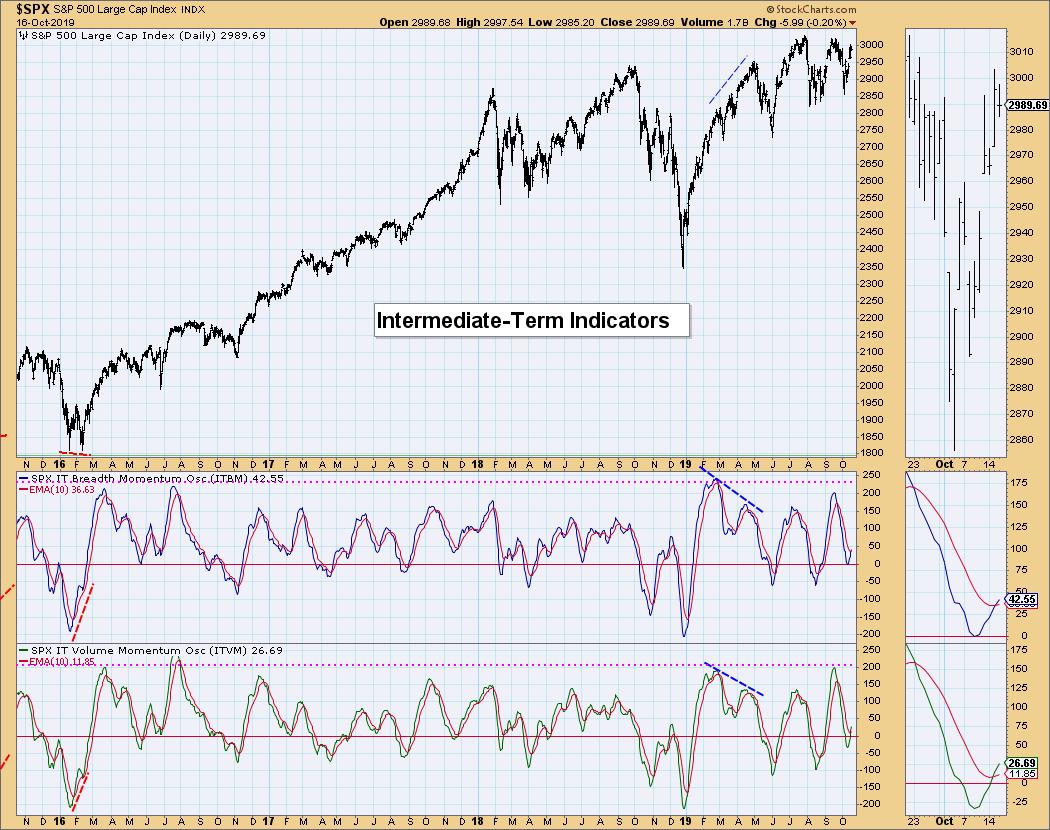
Conclusion: There are certainly some bullish signs for the intermediate term, given the rising ITBM/ITVM and possible ascending triangle formation. However, in the shorter term, indicators suggest we will need some more downside before all-time highs can be challenged.
DOLLAR (UUP)
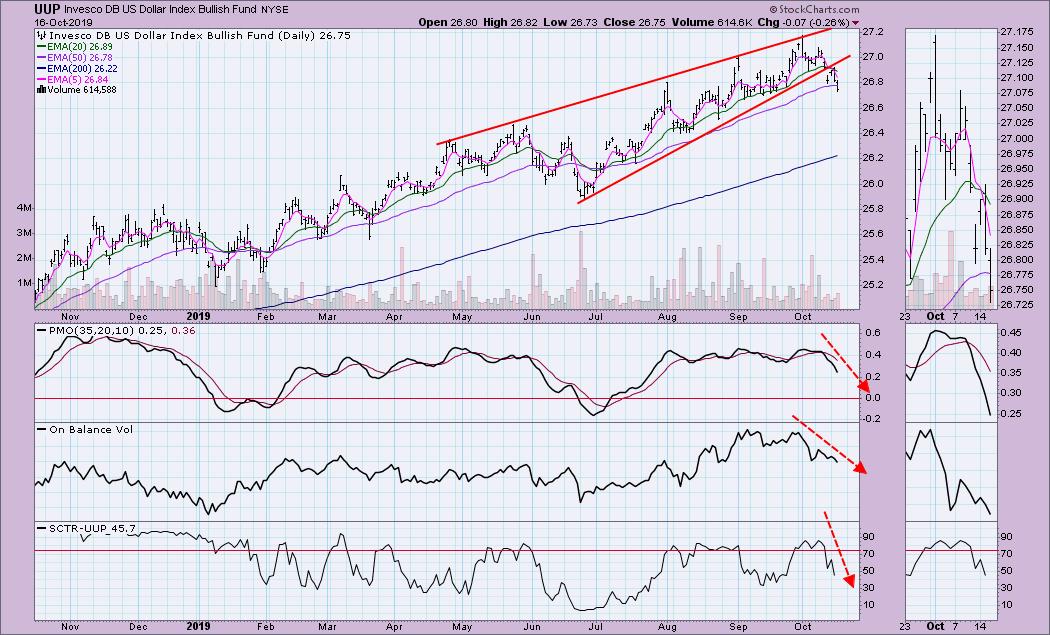
IT Trend Model: BUY as of 2/7/2019
LT Trend Model: BUY as of 5/25/2018
UUP Daily Chart: Very bearish chart for the Dollar. Indicators are plunging lower and a bearish rising wedge has executed. A "back of the napkin" calculation of a minimum downside target for this formation would bring price down to about $26.40. To calculate the minimum downside target for a rising wedge, take the height of the back of the pattern from first top to first bottom, then subtract that from the breakdown point.
GOLD
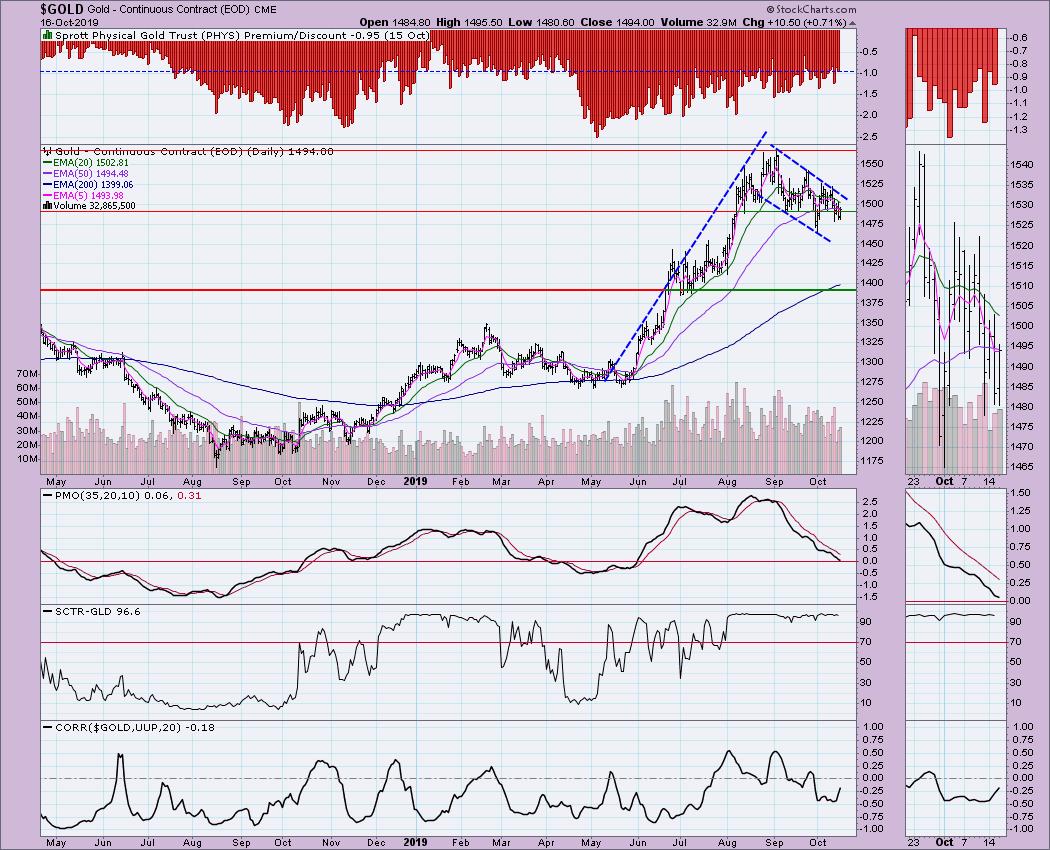
IT Trend Model: BUY as of 6/3/2019
LT Trend Model: BUY as of 1/8/2019
GOLD Daily Chart: I remain bullish on Gold given the possible bull flag on the daily chart (which you can see even more clearly on the weekly chart, included below the daily). The PMO is now in oversold territory and the SCTR remains strong. At this point, the short-term correlation between Gold and the Dollar is close to zero, suggesting that they can travel independent of each other. Discounts are still in effect, which is typically bullish for Gold.
CRUDE OIL (USO)
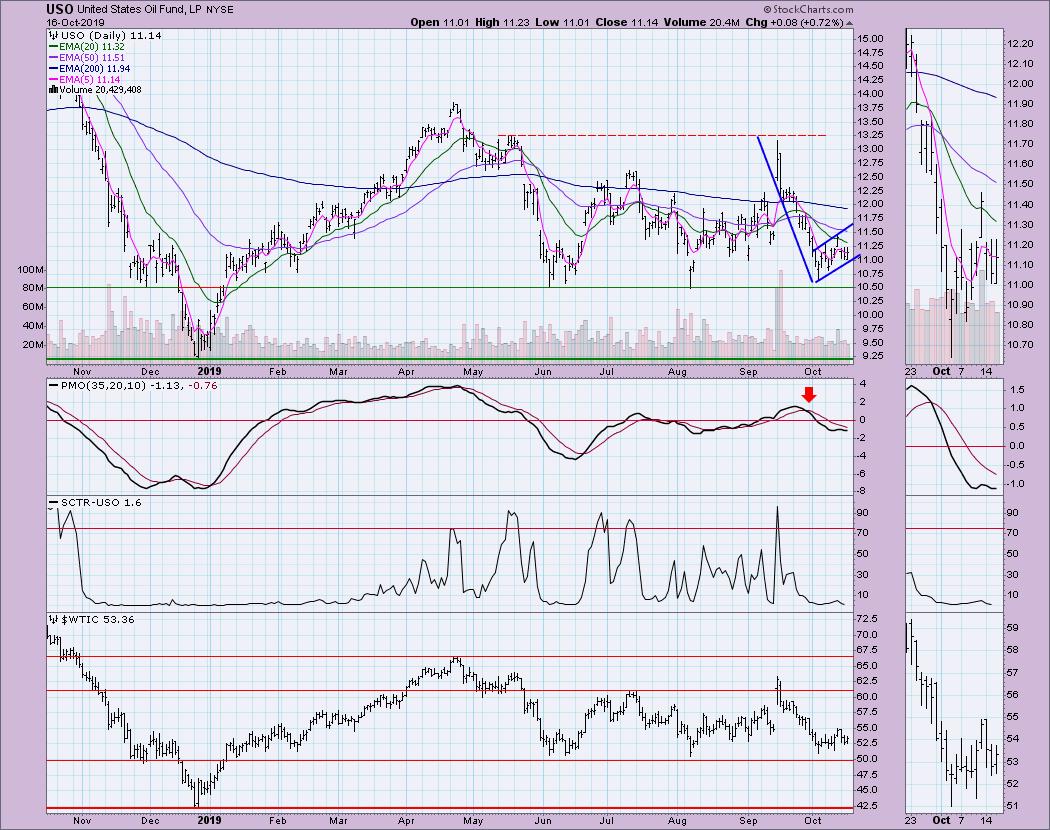
IT Trend Model: SELL as of 10/2/2019
LT Trend Model: SELL as of 6/4/2019
USO Daily Chart: I've annotated a possible reverse flag formation on USO. I don't think we will see the complete fulfillment of the pattern, but it does suggest to me that we could see a breakdown out of the rising trend channel that forms the actual flag. The PMO topped below its signal line, which is bearish. Support should hold at $10.50.
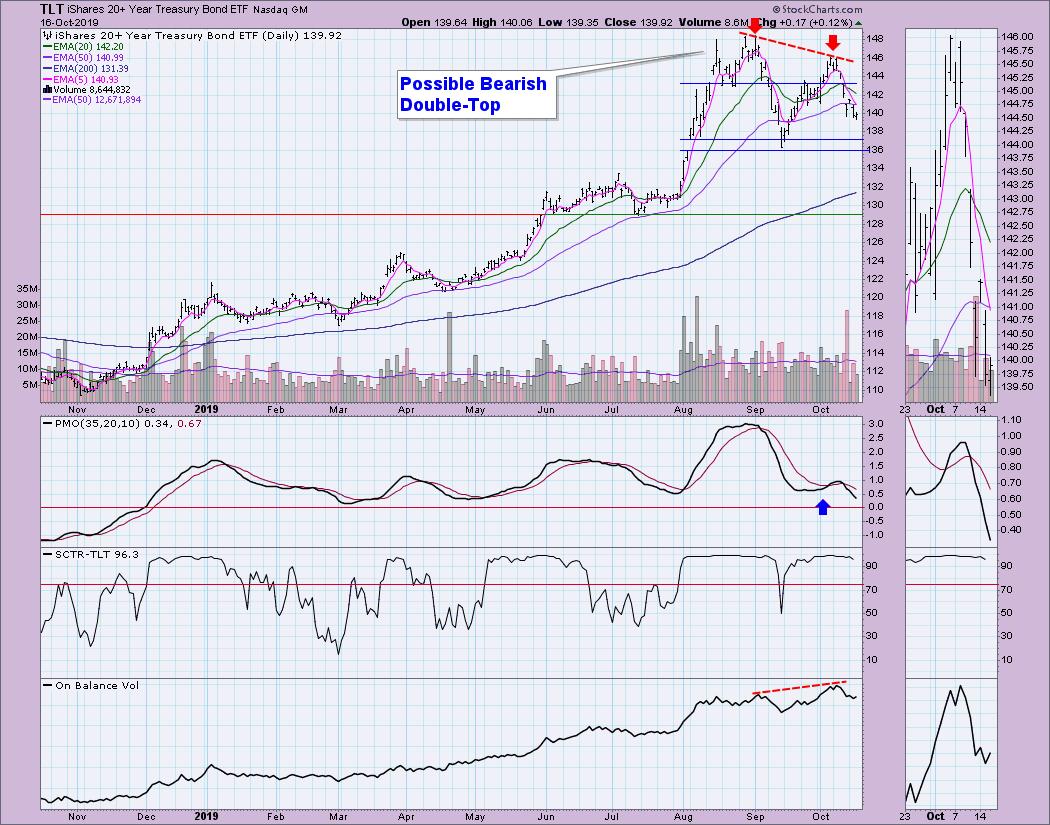
BONDS (TLT)
IT Trend Model: BUY as of 12/6/2018
LT Trend Model: BUY as of 1/2/2019
TLT Daily Chart: It sure looks like a double-top formation on TLT. I see a reverse divergence between price tops and the OBV tops, suggesting that, despite an influx of positive volume, price could not challenge the previous top in September. The SCTR is still strong, but I'm looking for price to test and/or close the gap from early August.
Technical Analysis is a windsock, not a crystal ball.
Happy Charting! - Erin
Email: erinh@stockcharts.com
**Don't miss any of the DecisionPoint commentaries! Go to the "Notify Me" box toward the end of this blog page to be notified as soon as they are published.**
NOTE: The signal status reported herein is based upon mechanical trading model signals, specifically the DecisionPoint Trend Model. These define the implied bias of the price index based upon moving average relationships, but they do not necessarily call for a specific action. They are information flags that should prompt chart review. Further, they do not call for continuous buying or selling during the life of the signal. For example, a BUY signal will probably (but not necessarily) return the best results if action is taken soon after the signal is generated. Additional opportunities for buying may be found as price zigzags higher, but the trader must look for optimum entry points. Conversely, exit points to preserve gains (or minimize losses) may be evident before the model mechanically closes the signal.
Helpful DecisionPoint Links:
DecisionPoint Shared ChartList and DecisionPoint Chart Gallery
Price Momentum Oscillator (PMO)
Swenlin Trading Oscillators (STO-B and STO-V)


