
We are finally seeing indicators that are rising as they should as the market continues to make new all-time highs. I believe the market is still in need of a correction, but, at this point, I can't argue with the charts. My advice is to tread lightly and be more vigilant adjusting stops. The Golden Cross and Silver Cross Indexes are painting an interesting picture. I'll cover that chart below.
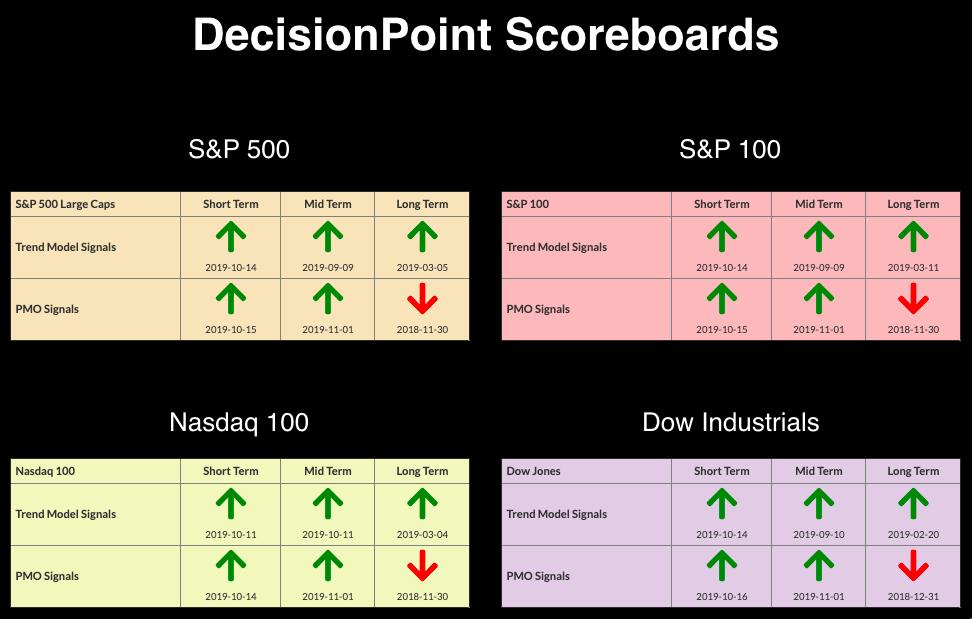
No changes to the DecisionPoint Scoreboards, but, at the end of the last trading day of November, we will have two new Long-Term PMO BUY signals on the SPX and OEX. The monthly PMOs have very few crossovers; generally, it takes well over a year or much longer to get signal changes. The SELL signals came in last November for the SPX, OEX and NDX. Don't miss this Friday's DecisionPoint Weekly Wrap, where Carl will analyze weekly and monthly charts.
The DecisionPoint Alert presents a mid-week assessment of the trend and condition of the stock market (S&P 500), the U.S. Dollar, Gold, Crude Oil and Bonds.
Watch the latest episode of DecisionPoint on StockCharts TV's YouTube channel here!
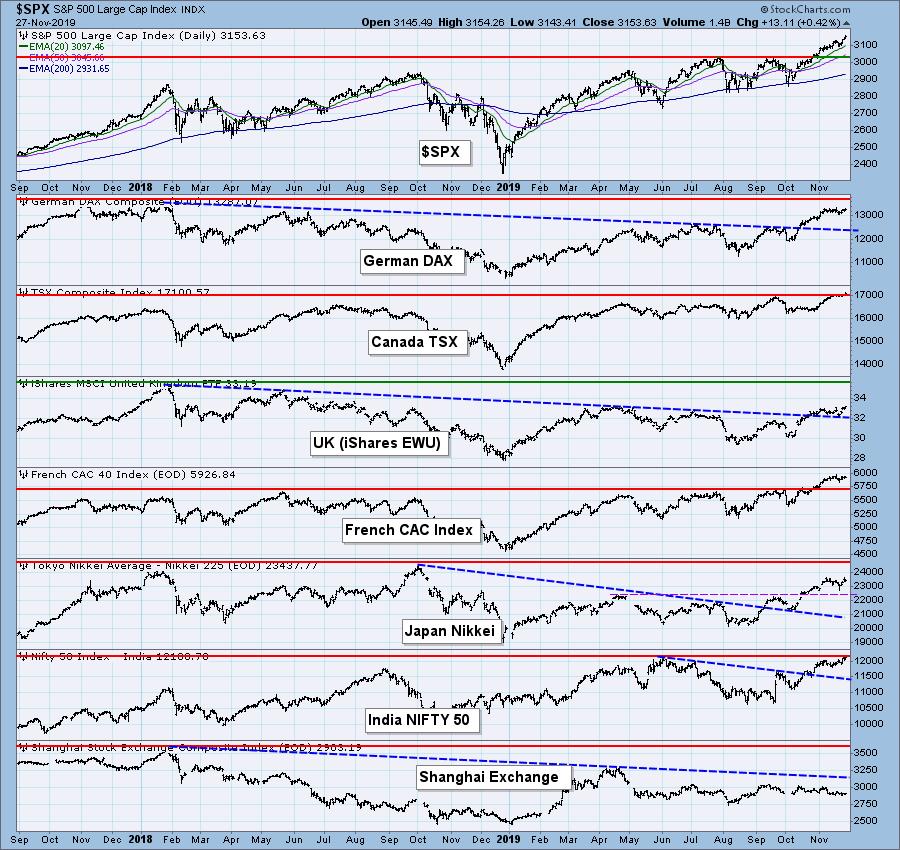
GLOBAL MARKETS
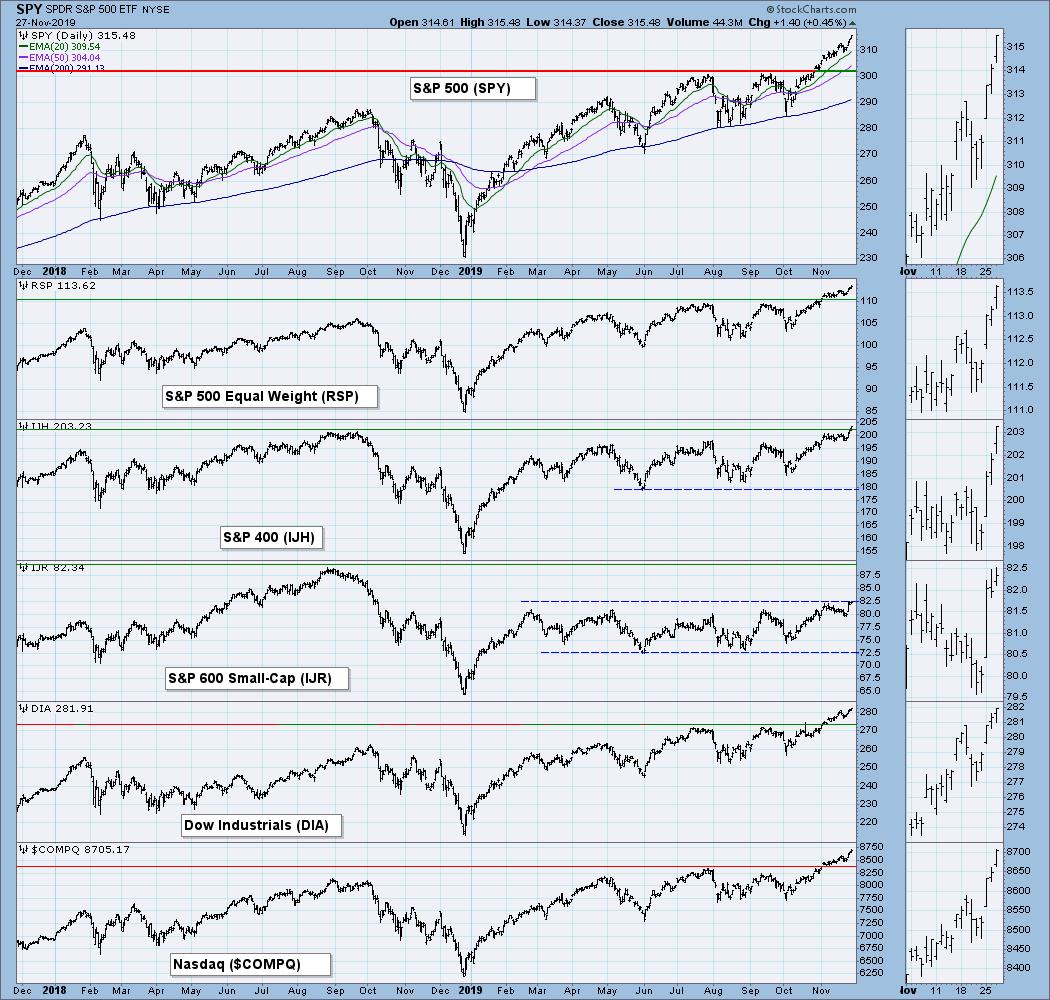
BROAD MARKET INDEXES
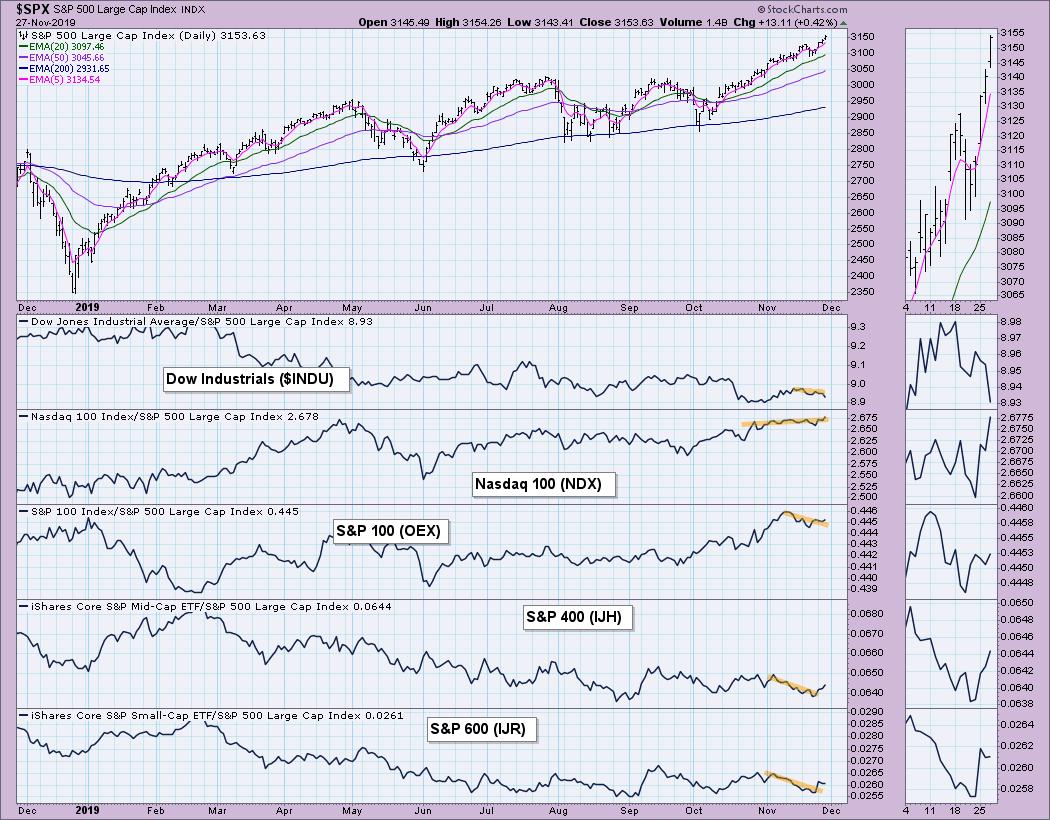
MARKET INDEXES PRICE RELATIVE TO SPX
I'm happy to see the Mid-Caps and Small-Caps outperforming again.
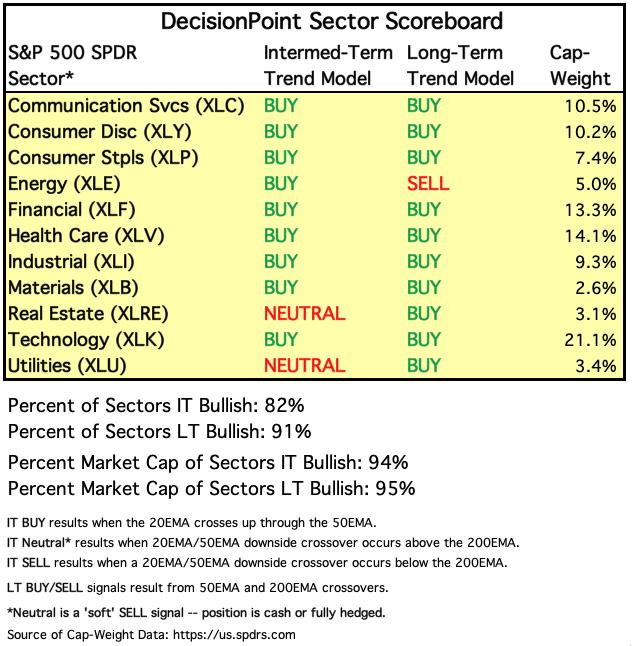
SECTORS
Each S&P 500 Index component stock is assigned to one, and only one, of eleven major sectors. This is a snapshot of the Intermediate-Term and Long-Term Trend Model signal status for those sectors.
STOCKS
IT Trend Model: BUY as of 9/4/2019
LT Trend Model: BUY (SPY) as of 2/26/2019
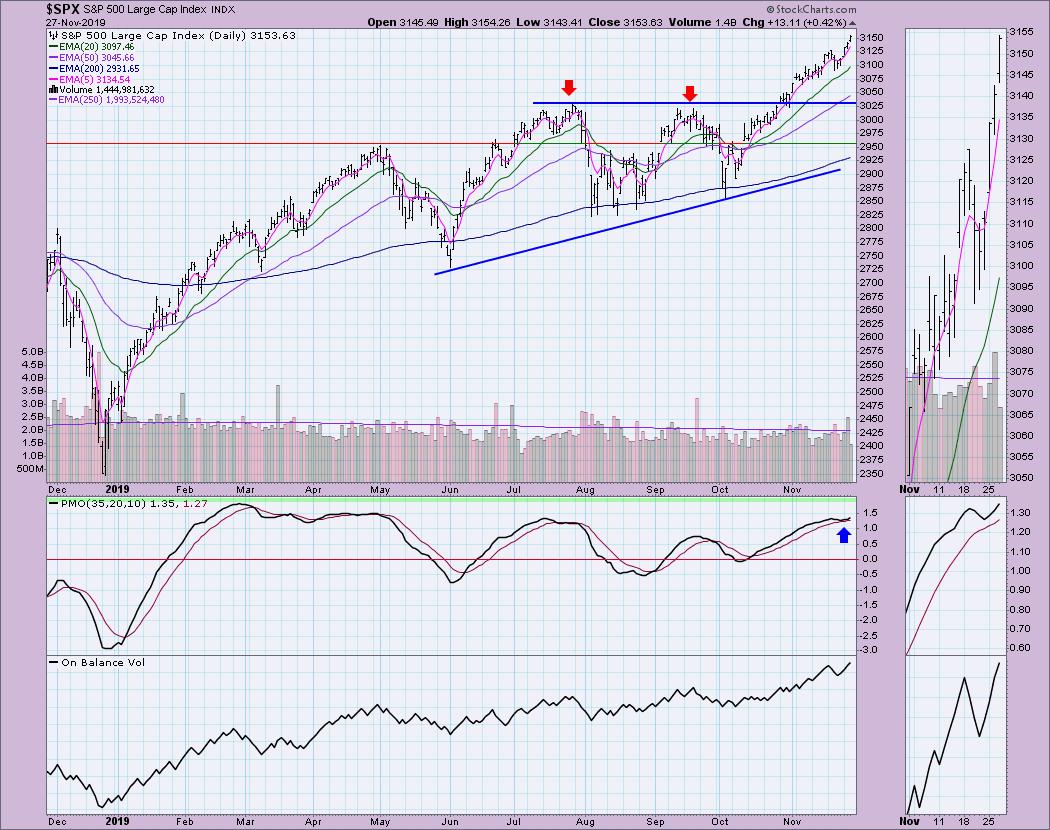
SPX Daily Chart: The market appeared ready to begin at least a pullback last week, but the danger was almost immediately averted and the rally is back on. The acceleration of upside movement this week has been impressive and our indicators are confirming that fact, from the PMO to the OBV.
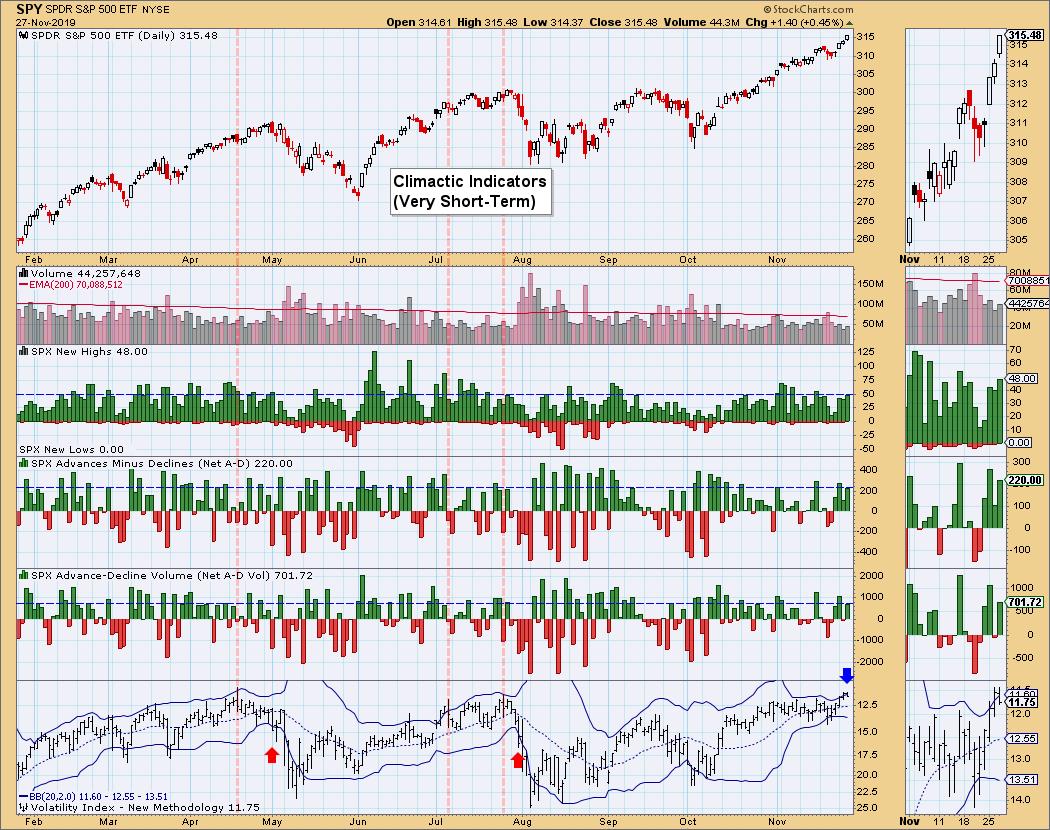
Climactic Market Indicators: We are seeing climactic readings on breadth and we now have the VIX penetrating the upper Bollinger Band. Typically, this leads to a pause or decline. However, the Bands have squeezed and are now in a position to see either band easily broken, so I'm not as confident. However, the readings are very low on the VIX. The last time we saw readings this low, it preceded a deep decline by a few days. But, again, the rest of the indicators are healthy and, while volume is weak on this week's rally, I would chalk some of that up to holiday trading. Friday will be even lower. I'll be interested to see if volume picks up next week.
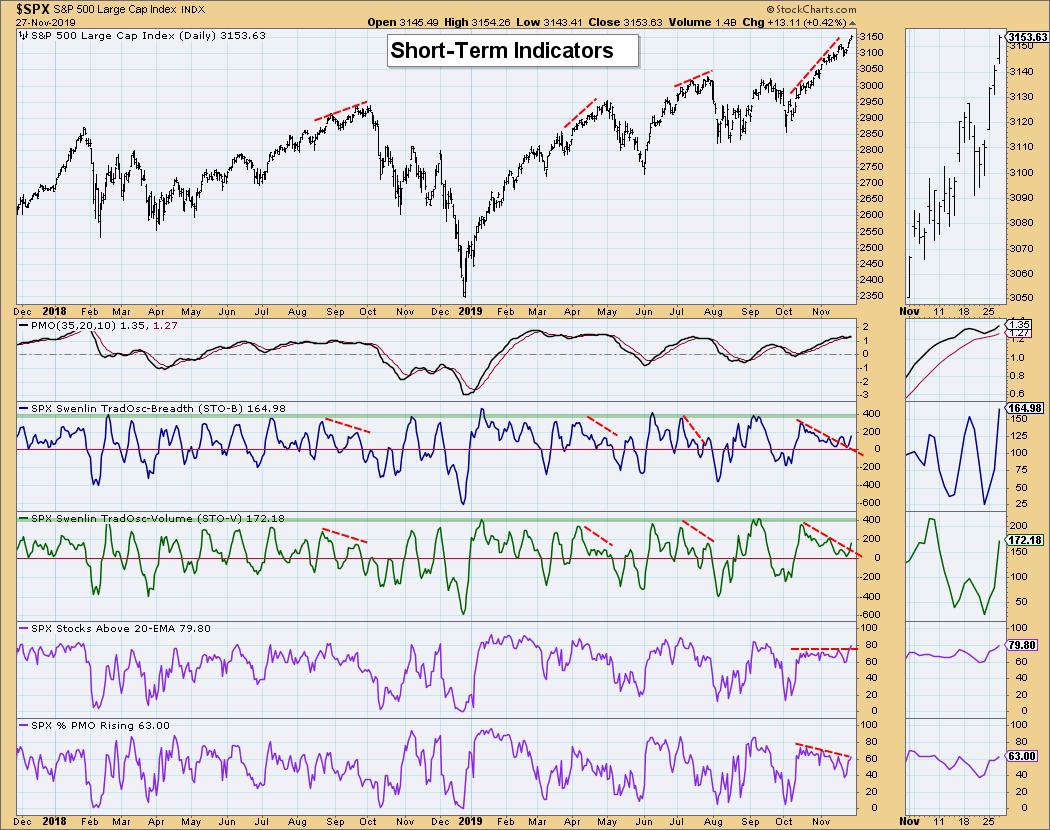
Short-Term Market Indicators: The Swenlin Trading Oscillators have finally both broken their declining trend. This was worrisome as it was causing a negative divergence with price. However, we now have a PMO bottom above the signal line and rising in only somewhat overbought territory. I like that the Stocks above their 20-EMA is beginning to perk up; I'd like to see more positive action with % of PMOs rising, but we are looking at almost 2/3 with rising PMOs, which isn't terrible.
Intermediate-Term Market Indicators: The ITBM logged a positive crossover from its signal line, and the ITVM isn't far behind. We still have ugly negative divergences of declining tops paired with steeply rising price tops, so we should expect a correction. Right now, the market is showing strength.
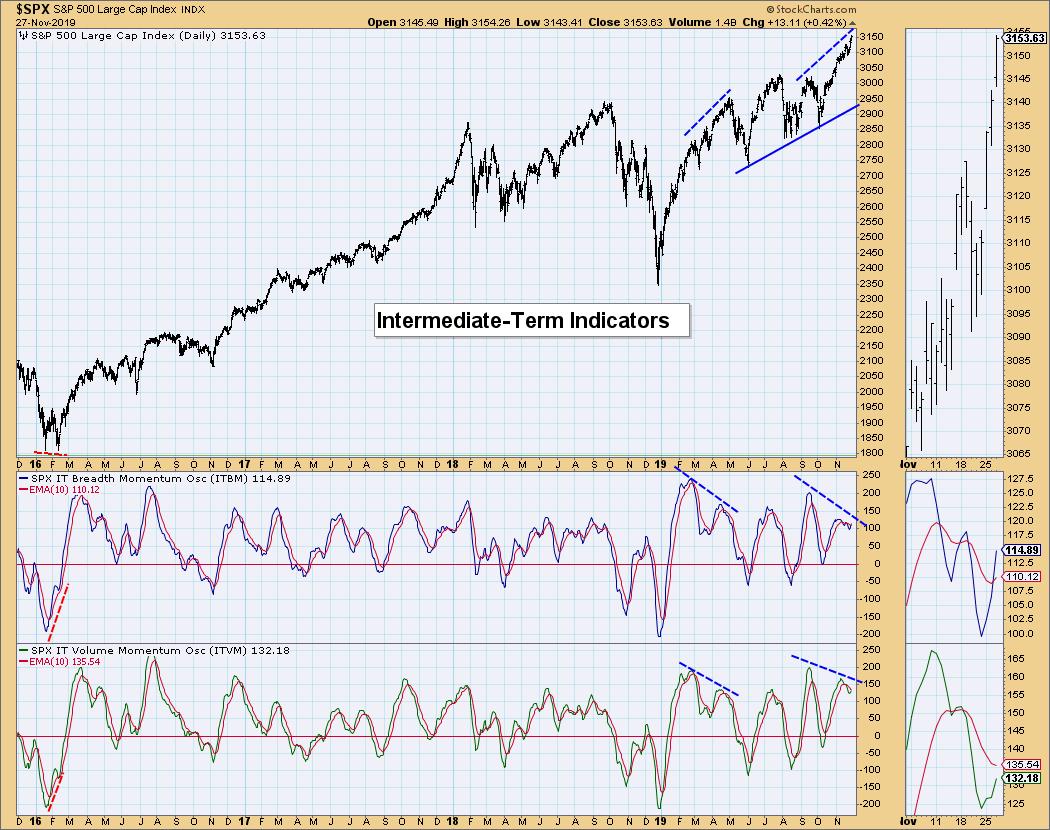
Conclusion: Last week's DP Alert was far more bearish than today's. The indicators have perked up and are confirming the current rally to new all-time highs. The short-term is bullish, but I am still uncomfortable with the intermediate-term based on the negative divergences of the ITBM/ITVM.
DOLLAR (UUP)
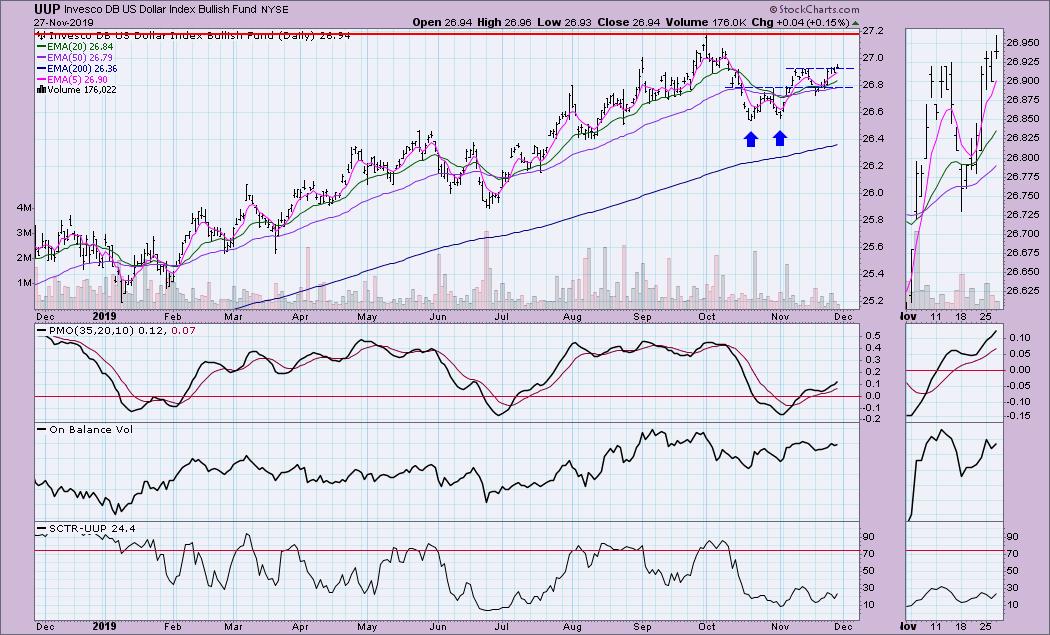
IT Trend Model: BUY as of 11/7/2019
LT Trend Model: BUY as of 5/25/2018
UUP Daily Chart: I continue to hold UUP in my portfolio. The PMO looks positive. I'm concerned about the declining OBV tops, but, again, I think volume is somewhat skewed right now by holiday trading. My target is the September top. I'll reevaluate then.
GOLD
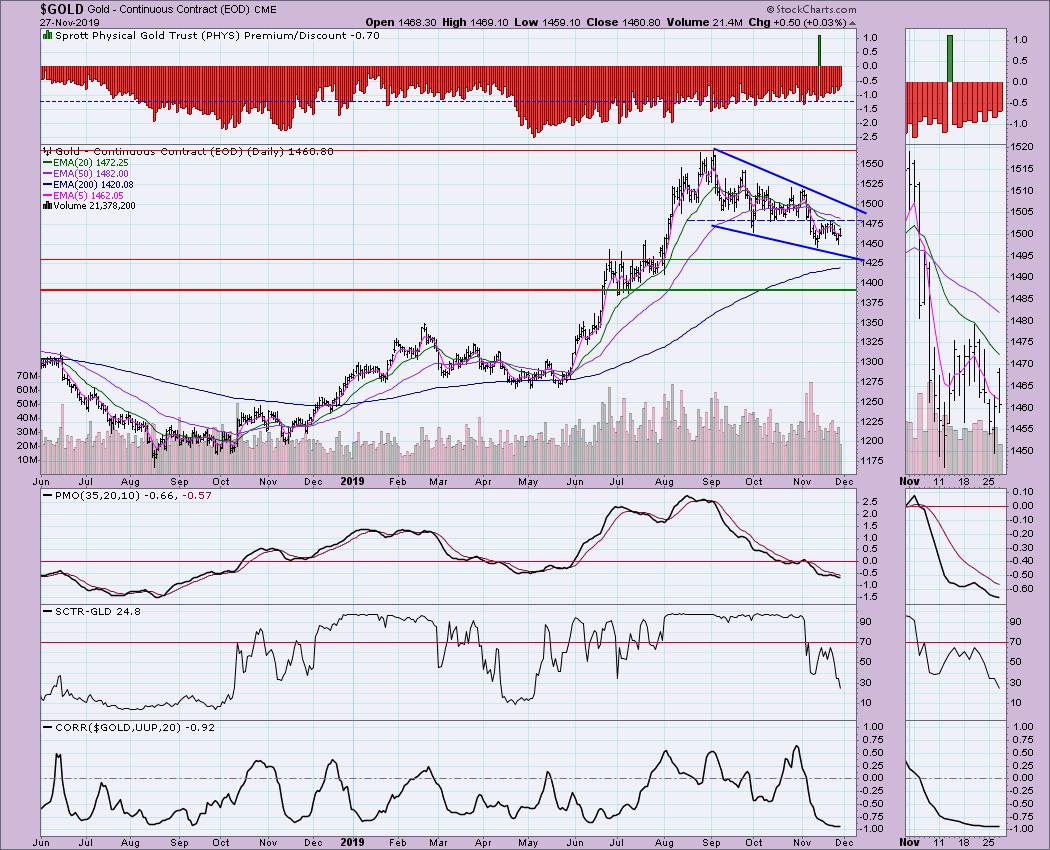
IT Trend Model: Neutral as of 11/8/2019
LT Trend Model: BUY as of 1/8/2019
GOLD Daily Chart: I had originally been looking at a bull flag formation, but it was taking too long to execute. Now, we have a declining or falling wedge. These are bullish patterns, so we should expect an upside breakout. I'm not completely bullish on Gold, at least not yet. The indicators are still falling and the discounts are getting lower. When discounts are low or premiums show up, that typically means that participants are bullish. Sentiment is contrarian, so this tells me that Gold still has some more decline to face. The PMO topped below its signal line and is still falling. It looks like it is ready to turn things around, but I suspect there will be another test of the bottom of the wedge, or at least some grinding across the pattern.
CRUDE OIL (USO)
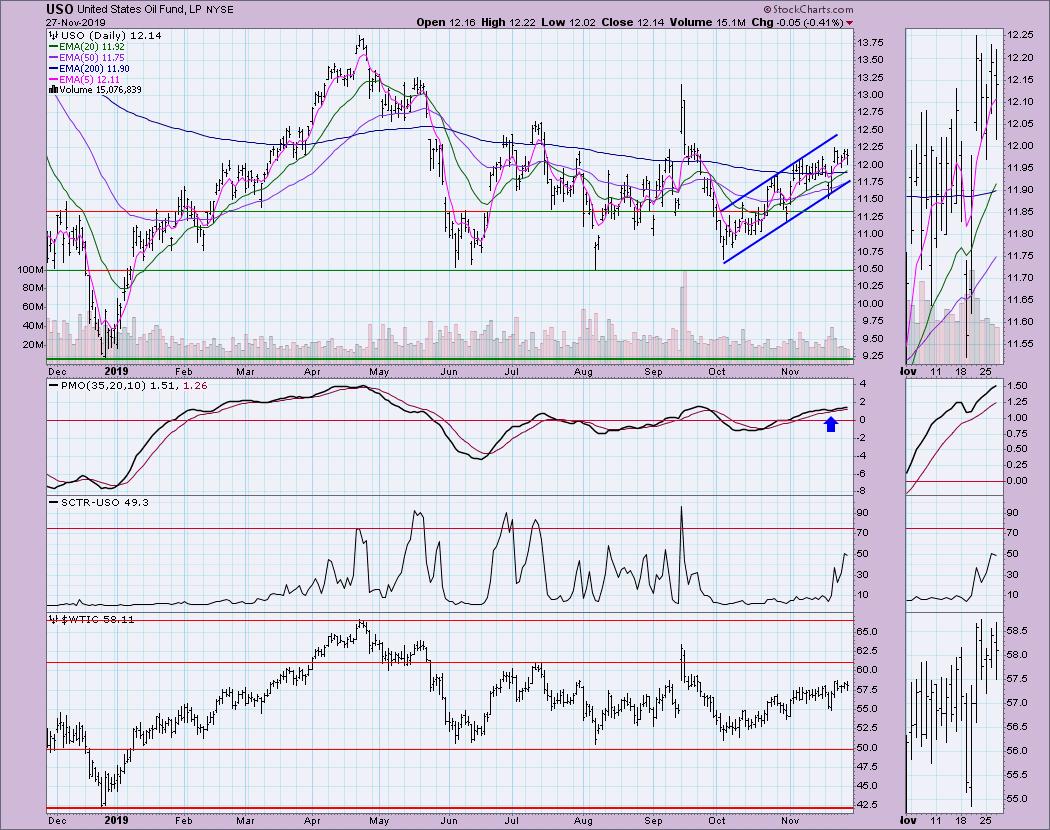
IT Trend Model: SELL as of 10/2/2019
LT Trend Model: SELL as of 6/4/2019
USO Daily Chart: Oil still looks healthy overall. Price remains in a rising trend channel and the PMO is rising. The SCTR is respectable. I suspect we will see more price movement within the rising trend.
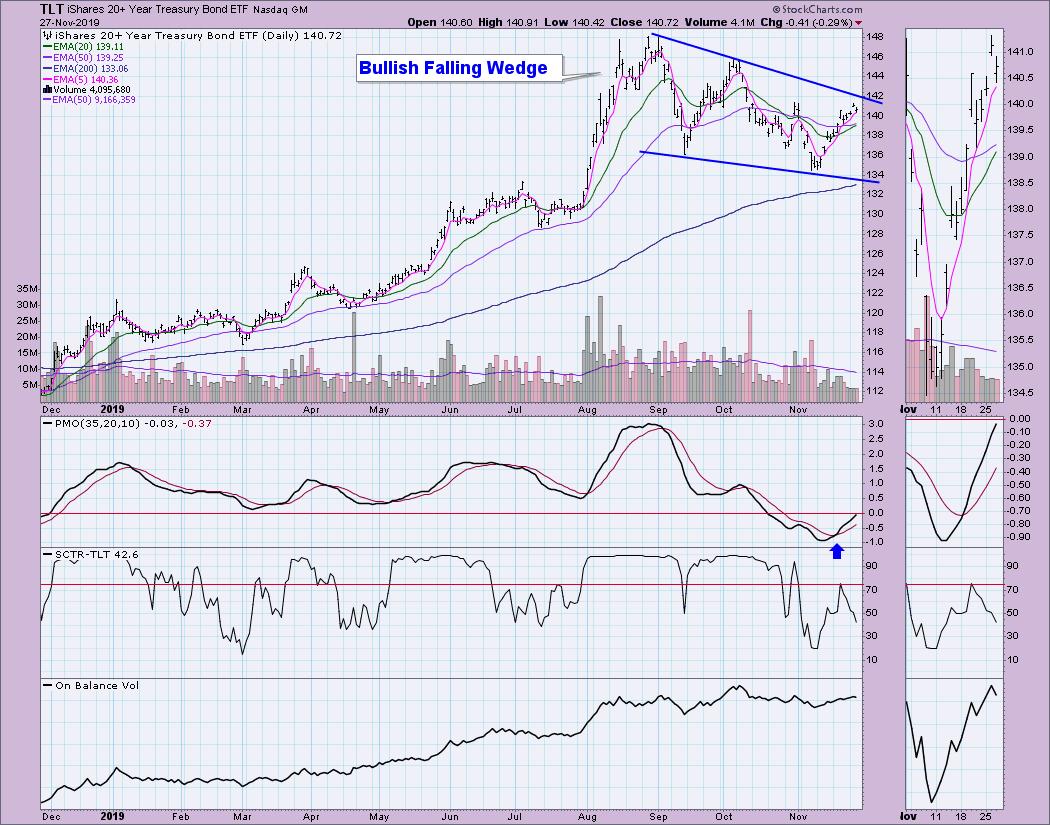
BONDS (TLT)
IT Trend Model: Neutral as of 10/28/2019
LT Trend Model: BUY as of 1/2/2019
TLT Daily Chart: Last week, I wrote about the disintegration of the double-top pattern, which had executed on the November low but then immediately righted itself. Now, we have a bullish falling wedge pattern. The expectation is an upside breakout. The PMO triggered a BUY signal last week. The 20-EMA is about to cross above the 50-EMA, which will generate an IT Trend Model BUY signal. I may add TLT to my portfolio, as I am looking for a move to the September high.
Technical Analysis is a windsock, not a crystal ball.
Happy Charting! - Erin
Email: erinh@stockcharts.com
Do Not Miss Market Vision 2020 Online Conference!
I will be presenting at the "Market Vision 2020" online conference on January 4th! It is sponsored by EarningsBeats.com and promises to be "THE" event to start the new year. We will have many of the commentators that you love presenting their "market view" for 2020, with John Murphy as the keynote speaker! For information on the event, sign up for the free emails that will give you all the details as we get closer!

Erin Swenlin will be presenting at the The MoneyShow Las Vegas May 11-13, 2020! You'll have an opportunity to meet Erin and discuss the latest DecisionPoint news and Diamond Scans. The conference is free to attend or view online!
**Don't miss any of the DecisionPoint commentaries! Go to the "Notify Me" box toward the end of this blog page to be notified as soon as they are published.**
NOTE: The signal status reported herein is based upon mechanical trading model signals, specifically the DecisionPoint Trend Model. These define the implied bias of the price index based upon moving average relationships, but they do not necessarily call for a specific action. They are information flags that should prompt chart review. Further, they do not call for continuous buying or selling during the life of the signal. For example, a BUY signal will probably (but not necessarily) return the best results if action is taken soon after the signal is generated. Additional opportunities for buying may be found as price zigzags higher, but the trader must look for optimum entry points. Conversely, exit points to preserve gains (or minimize losses) may be evident before the model mechanically closes the signal.
Helpful DecisionPoint Links:
DecisionPoint Shared ChartList and DecisionPoint Chart Gallery
Price Momentum Oscillator (PMO)
Swenlin Trading Oscillators (STO-B and STO-V)


