The current rally was launched off the early-October low. Since then, the market has entered a period of very low volatility, characterized by a reluctance to decline, and a penchant for small, daily advances. There was a high volume spike on Tuesday that I will attribute to traders going flat for the holiday; otherwise, volume has been rather thin. While October is uncharacteristically early for a Santa Claus rally initiation, it looks as if that's what we've got.
The DecisionPoint Weekly Wrap presents an end-of-week assessment of the trend and condition of the stock market (S&P 500), the U.S. Dollar, Gold, Crude Oil, and Bonds.
Watch the latest episode of DecisionPoint on StockCharts TV's YouTube channel here!
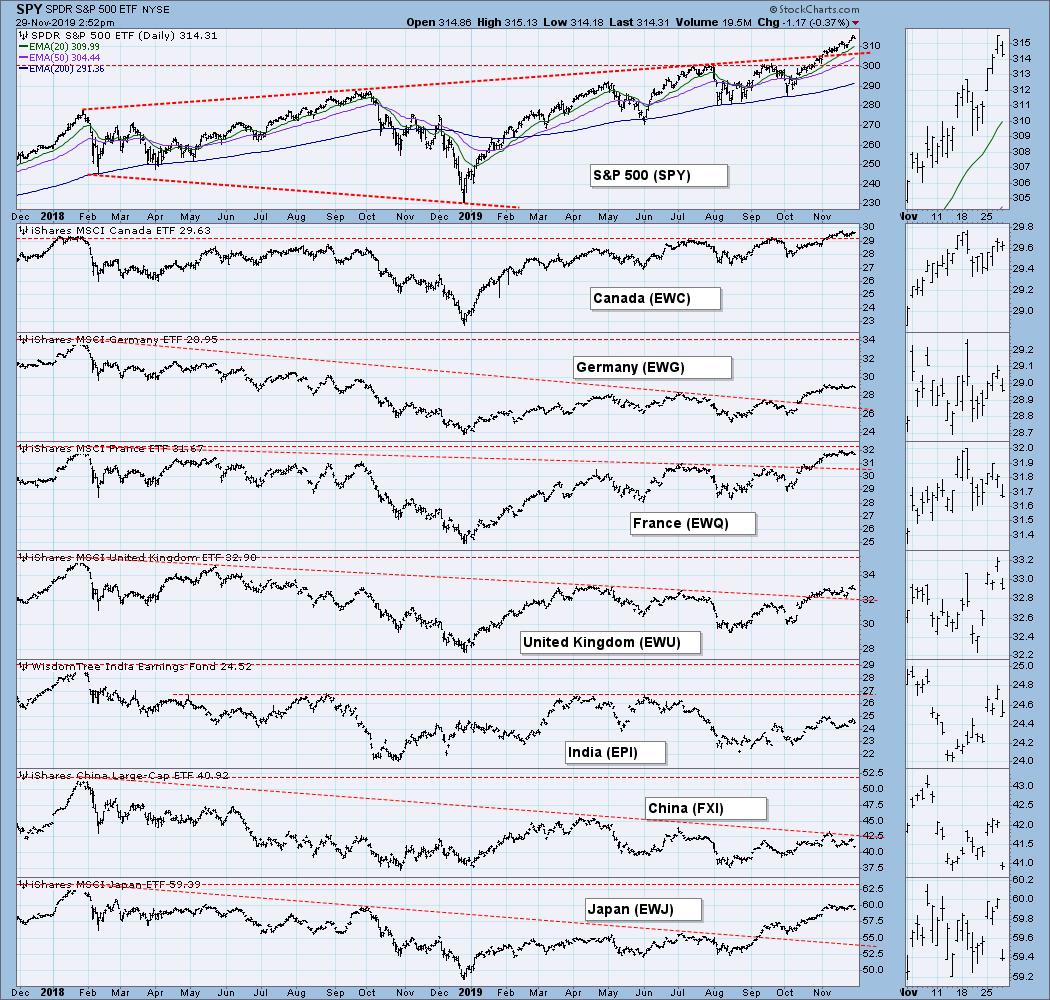
GLOBAL MARKETS
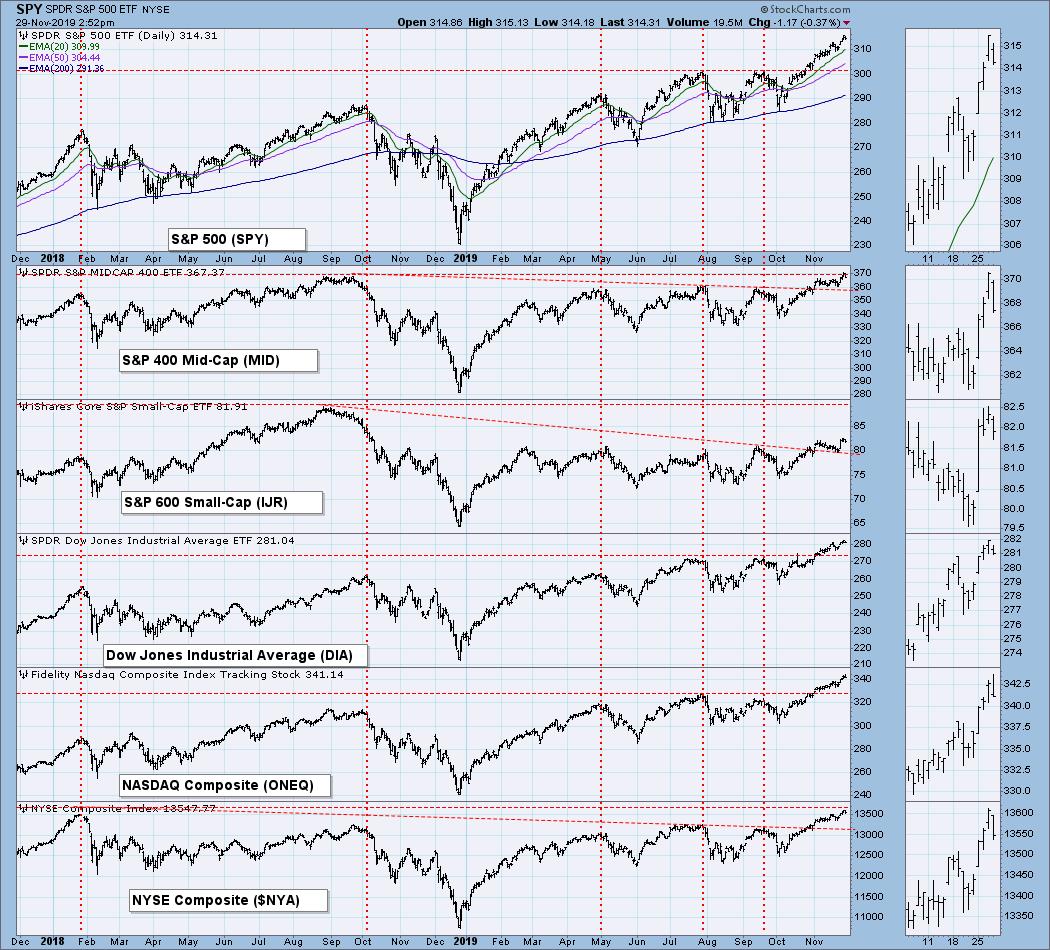
BROAD MARKET INDEXES
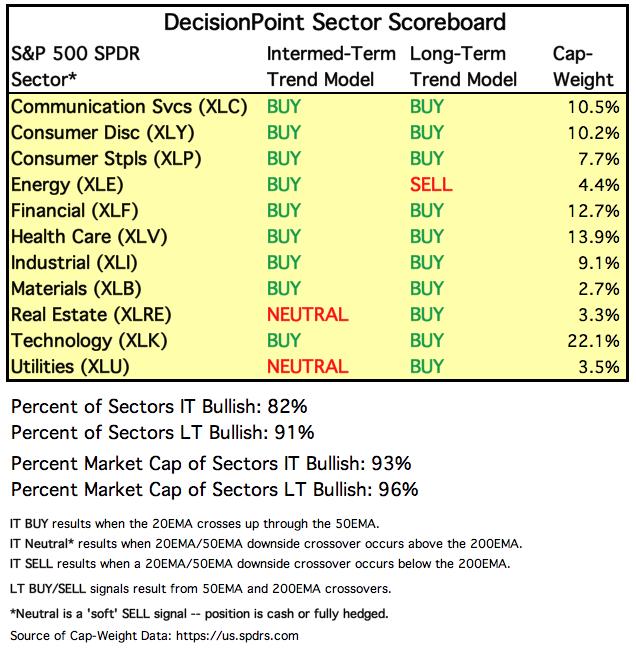
SECTORS
Each S&P 500 Index component stock is assigned to one, and only one, of 11 major sectors. This is a snapshot of the Intermediate-Term and Long-Term Trend Model signal status for those sectors.
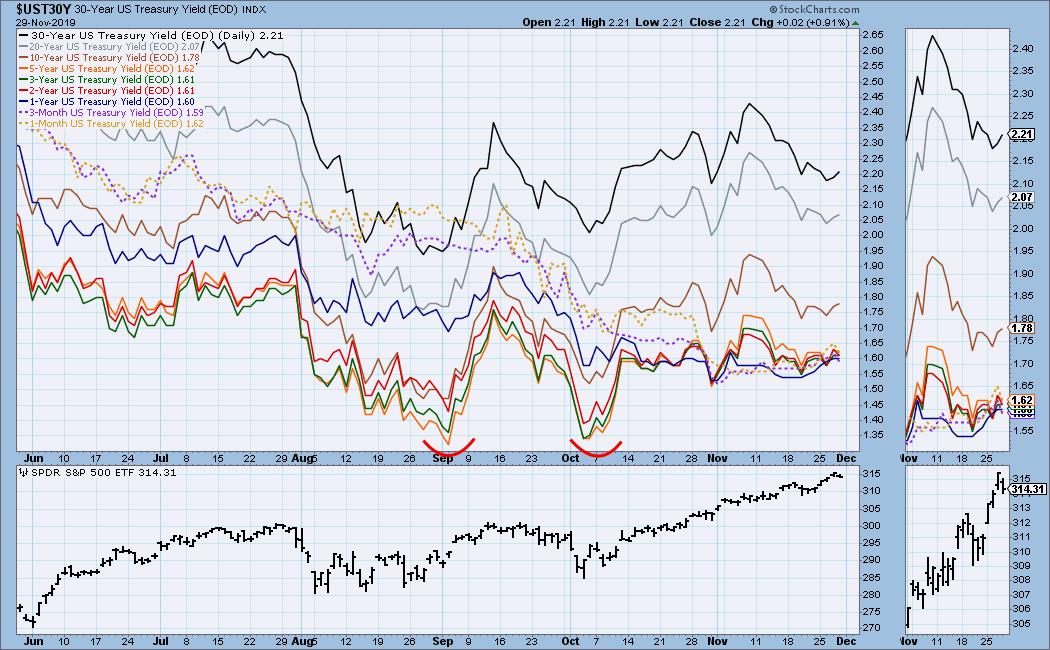
INTEREST RATES
This chart is included so we can monitor rate inversions. In normal circumstances the longer money is borrowed the higher the interest rate that must be paid. When rates are inverted, the reverse is true.
STOCKS
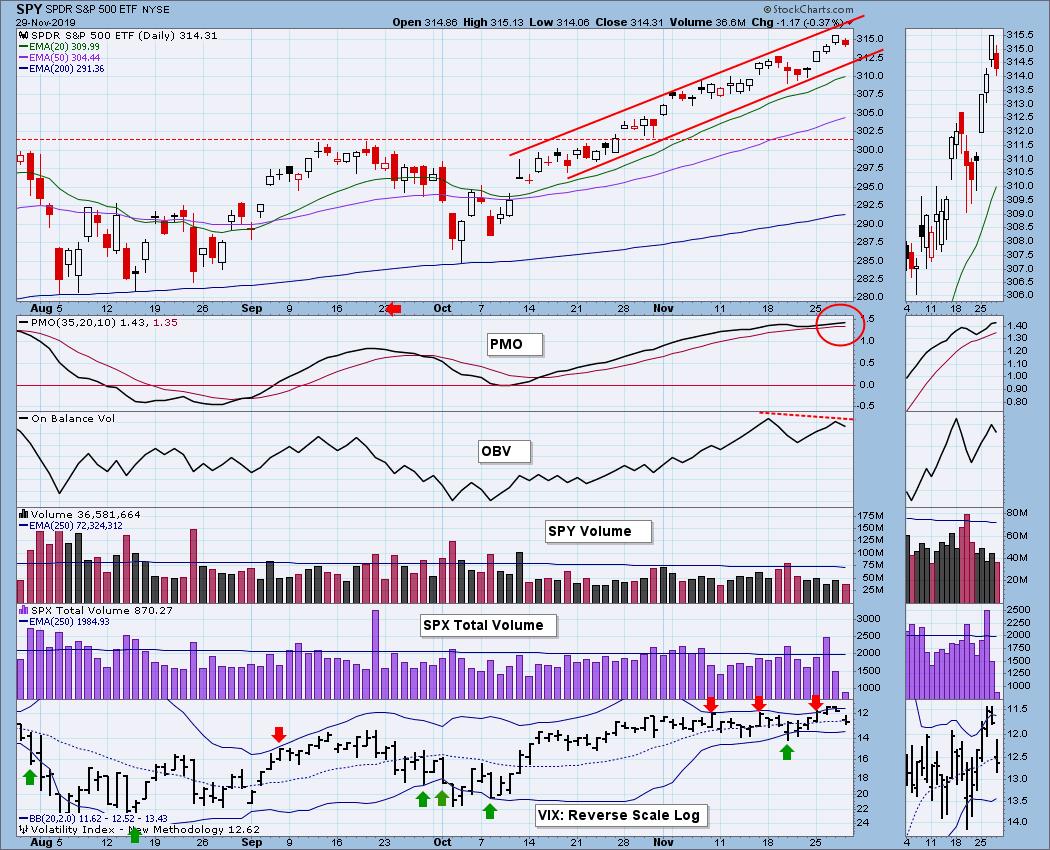
IT Trend Model: BUY as of 9/6/2019
LT Trend Model: BUY as of 2/26/2019
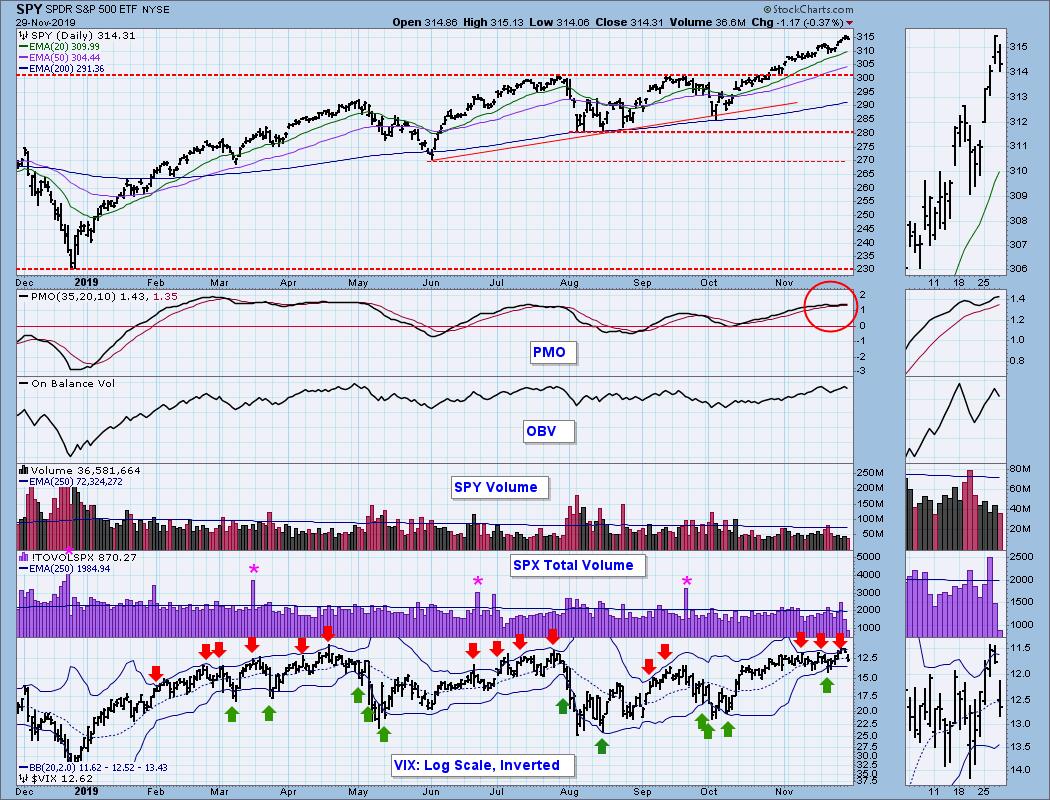
SPY Daily Chart: The Bollinger Bands are choking the overbought VIX, a condition that will probably lead to a pullback.
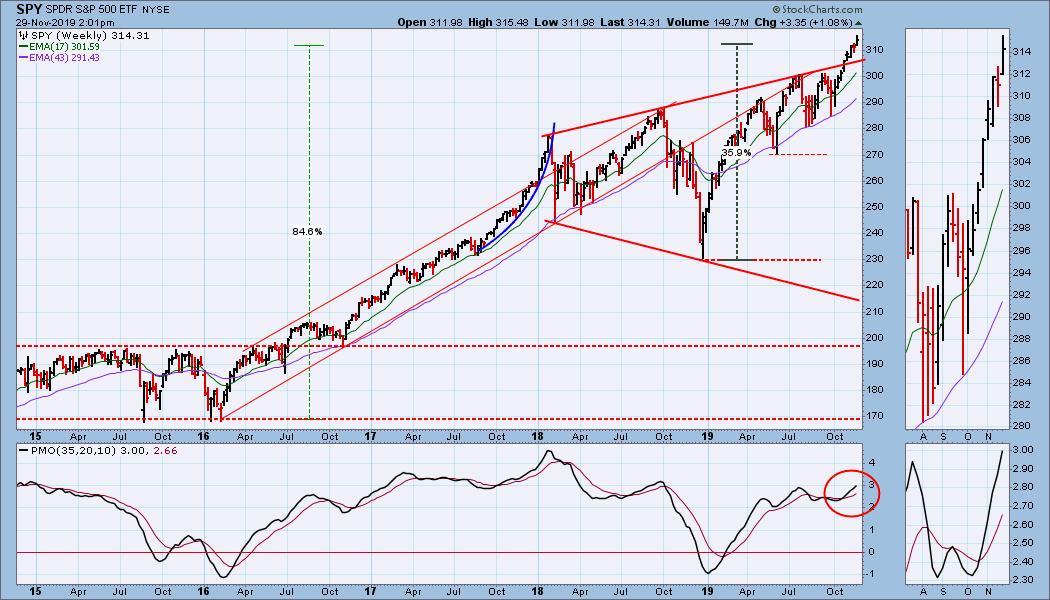
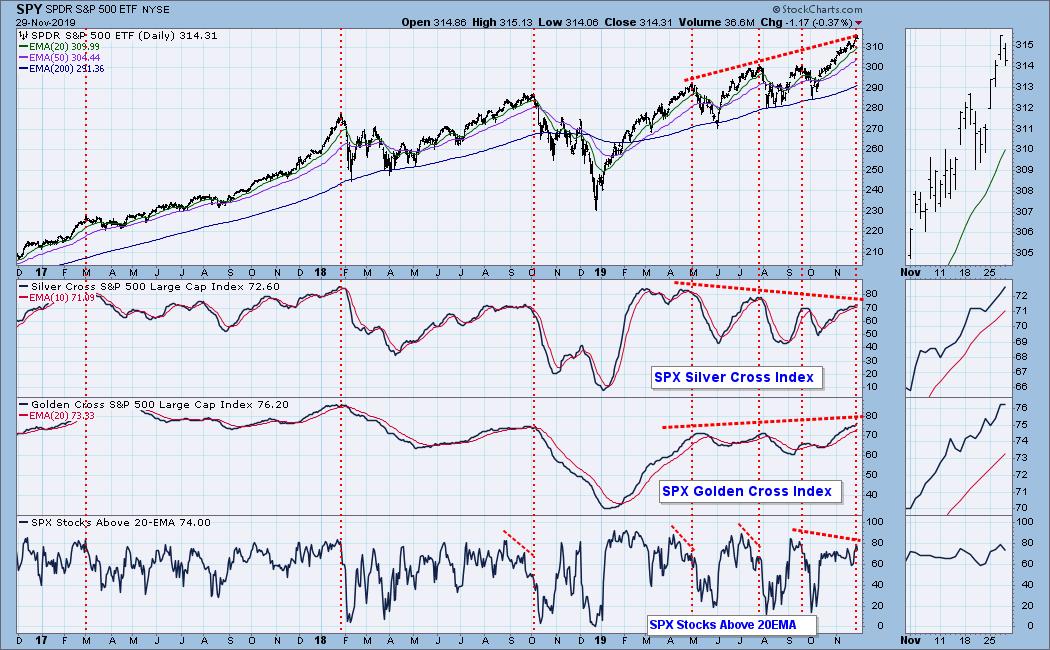
SPY Weekly Chart: The rally from the October low has been quite steep, so steep that I am beginning to compare it to the parabolic advance into the early-2018 top.
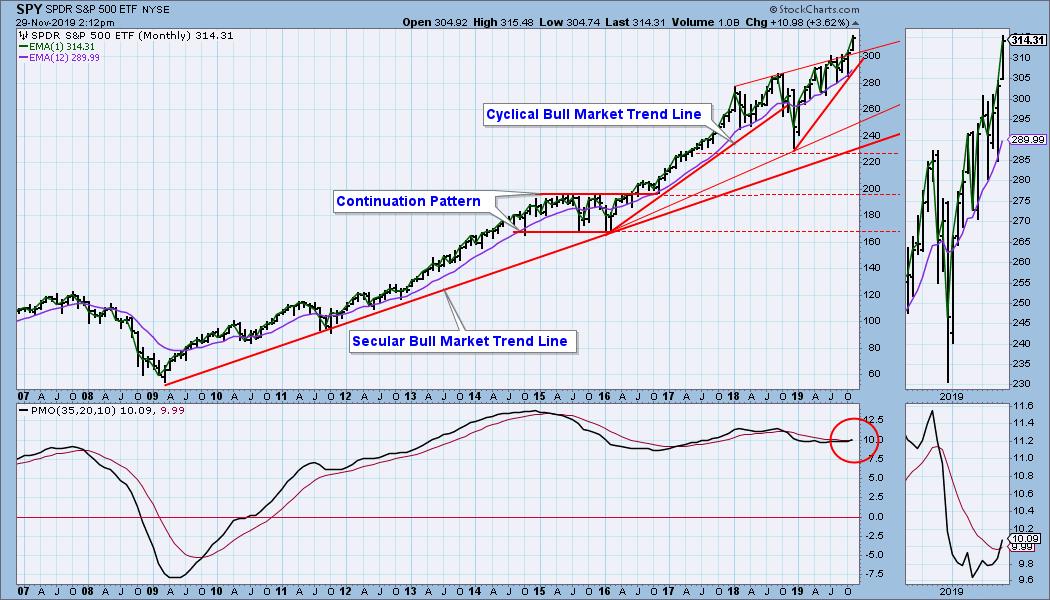
SPY Monthly Chart: The monthly PMO has been relatively flat for nearly four years, notwithstanding the glorious detail shown in the thumbnail panel. Flat may seem boring, but note that it has been flat at about +10. That's very bullish.
Climactic Market Indicators: In spite of Tuesday's volume spike, I don't think the overall climax threshold was reached this week.
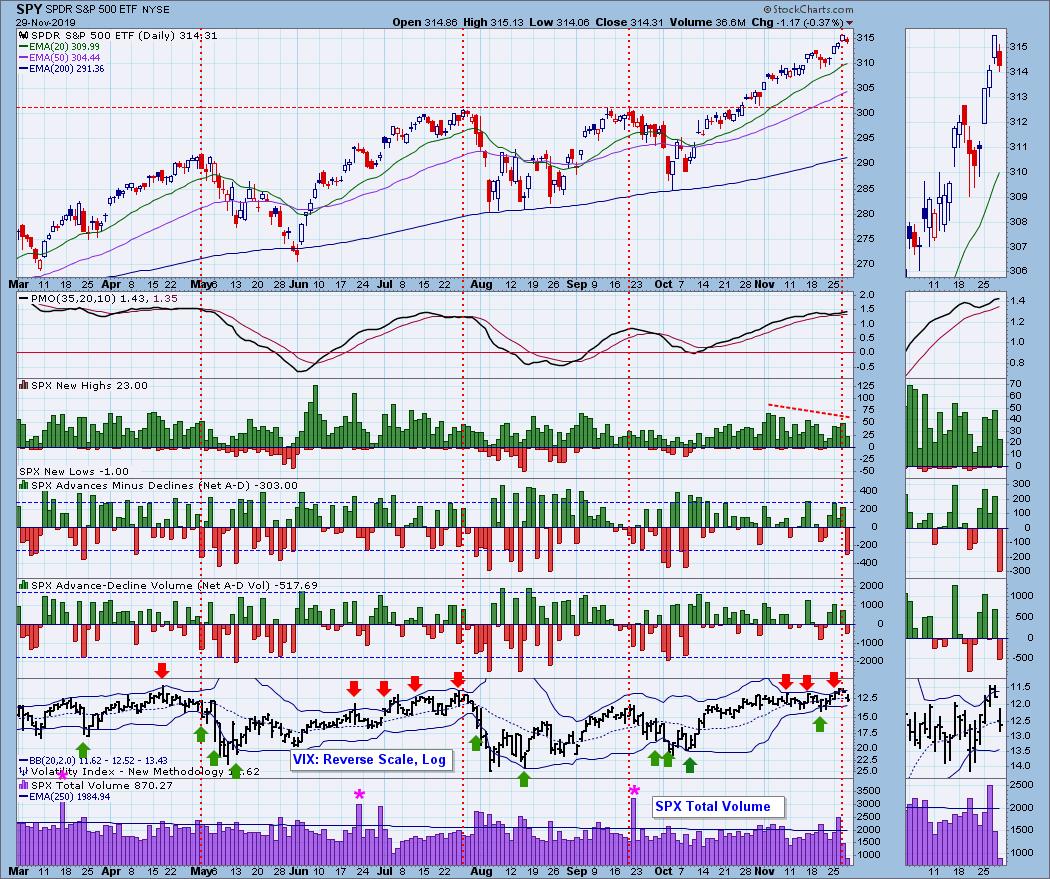
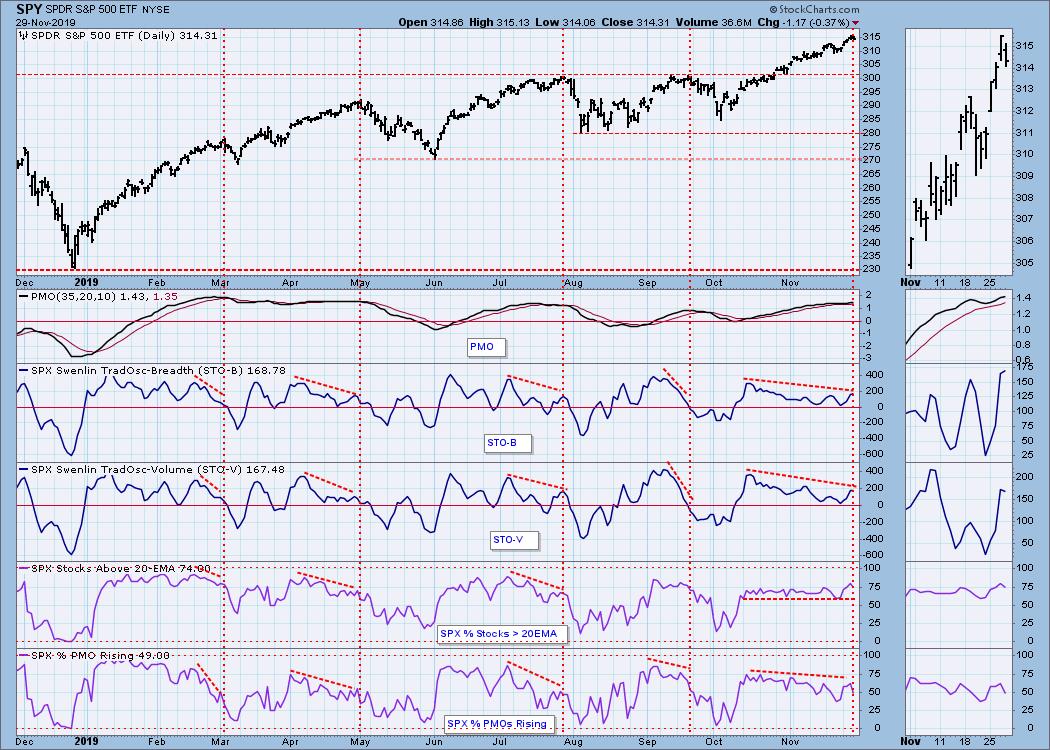
Short-Term Market Indicators: There are some negative divergences over the last seven weeks, but they are not as severe as we saw in July.
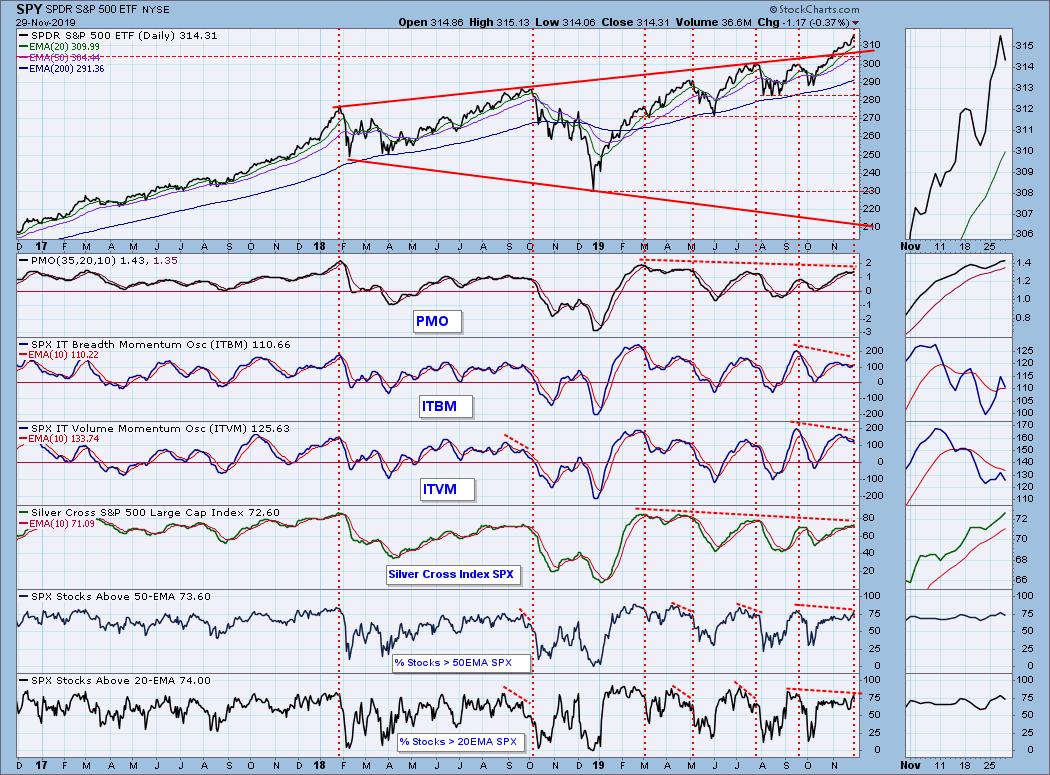
Intermediate-Term Market Indicators: While the Silver Cross Index (percent SPX stocks with 20EMA higher than 50EMA) has been making progressively lower tops since May, 70% is more than adequate participation to support the new price highs. The Golden Cross Index (SPX stocks with 50EMA higher than 200EMA) is at its highest level this year.
Negative divergences abound.
CONCLUSION: The trend is up, but the market condition is somewhat overbought and showing some negative divergences. Seasonality is positive, and the Santa Claus rally is in full swing. I do not care for the market action we have seen since the October low, particularly the generally low SPX Total Volume seen in the last three weeks. Yeah, the market has been going up, and that's great, but it does not even try for healthy pullbacks. This will be great for the bulls for as long as it lasts, but the piper will be paid eventually. I can't know when this will end, but I'm thinking toward the end of December or early-January. Sooner is not out of the question.
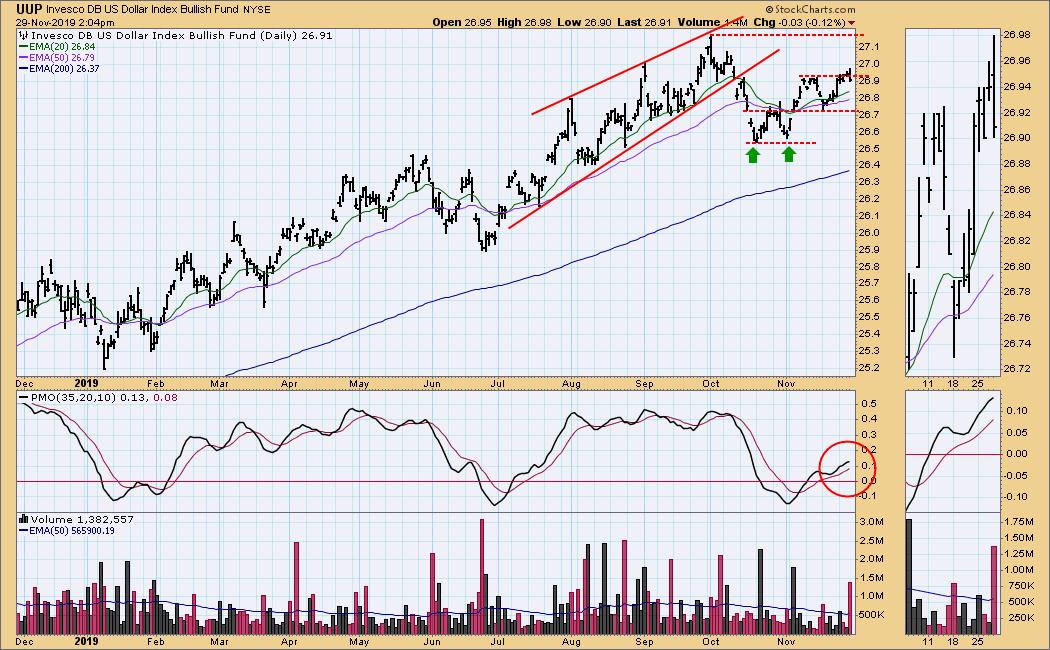
DOLLAR (UUP)
IT Trend Model: BUY as of 11/7/2019
LT Trend Model: BUY as of 5/25/2018
UUP Daily Chart: This week's breakout attempt has failed so far.
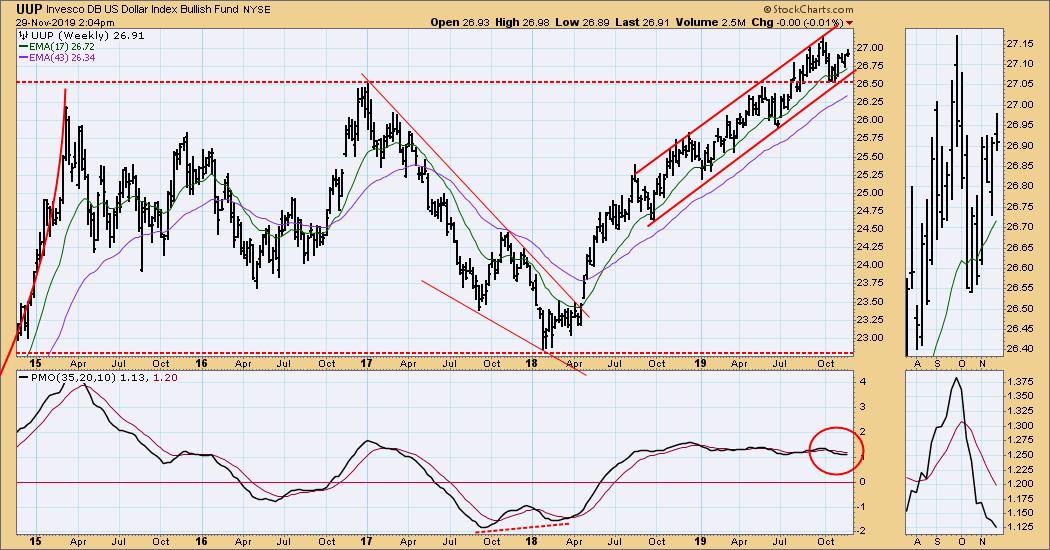
UUP Weekly Chart: After breakout above long-term resistance, there was technical pullback testing the new support, which held.
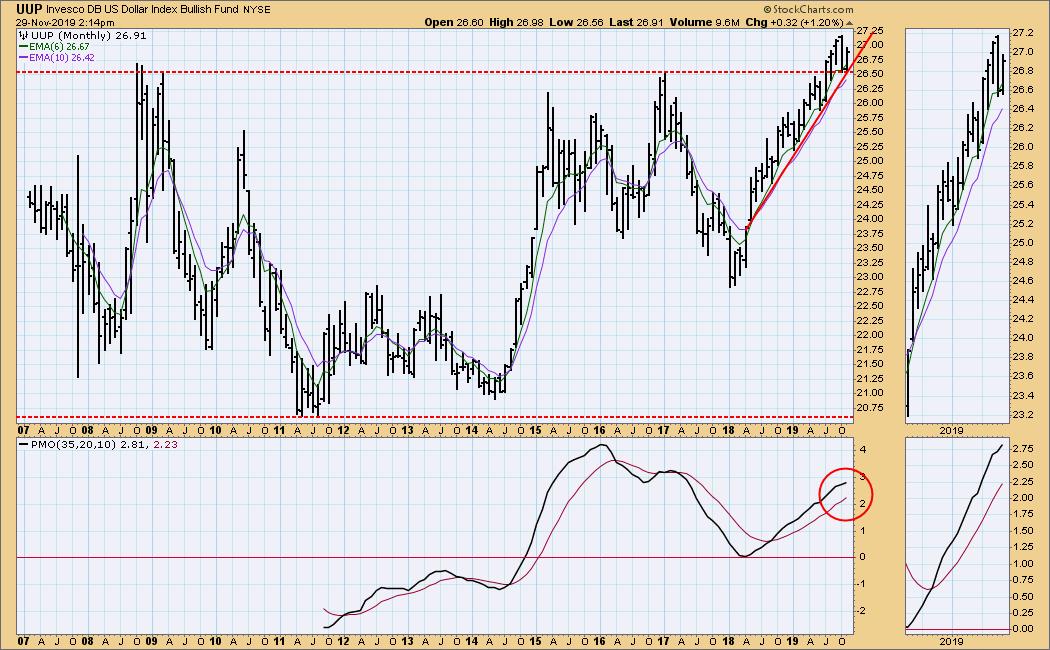
UUP Monthly Chart: In this time frame we can see that the horizontal support line goes back 10 years.
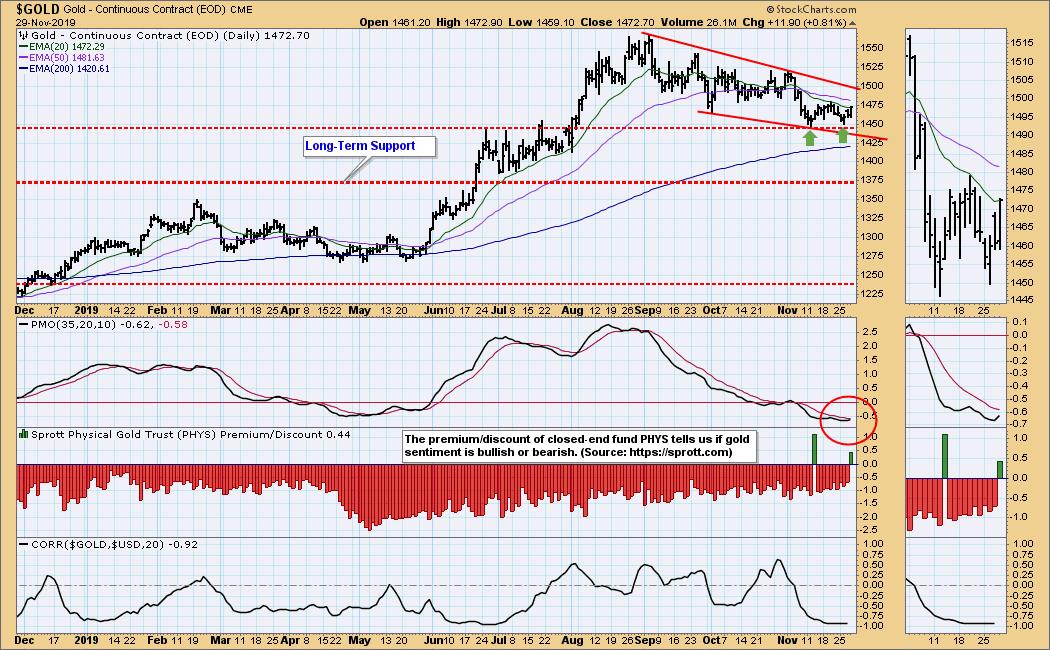
GOLD
IT Trend Model: NEUTRAL as of 11/8/2019
LT Trend Model: BUY as of 1/8/2019
GOLD Daily Chart: This week gold formed a double bottom, and the daily PMO turned up. This is bullish for this time frame. Another good sign is that PHYS traded at a premium on Friday, which implies that sentiment may finally be turning bullish.
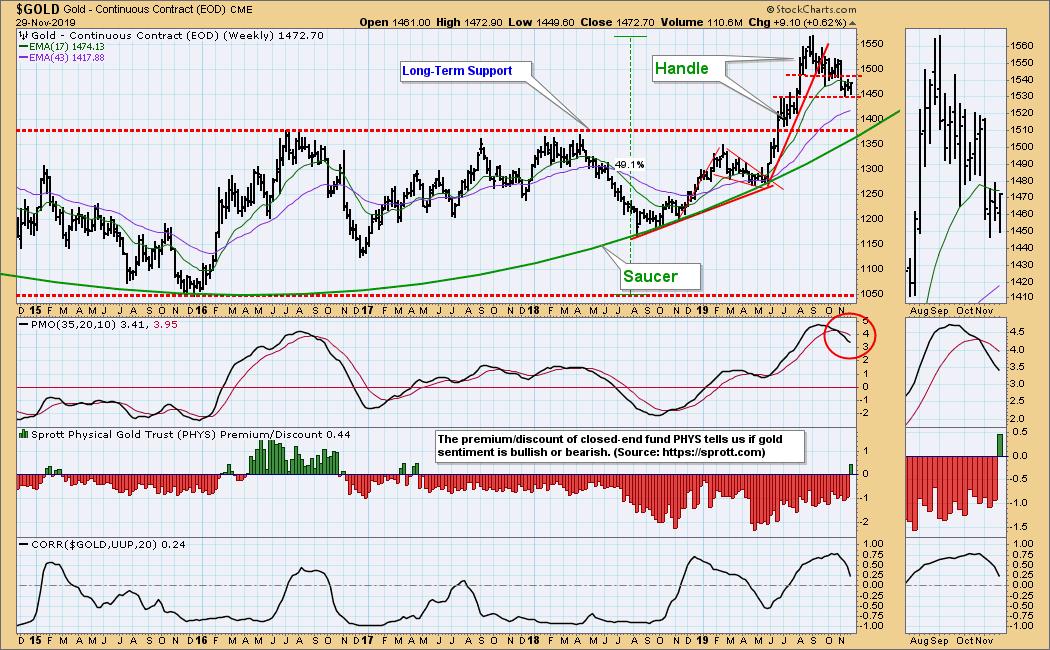
GOLD Weekly Chart: The bullish saucer with handle continues to develop.
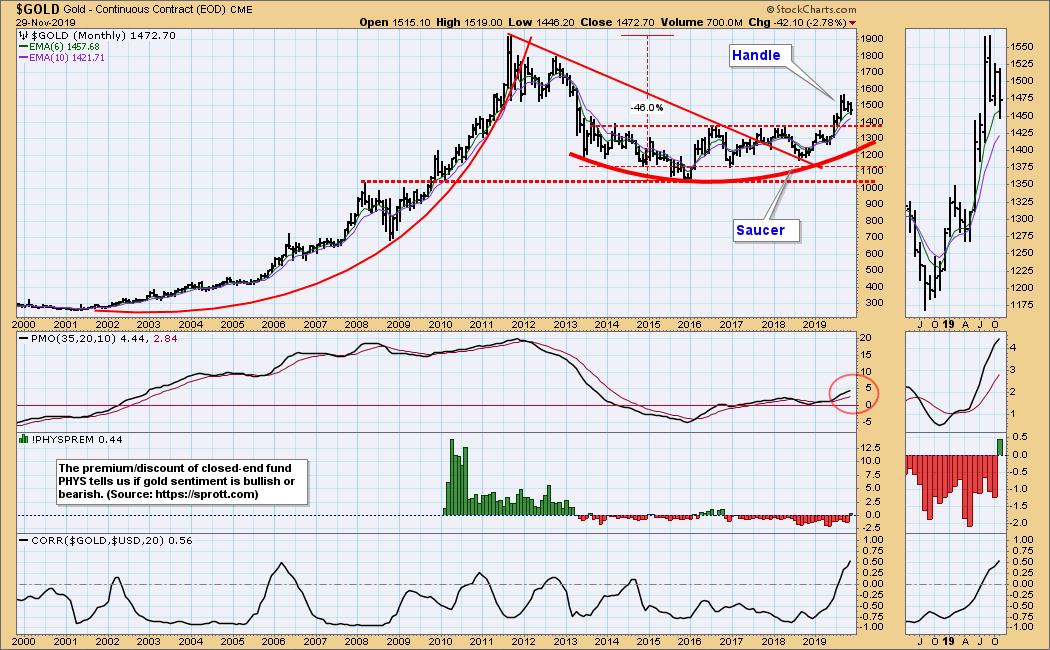
GOLD Monthly Chart: Note that the handle is gold's rally above long-term resistance at 1375. This chart looks very bullish, but gold must remain above 1375.
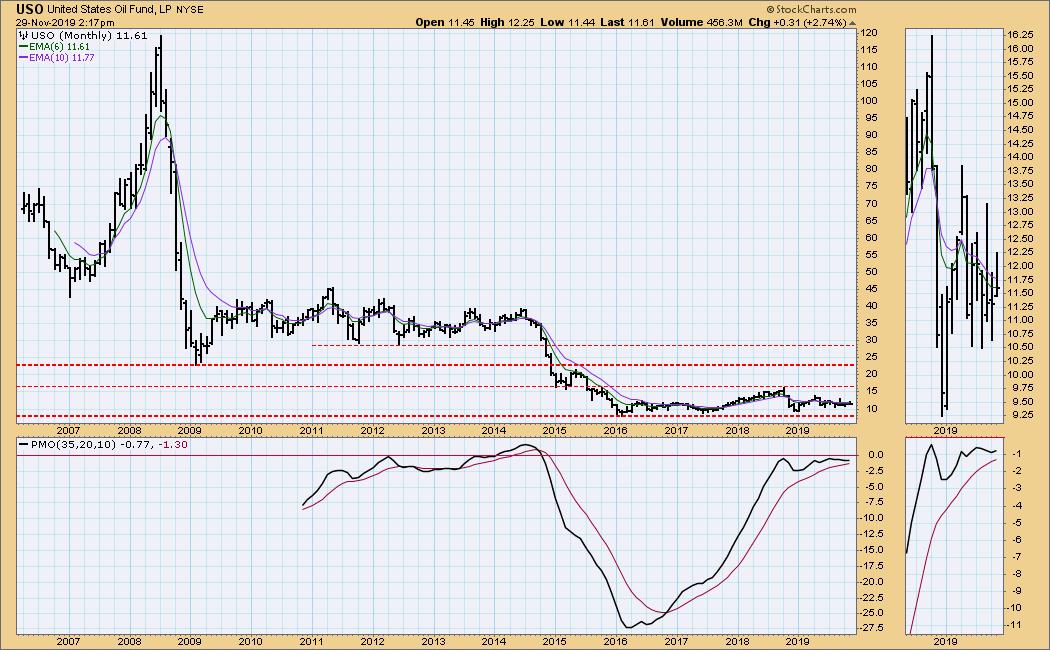
CRUDE OIL (USO)
IT Trend Model: BUY as of 11/22/2019
LT Trend Model: SELL as of 6/4/2019
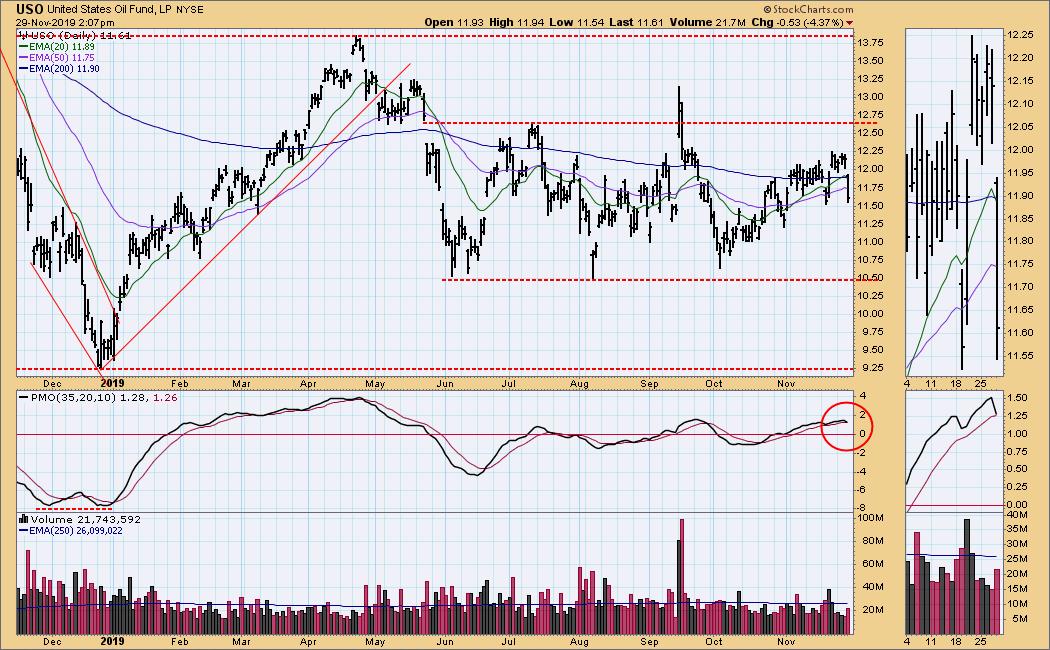
USO Daily Chart: The rally from the October low has failed to reach the top of the trading range, and today's decline would seem to have started a pullback.
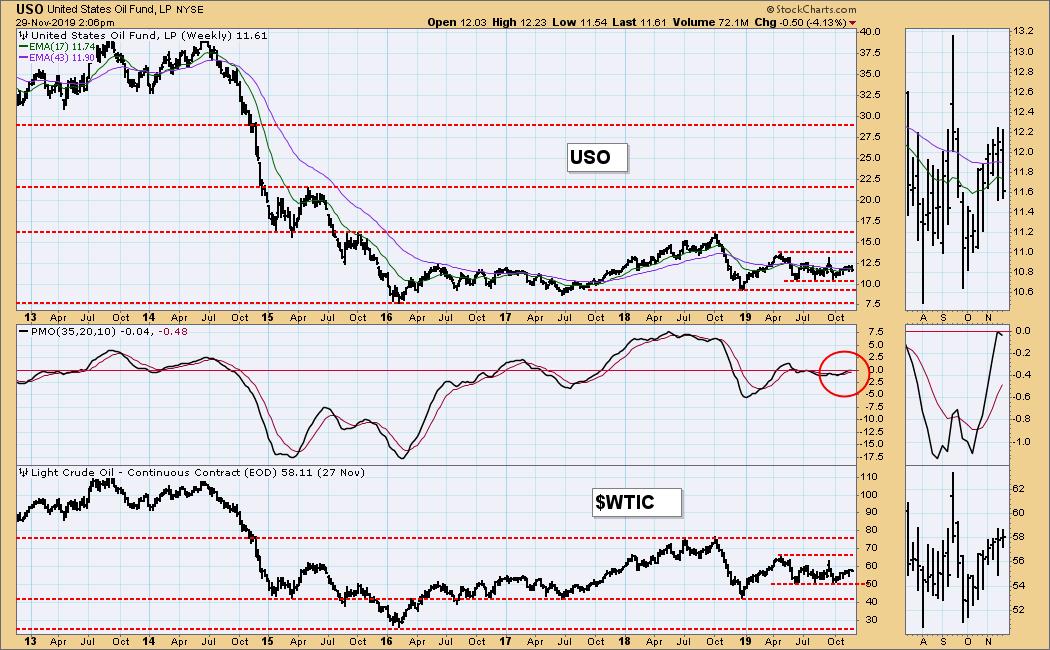
USO Weekly Chart: Note that the weekly PMO has been running flat and at zero since about June. This confirms that there is no internal force pushing USO anywhere.
USO Monthly Chart: USO is range bound and in a basing pattern. This could last quite a while, years even.
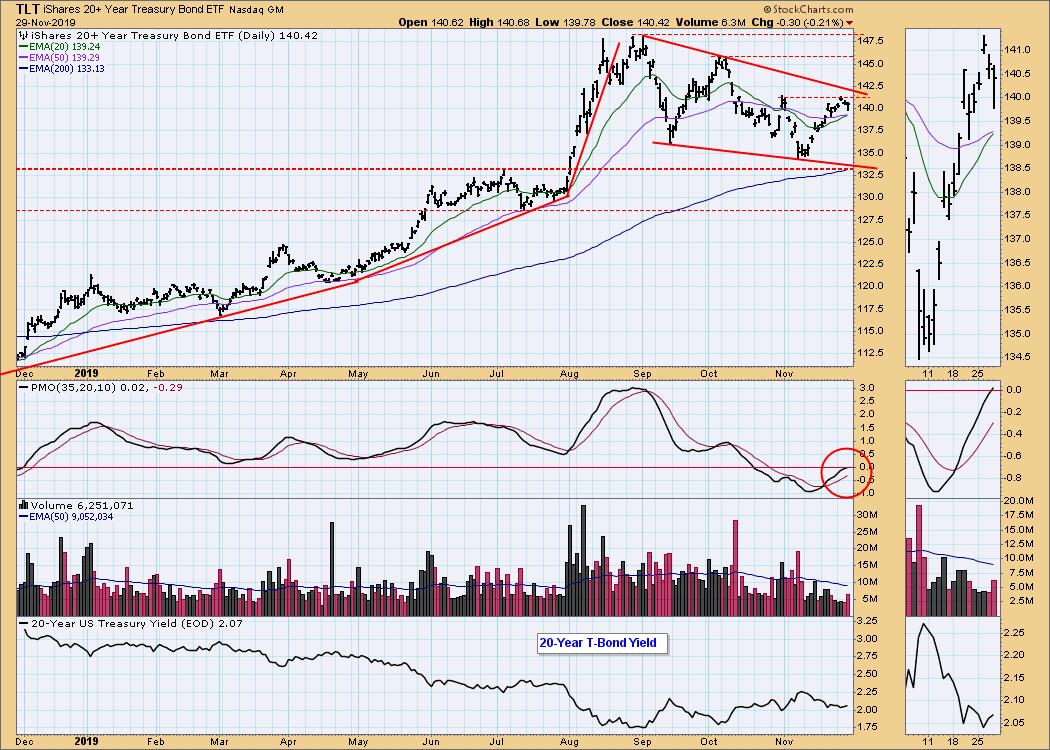
BONDS (TLT)
IT Trend Model: NEUTRAL as of 10/28/2019
LT Trend Model: BUY as of 1/2/2019
TLT Daily Chart: I think the September high and the November low define the range for TLT until something happens -- compelling news or Fed rate change.
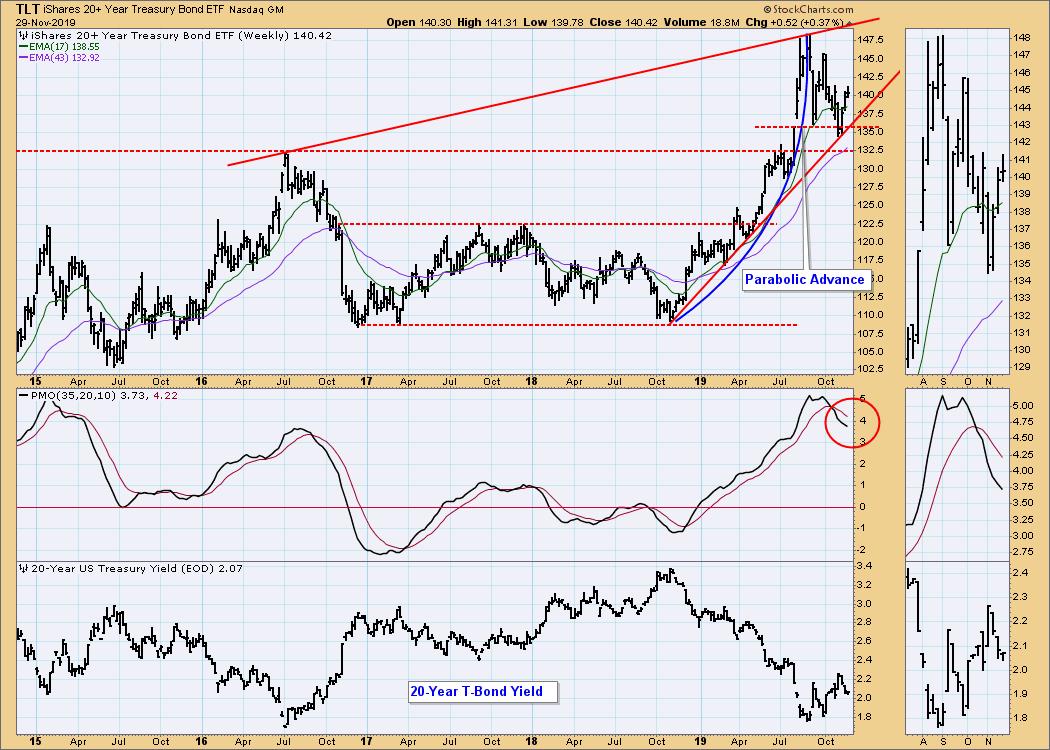
TLT Weekly Chart: The parabolic advance broke, and price moved back to the rising trend line.
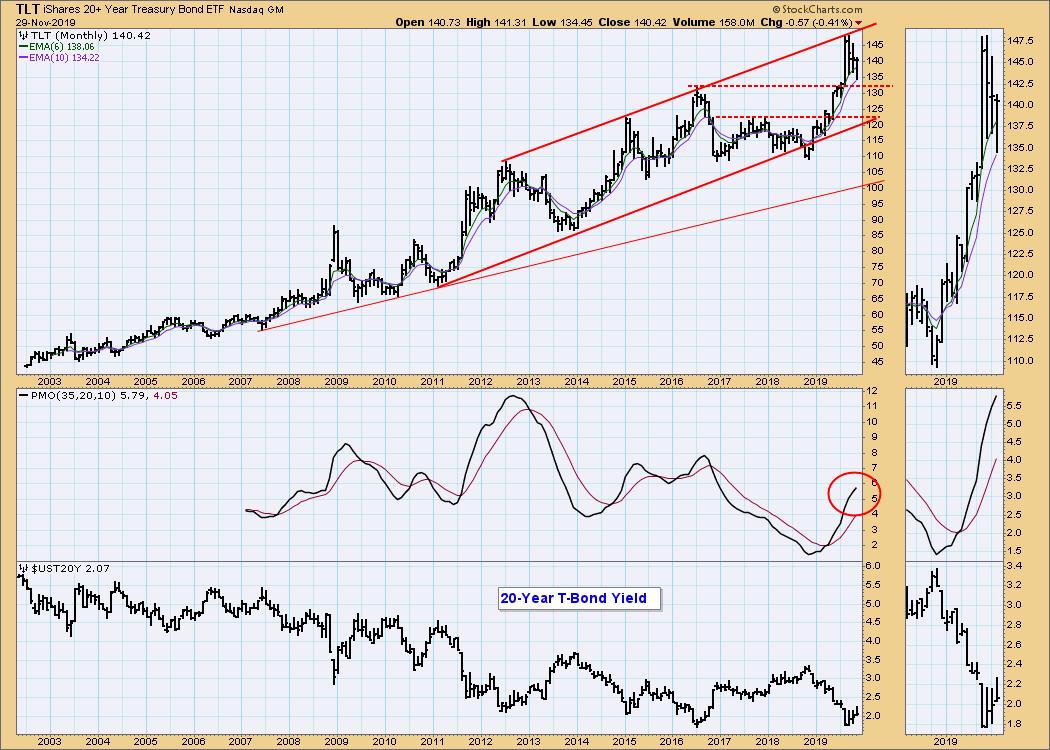
TLT Monthly Chart: Price is moving down from the top of a rising trend channel, and the implication is that TLT will be under pressure for a while, but the long-term picture is bullish.
**Don't miss any of the DecisionPoint commentaries! Go to the "Notify Me" box toward the end of this blog page to be notified as soon as they are published.**
Technical Analysis is a windsock, not a crystal ball.
Happy Charting! - Carl
NOTE: The signal status reported herein is based upon mechanical trading model signals, specifically, the DecisionPoint Trend Model. They define the implied bias of the price index based upon moving average relationships, but they do not necessarily call for a specific action. They are information flags that should prompt chart review. Further, they do not call for continuous buying or selling during the life of the signal. For example, a BUY signal will probably (but not necessarily) return the best results if action is taken soon after the signal is generated. Additional opportunities for buying may be found as price zigzags higher, but the trader must look for optimum entry points. Conversely, exit points to preserve gains (or minimize losses) may be evident before the model mechanically closes the signal.
Helpful DecisionPoint Links:
DecisionPoint Shared ChartList and DecisionPoint Chart Gallery
Price Momentum Oscillator (PMO)
Swenlin Trading Oscillators (STO-B and STO-V)


