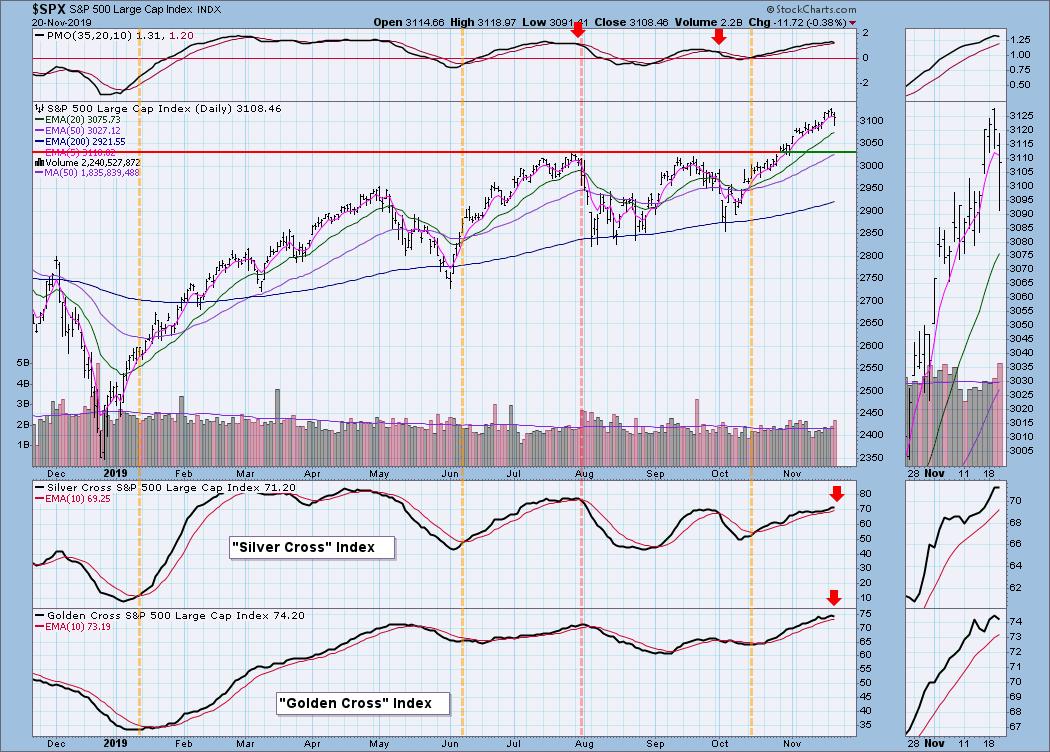
 Last Monday (11/18/19) on the DecisionPoint show, Carl and I introduced the Golden Cross and Silver Cross Indexes ChartList! You can get it too by downloading the free "DP Market Indicators" ChartPack. If you have previously downloaded the ChartPack, just re-install it; the new Golden Cross and Silver Cross Index ChartList should now appear. Below is the Golden Cross Index (GCI) and Silver Cross Index (SCI) for the SPX. We also have these indexes for the other major indices and all of the S&P Sectors. The Golden Cross Index tells us the percentage of stocks in that index or sector on a LT Trend Model BUY signal (the 50-EMA > 200-EMA). The Silver Cross Index measures the percentage of stocks in that sector or index that are on IT Trend Model BUY signals (20-EMA > 50-EMA). Today, both indexes on the SPX turned down. We saw this happen a little over a week ago and it didn't amount to much. Unfortunately, it's possible we're looking at a selling initiation in the works, so this could be indicating a correction is on the way.
The DecisionPoint Alert presents a mid-week assessment of the trend and condition of the stock market (S&P 500), the U.S. Dollar, Gold, Crude Oil and Bonds.
Watch the latest episode of DecisionPoint on StockCharts TV's YouTube channel here!
GLOBAL MARKETS
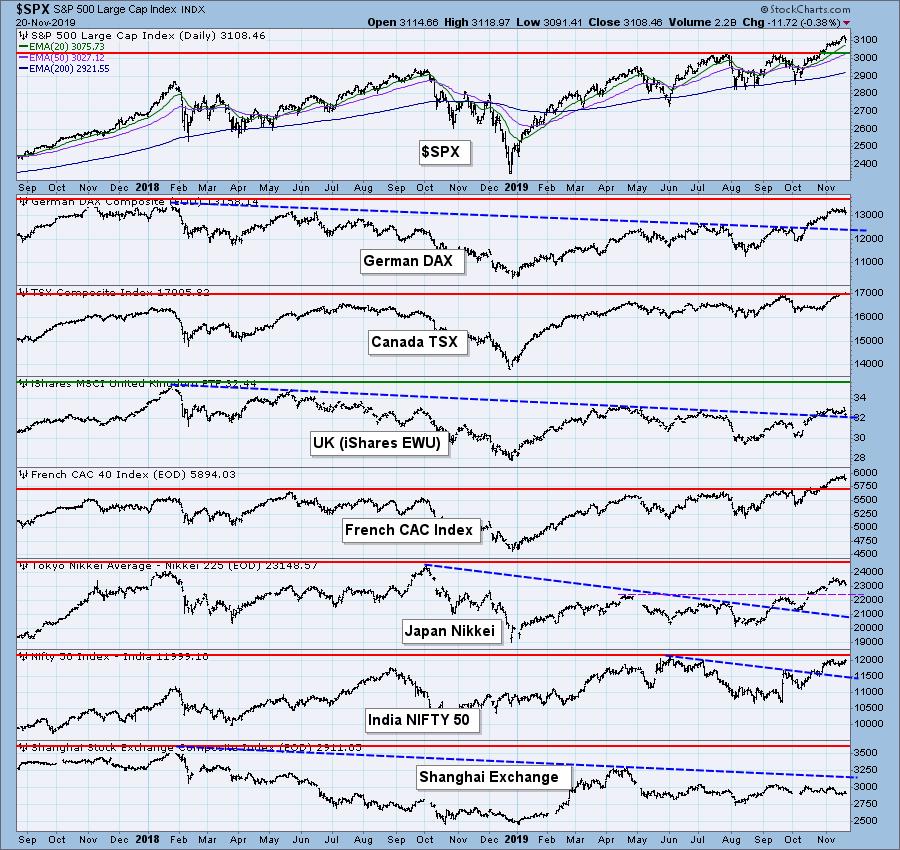
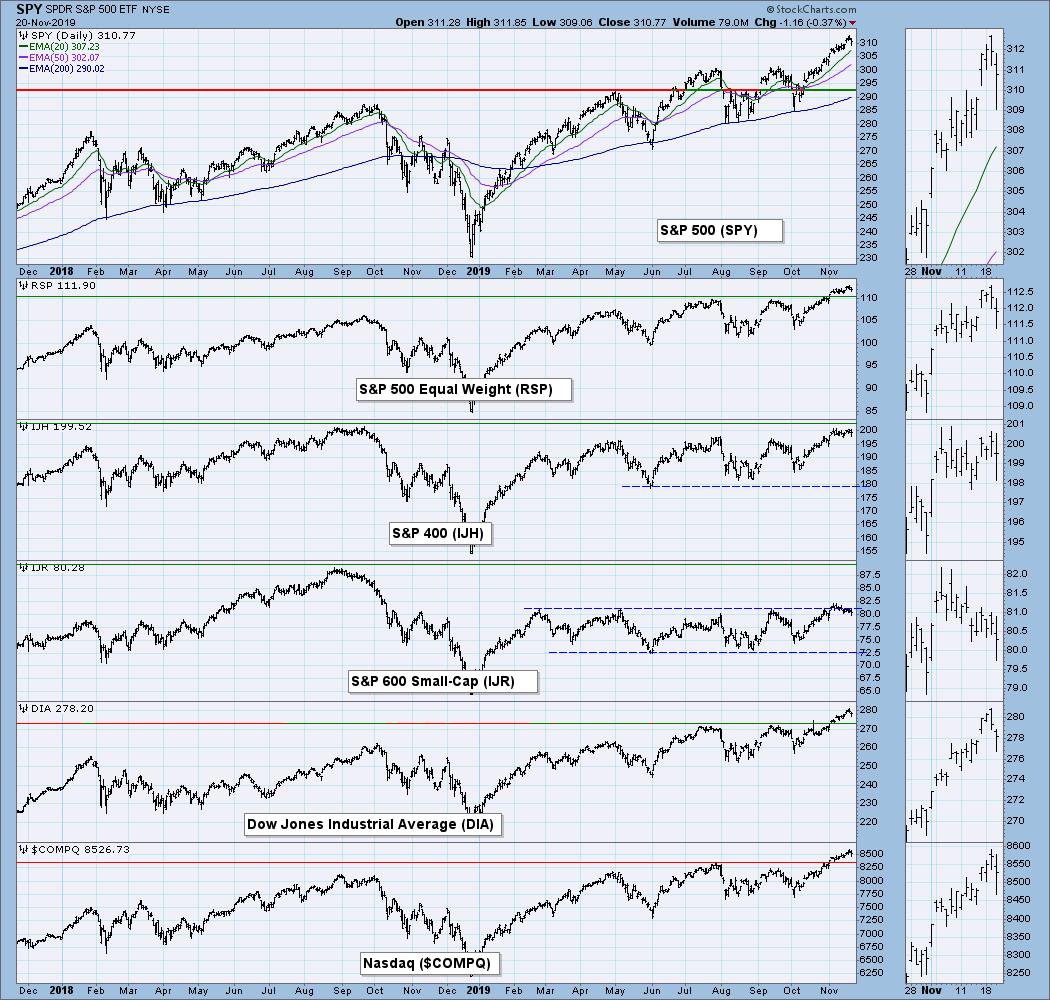
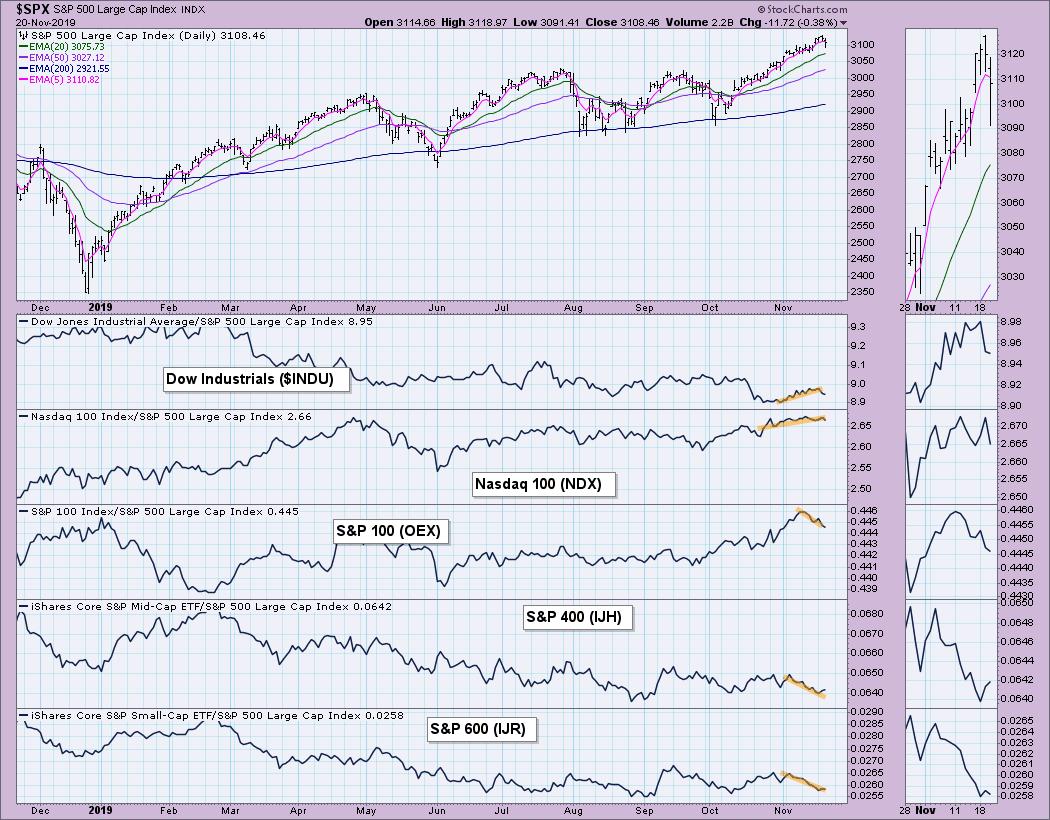
BROAD MARKET INDEXES
MARKET INDEXES PRICE RELATIVE TO SPX
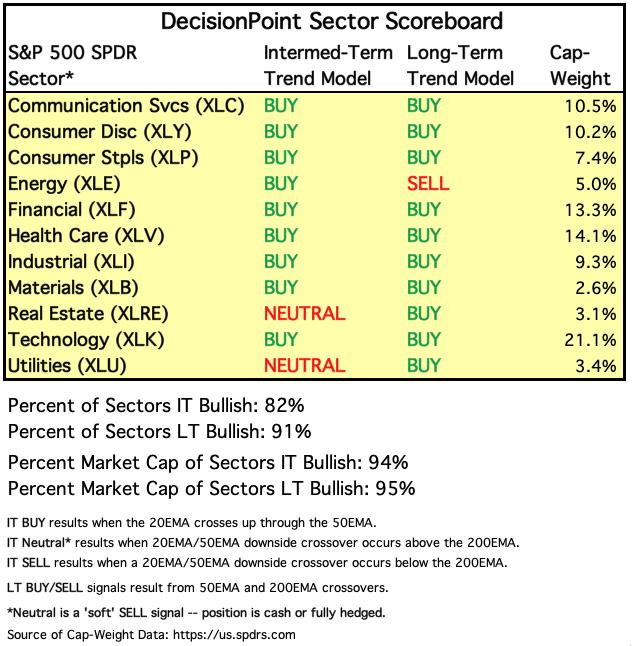
SECTORS
Each S&P 500 Index component stock is assigned to one, and only one, of eleven major sectors. This is a snapshot of the Intermediate-Term and Long-Term Trend Model signal status for those sectors.
STOCKS
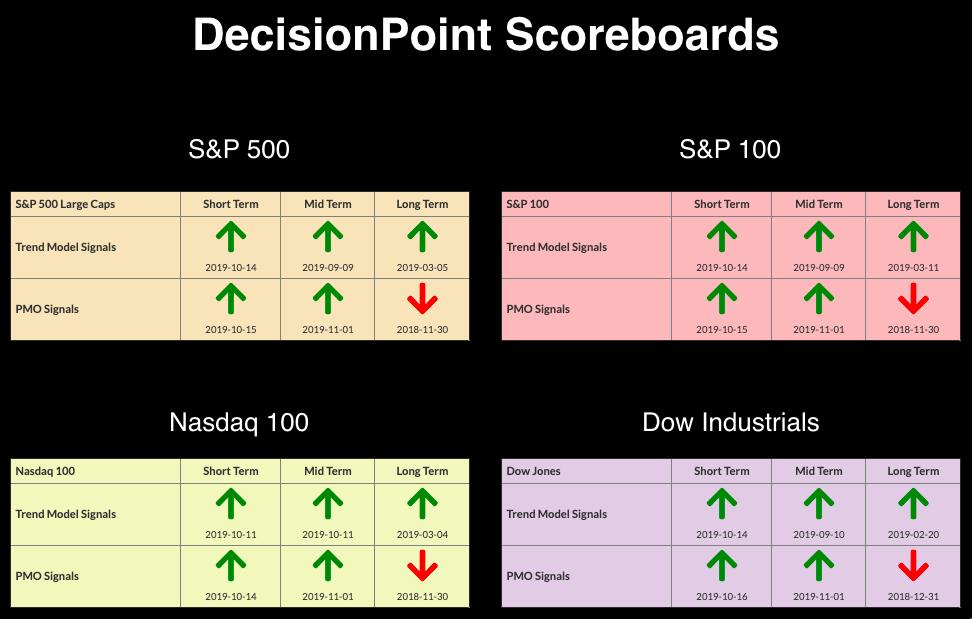
IT Trend Model: BUY as of 9/4/2019
LT Trend Model: BUY (SPY) as of 2/26/2019
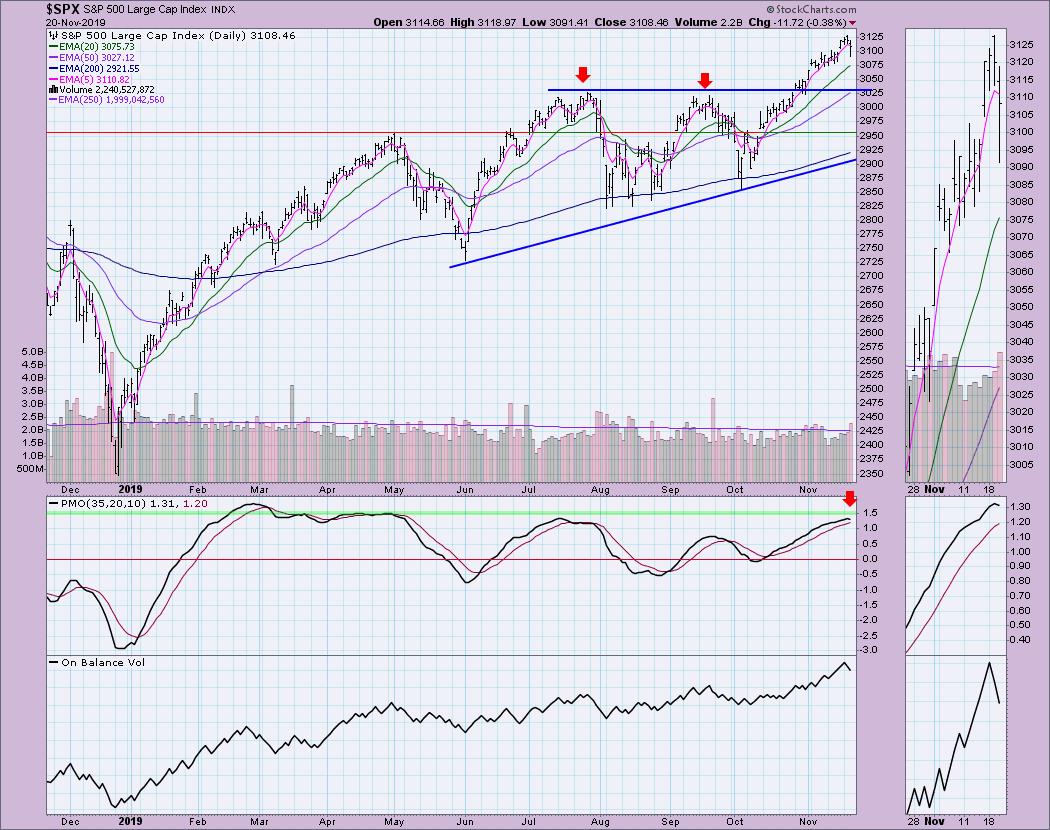
SPX Daily Chart: Price dropped deeply today, but managed to close in the top half of today's OHLC bar. The PMO has actually turned down. Not decelerated, turned down. We haven't seen this since the October/November rallies got started. The gap from last Friday was closed and it smells like an island reversal that could see a continuation. Notice that this decline today happened on very high volume.
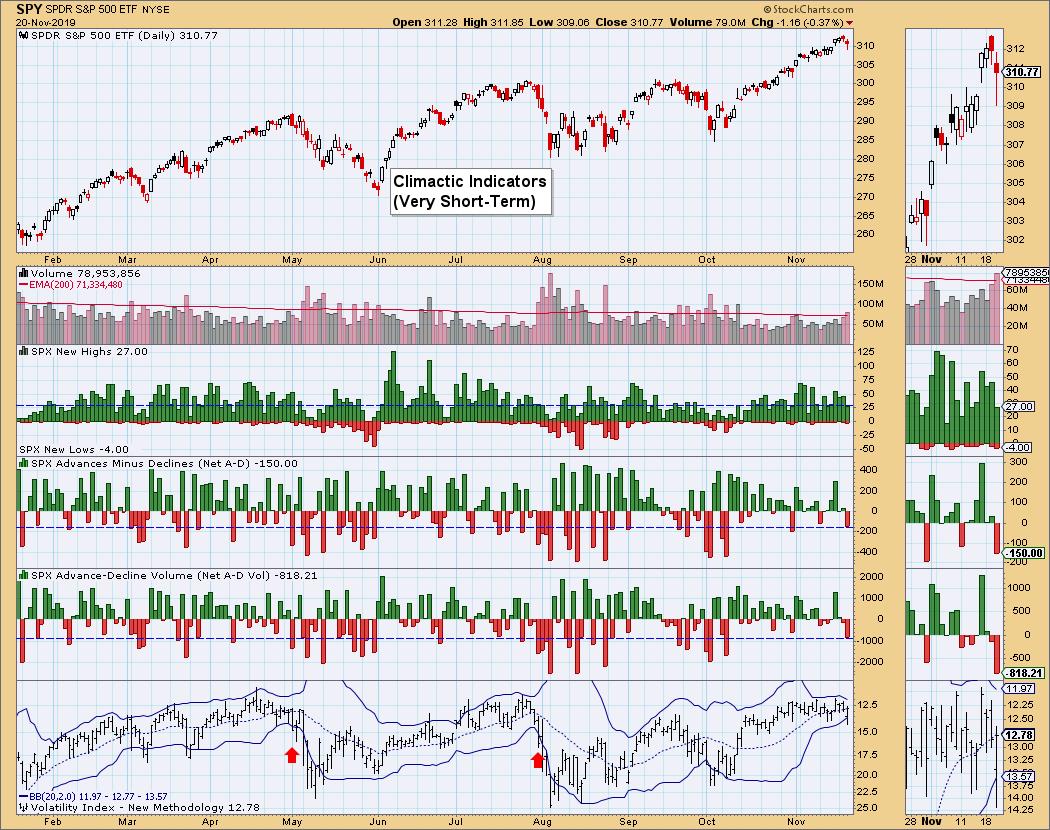
Climactic Market Indicators: Besides seeing heavy volume on this decline and a PMO that has turned down, the VIX spiked. Normally, when I notice the bottom Bollinger Band on my inverse scale of the VIX penetrated, we usually see a rebound. However, I have to admit that the breadth numbers aren't particularly climactic. Notice where I have pointed to previous moves out of a "squeezed" Bollinger Band. This could be the beginning of a similar selling initiation. I don't see today's penetration of the bottom Band as bullish.
Short-Term Market Indicators: Although the STO-B broke a declining trend, it has topped again along with the STO-V. We aren't seeing major deterioration as far as stocks above their 20-EMAs, but the percentage of stocks with rising PMOs is definitely dropping, which indicates failing momentum on 55% of the stocks in the SPX. This is not what you want to see when you are trying to make new all-time highs.
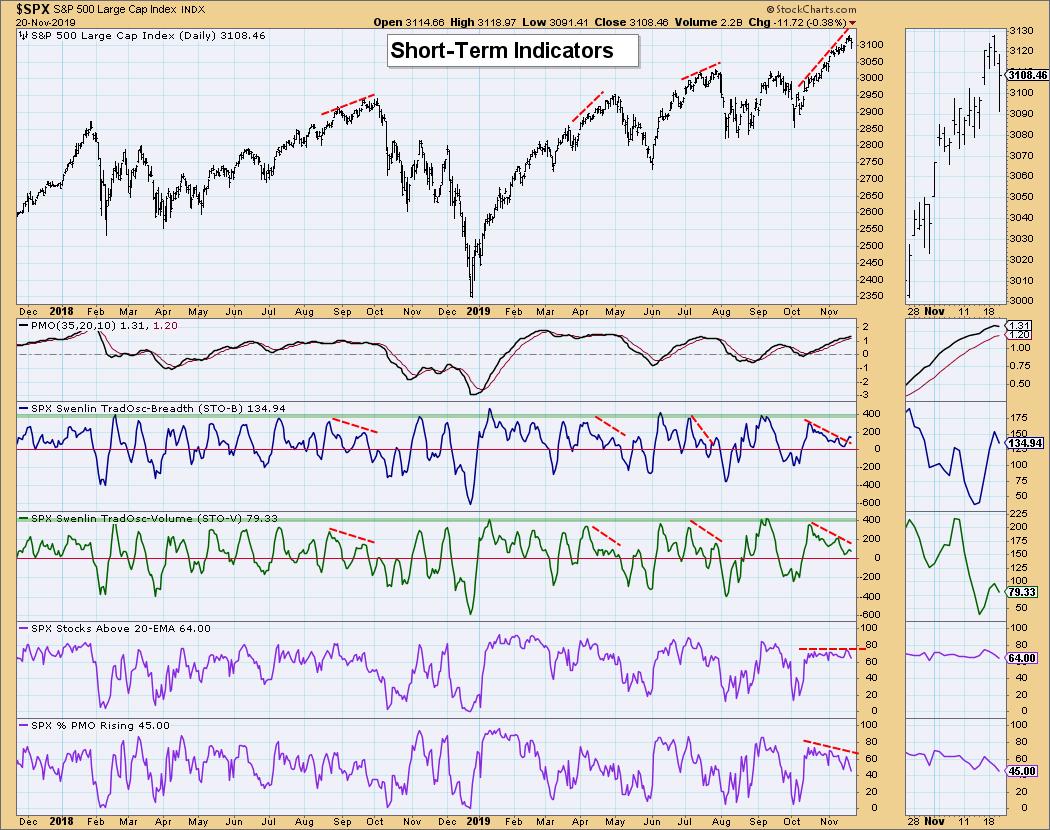
Intermediate-Term Market Indicators: We now have negative crossovers on both the ITBM and ITVM, which is also a problem when you are trying to rally to all-time highs. The negative divergences are stark.
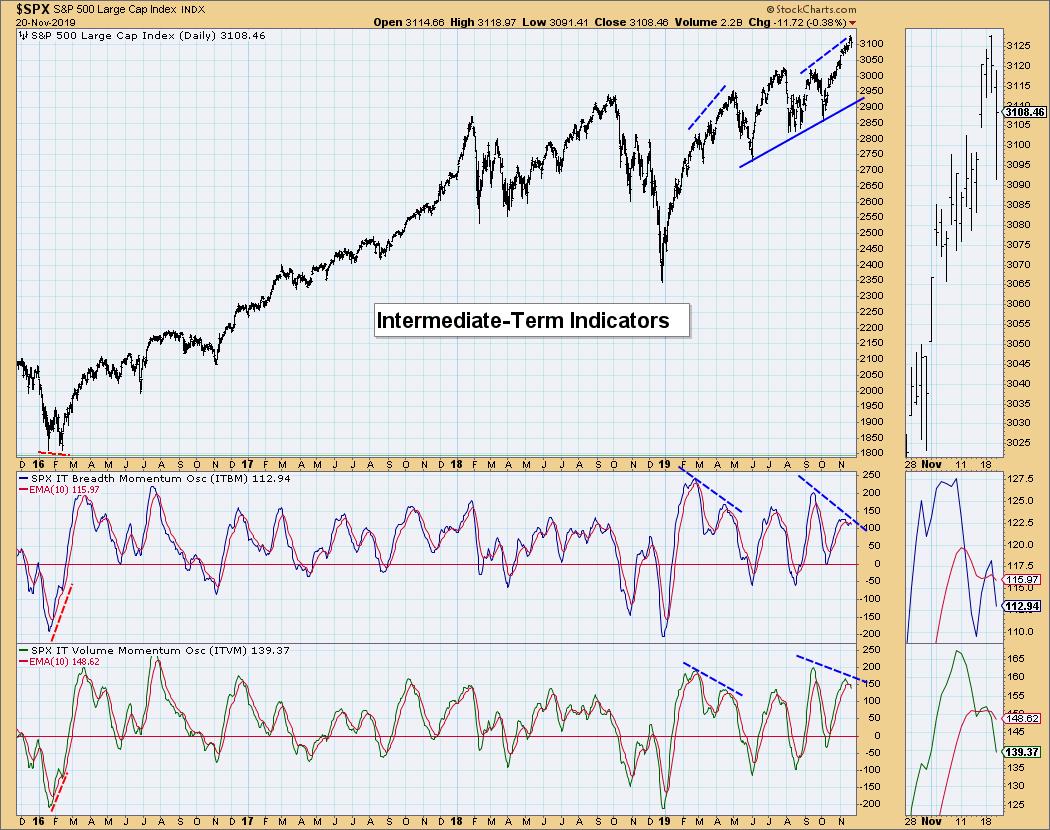
Conclusion: I was very concerned when I saw today's charts. This doesn't feel like a "toppy" market; this has the earmarks of a serious pullback or correction. As I have written in my DP Daily Diamonds report, I am happily 80% cash.
DOLLAR (UUP)
IT Trend Model: Neutral as of 10/31/2019
LT Trend Model: BUY as of 5/25/2018
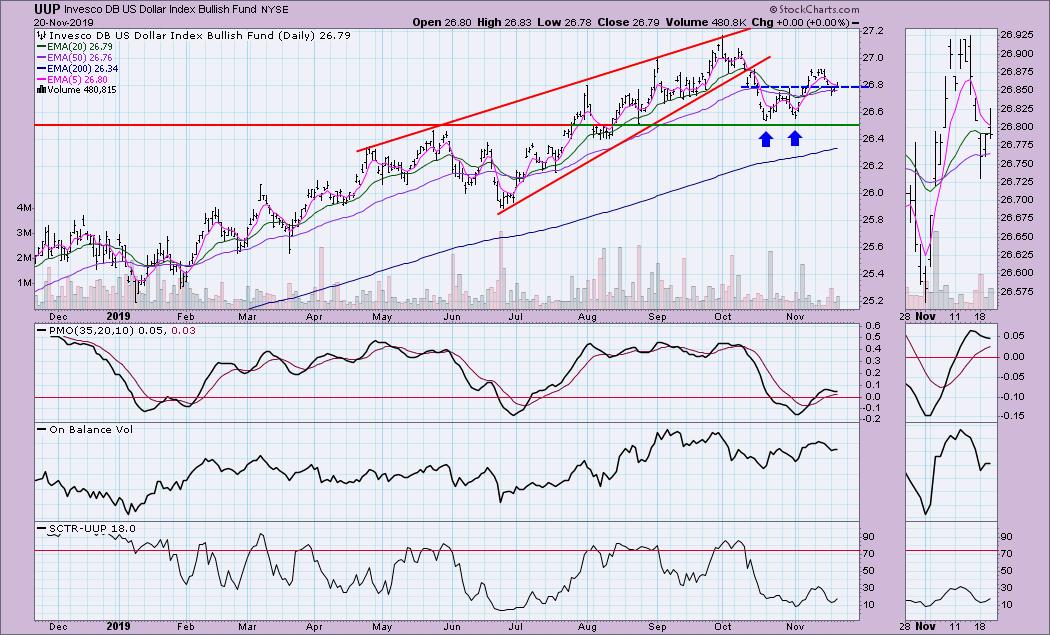
UUP Daily Chart: I bought UUP last week and it certainly hasn't done much. The double-bottom pattern never really turned into much the PMO is now moving lower. I am still looking for a rising Dollar and plan to stay in for now. Although the PMO topped, it is decelerating and the SCTR is turning up. My stop is loose.
GOLD
IT Trend Model: BUY as of 6/3/2019
LT Trend Model: BUY as of 1/8/2019
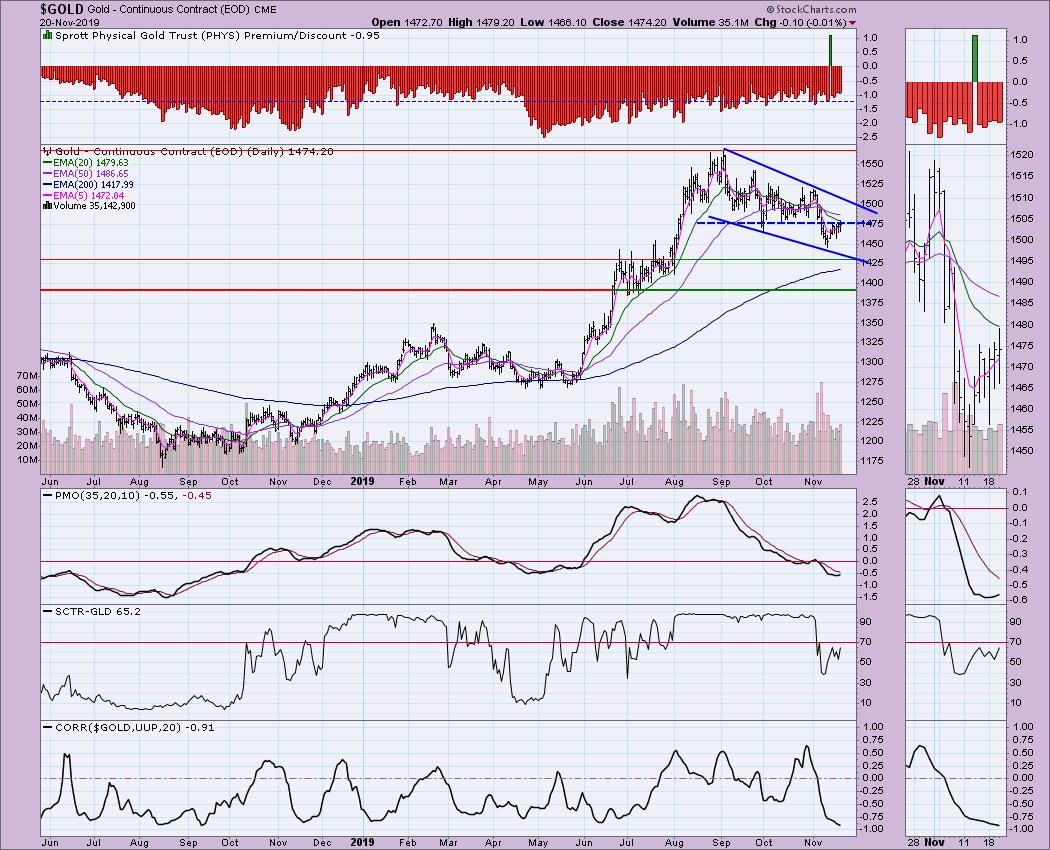
GOLD Daily Chart: Gold looks like it is ready to rally, but I would like to see a solid breakout above $1480 or the 20-EMA. You could make a case for a descending wedge, but, until I see that short-term breakout, I don't think it is ready to execute. If the Dollar rises, as I suspect it will, the inverse correlation, which is very strong right now, would bring Gold lower.
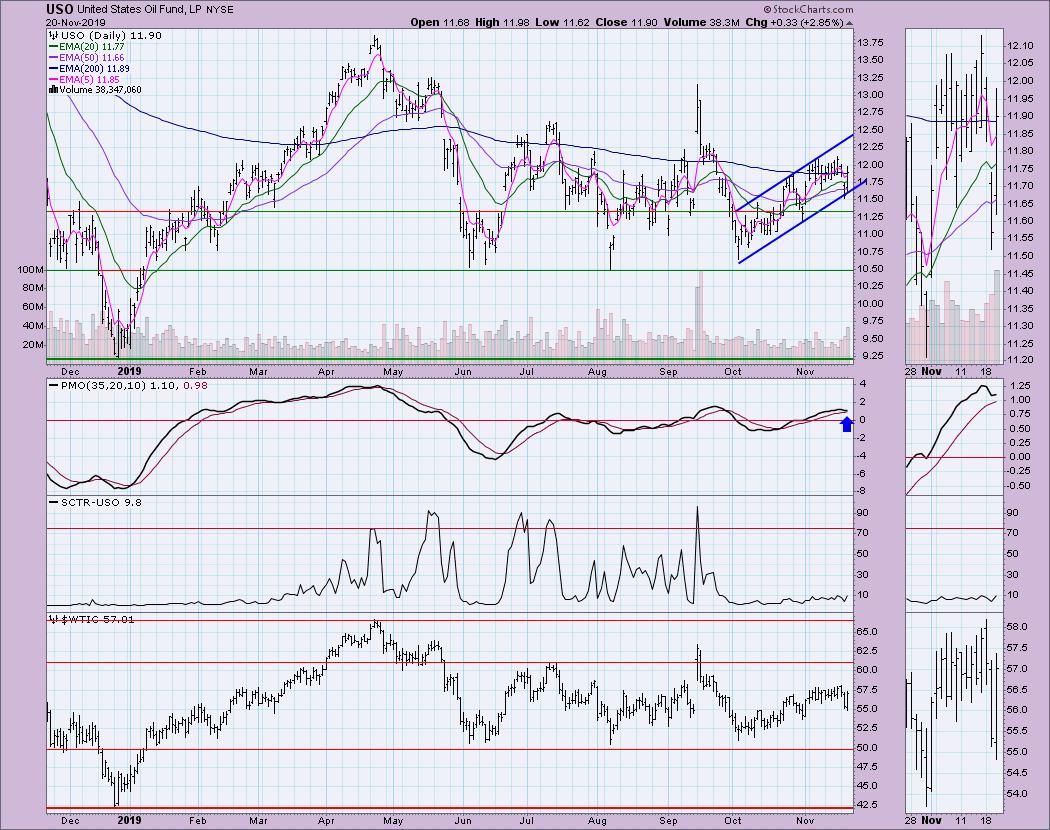
CRUDE OIL (USO)
IT Trend Model: SELL as of 10/2/2019
LT Trend Model: SELL as of 6/4/2019
USO Daily Chart: I still think USO is in a rising trend channel. Yesterday it was somewhat compromised, but ultimately it still closed within. Today we saw a rally to bring price back to the middle of the trend channel and above the 200-EMA. The PMO has bottomed above the signal line and it isn't overbought, so it can move higher.
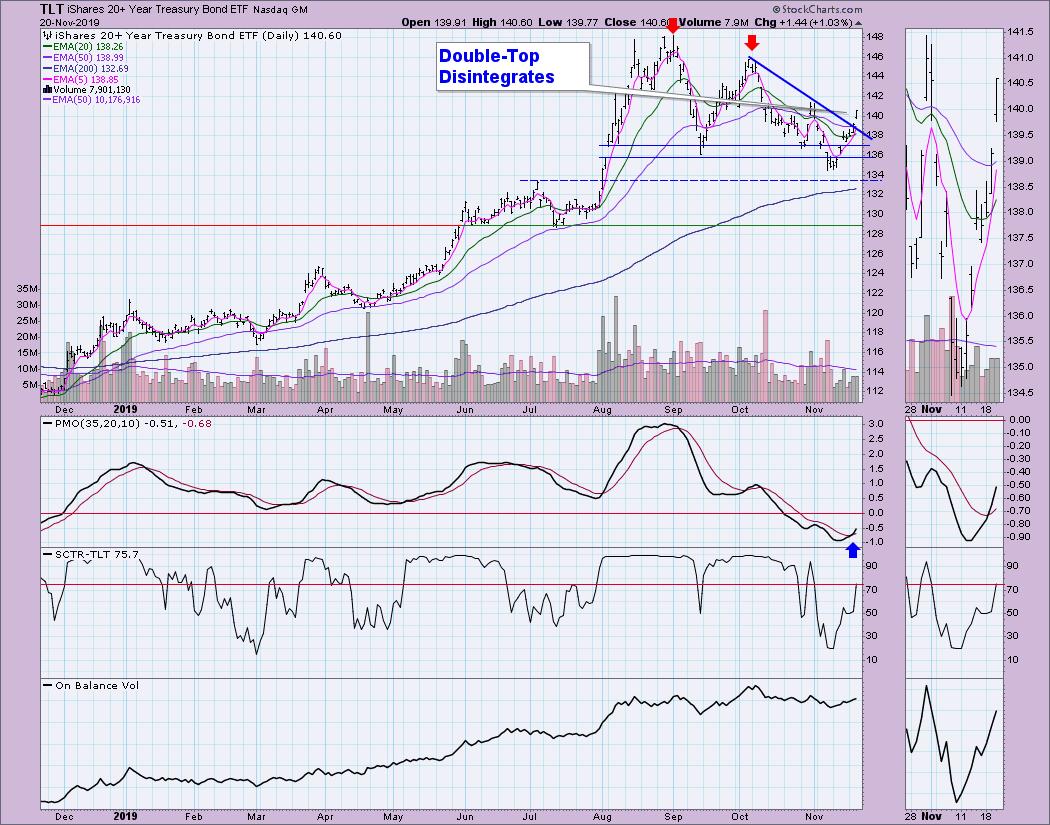
BONDS (TLT)
IT Trend Model: BUY as of 12/6/2018
LT Trend Model: BUY as of 1/2/2019
TLT Daily Chart: I was giving the double-top a little leeway, but now that we have the gap up above the declining tops trend line, I would say it is null and void. The PMO gave us a BUY signal today and the 5-EMA crossed above the 20-EMA, which triggered an ST Trend Model BUY signal. I have also seen bond funds and ETFs peppering my Diamond Scan and other bullish scans. I'm looking for a continuation of this rally.
Technical Analysis is a windsock, not a crystal ball.
Happy Charting! - Erin
Email: erinh@stockcharts.com
Special Announcement!
I will be presenting at the "Market Vision 2020" online conference on January 4th! It is sponsored by EarningsBeats.com and promises to be "THE" event to start the new year. We will have many of the commentators that you love presenting their "market view" for 2020, with John Murphy as the keynote speaker! For information on the event, sign up for the free emails that will give you all the details as we get closer!

Erin Swenlin will be presenting at the The MoneyShow Las Vegas May 11-13, 2020! You'll have an opportunity to meet Erin and discuss the latest DecisionPoint news and Diamond Scans. The conference is free to attend or view online!
**Don't miss any of the DecisionPoint commentaries! Go to the "Notify Me" box toward the end of this blog page to be notified as soon as they are published.**
NOTE: The signal status reported herein is based upon mechanical trading model signals, specifically the DecisionPoint Trend Model. These define the implied bias of the price index based upon moving average relationships, but they do not necessarily call for a specific action. They are information flags that should prompt chart review. Further, they do not call for continuous buying or selling during the life of the signal. For example, a BUY signal will probably (but not necessarily) return the best results if action is taken soon after the signal is generated. Additional opportunities for buying may be found as price zigzags higher, but the trader must look for optimum entry points. Conversely, exit points to preserve gains (or minimize losses) may be evident before the model mechanically closes the signal.
Helpful DecisionPoint Links:
DecisionPoint Shared ChartList and DecisionPoint Chart Gallery
Price Momentum Oscillator (PMO)
Swenlin Trading Oscillators (STO-B and STO-V)


