 Scan results are beginning to wane on the majority of my bullish scans. If this continues, I will likely unveil some shorting opportunities next week. Today's results include Disney (DIS), which I've been watching since the release of Disney+. I like that chart. I've also ended up with a couple of cannabis stocks. I opted to include Canopy Growth (CGC) but avoided Tilray (TLRY), which can be quite volatile. Since I've been bullish on oil and Phillips 66 (PSXP) arrived on the "Pink Line" Scan, I decided to include it. I know that the market is shaky when scan results are thin and it takes me over an hour to find five good looking stocks. I'm 80% cash and have no plans on changing that.
I love to get your feedback on DP commentary, so shoot me an email at erinh@stockcharts.com. I read every one of them and try to answer them all! Your insight helps me to tailor my commentary to what my readers and viewers want to hear about.
Welcome to DecisionPoint Daily Diamonds, wherein I highlight five "diamonds in the rough." These are selected from the results of my DecisionPoint scans, which search for stocks that could benefit from the trend and condition of the market. Remember, these are not recommendations to buy or sell, but are the most interesting of the stocks that surfaced in my scans. My objective is to save you the work of the initial, tedious culling process, but you need to apply your own analysis to see if these stocks pique your interest as well. There are no guaranteed winners here!
Current Market Outlook:
Market Trend: Currently, we have Trend Model BUY signals in all three timeframes on the DP Scoreboard Indexes.
Market Condition: The market is overbought, with Price Momentum Oscillator (PMO) BUY signals on the DP Scoreboards. Remember, overbought conditions can persist in a bull market.
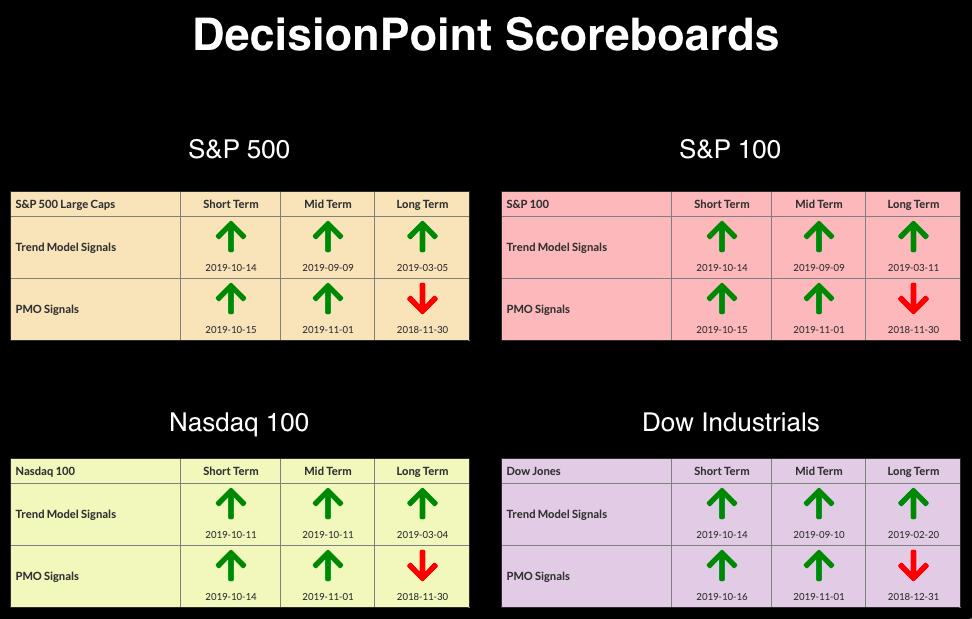
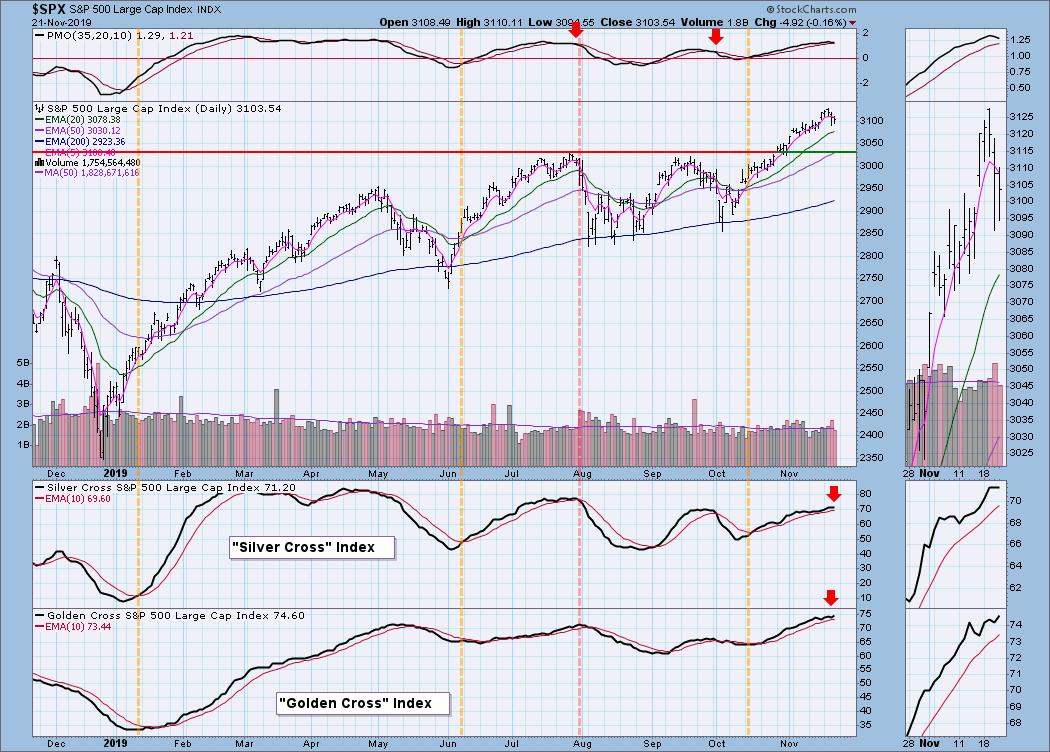
Market Environment: It is important to consider the odds for success. The Silver Cross Index measures the percentage of stocks on IT Trend Model BUY signals (20-EMA > 50-EMA), while the Golden Cross Index measures the percentage of stocks on LT Trend Model BUY signals (50-EMA > 200-EMA). Here are the current percentages on the Silver and Golden Cross Indexes:
Diamond Index:
- Diamond Scan Results: 4
- Diamond Dog Scan Results: 18
- Diamond Bull/Bear Ratio: 0.22
Canopy Growth Corp (CGC) - Earnings: 11/14/2019
CGC reported not-so-hot earnings and the price dropped deeply. At this point, it has covered that gap down on earnings and is now ready to move higher. The first area of possible overhead resistance will be around $23, the August low. After that, the 2018 low could also be a problem at $25. Despite that overhead resistance, I'm looking for a move toward the gap resistance area, which I've marked around $30-$32. We saw quite a bit of volume come in on the rally yesterday and today, so institutional money may be moving back in. The OBV has shot skyward because of that heavy volume. This is a risky play based on the industry itself, so I'm avoiding the weed stocks in general. But if you have an appetite for risk and some good upside potential, I think this one could work.
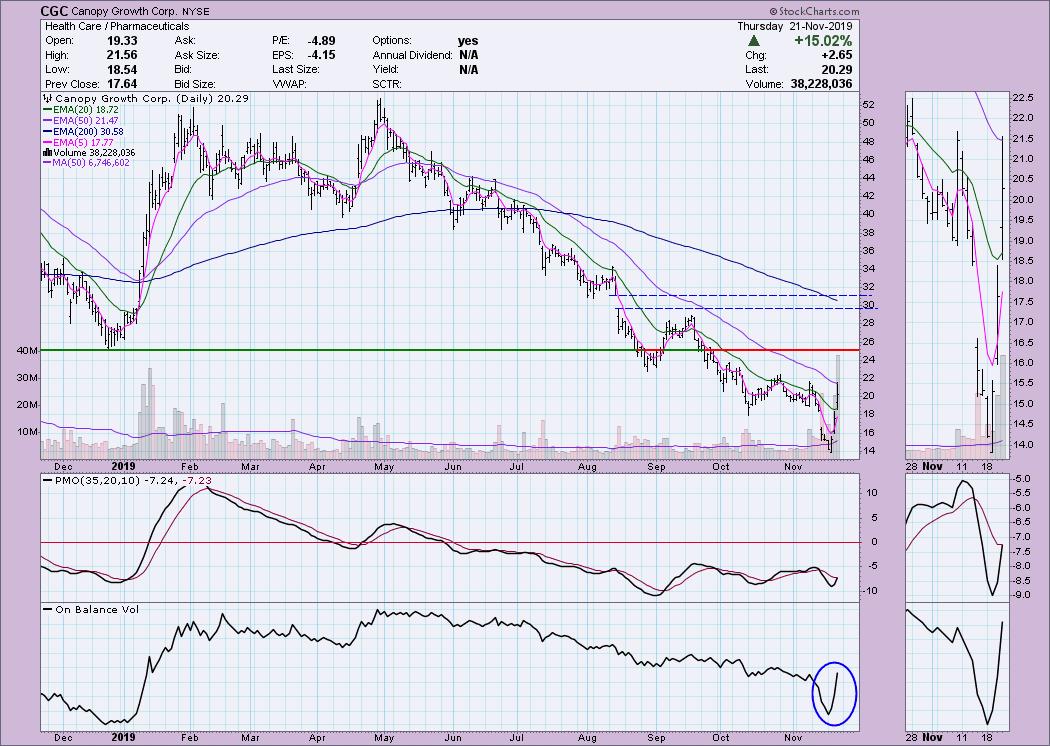
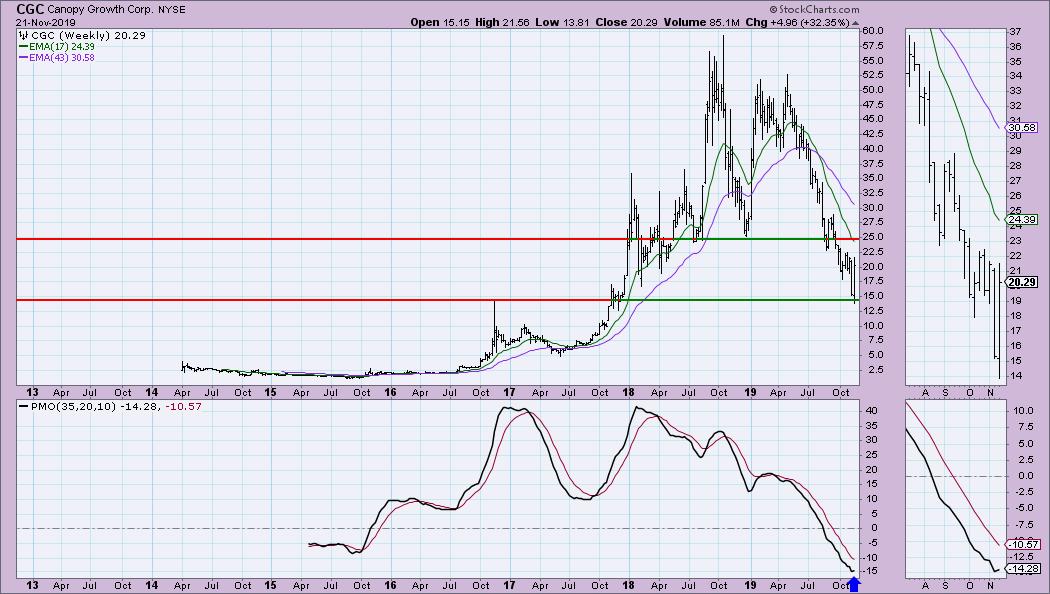
Support has not actually been put in yet, but, given the 2016 high, I'm looking for that to hold up. The PMO appears to be in oversold territory; however, with the lack of historical data and an upper range reading of +40, I won't commit to that. It has turned up after reaching its lowest reading so far.
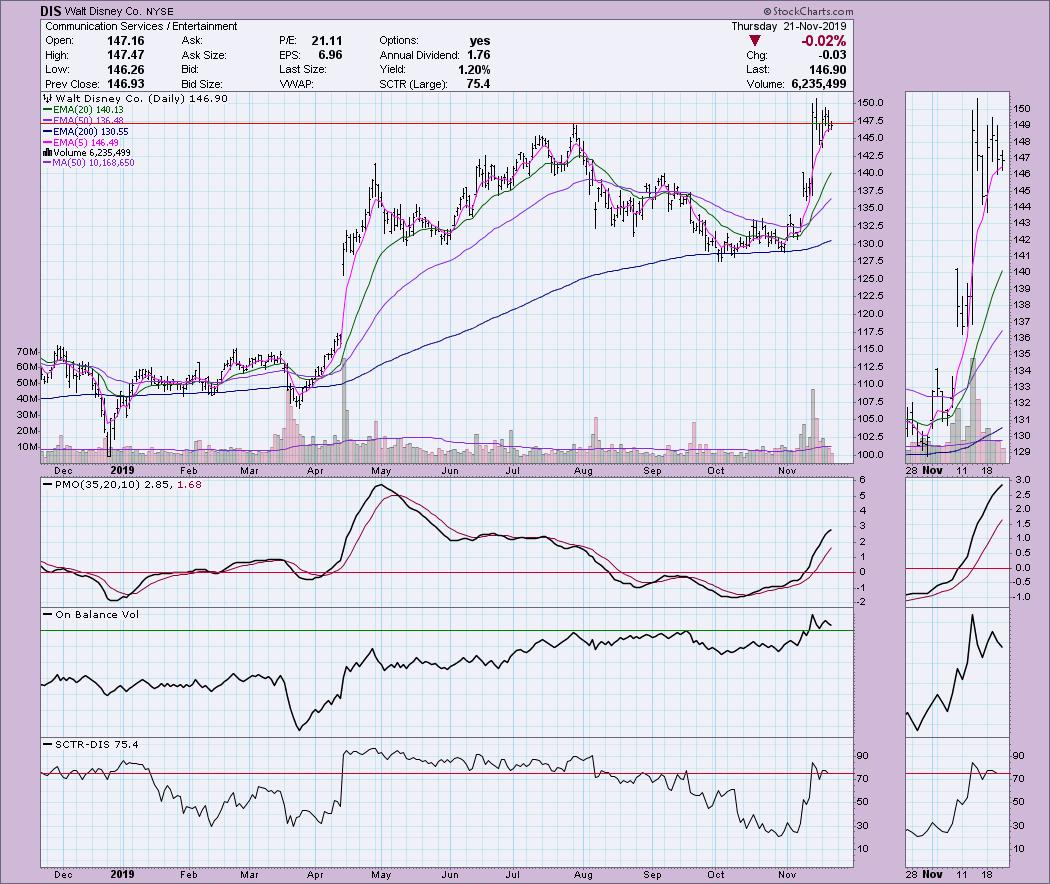
Walt Disney Co. (DIS) - Earnings: 2/3 - 2/7/2020
Price broke out last week on the launch of the Disney+ app. It has since been consolidating the move to form what could be a pennant on a flag pole. The PMO is not overbought yet. Admittedly, I wish I'd seen this one earlier when we had the new PMO BUY signal back in October, but it missed my radar. I note that volume has been backing off, but the OBV is still holding above previous highs. This one is extended, but this does look like a pause along the way up.
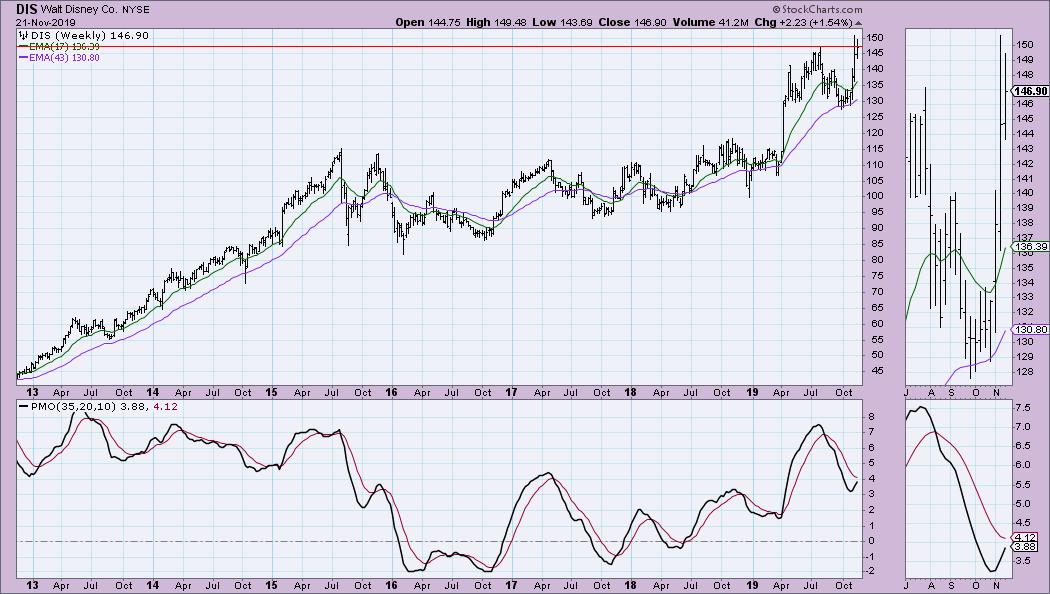
The weekly PMO looks great. I would like to see a close above the 2019 high tomorrow for confirmation, but it looks pretty bullish as is.
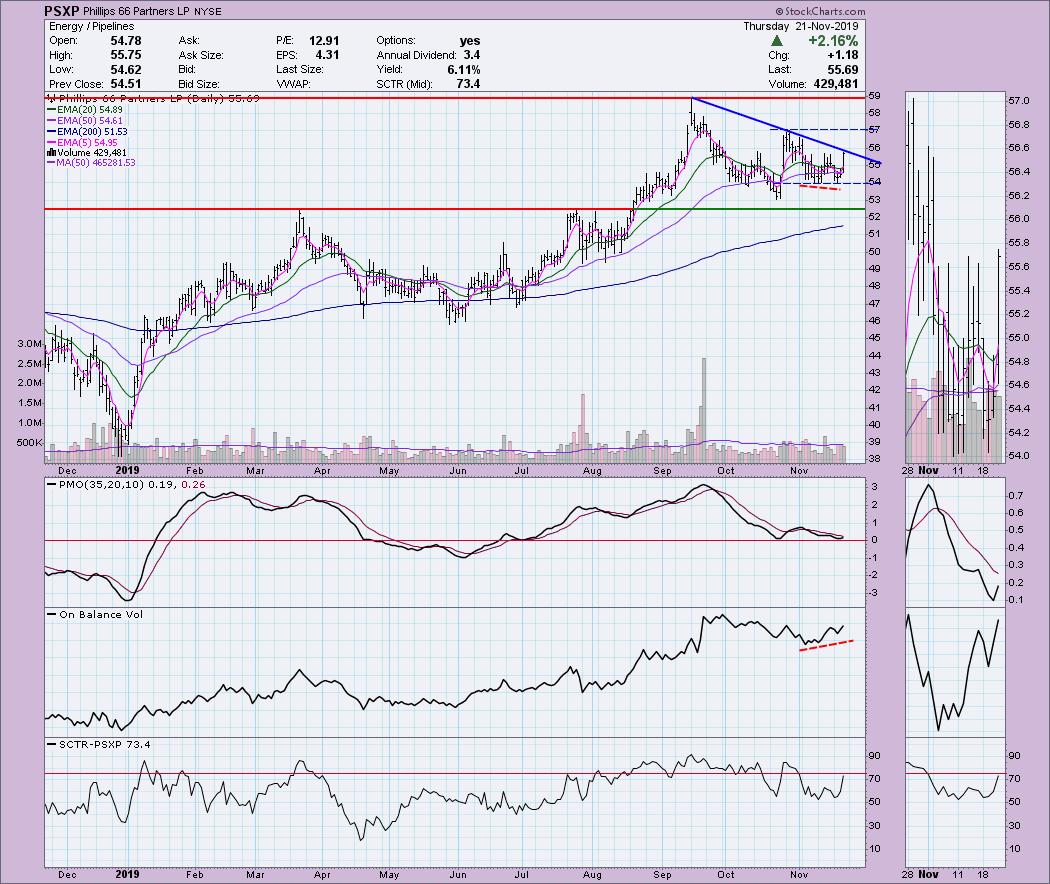
Phillips 66 Partners LP (PSXP) - Earnings: 2/6 - 2/10/2020
I'm bullish on Oil, so when I saw PSXP hit the list I thought it might be good. Today, it rallied over 2%. It hasn't actually broken out above the declining tops trend line, but I do note a positive divergence between price bottoms and the OBV. The PMO has turned up above the zero line. A good dividend and yield are a bonus.
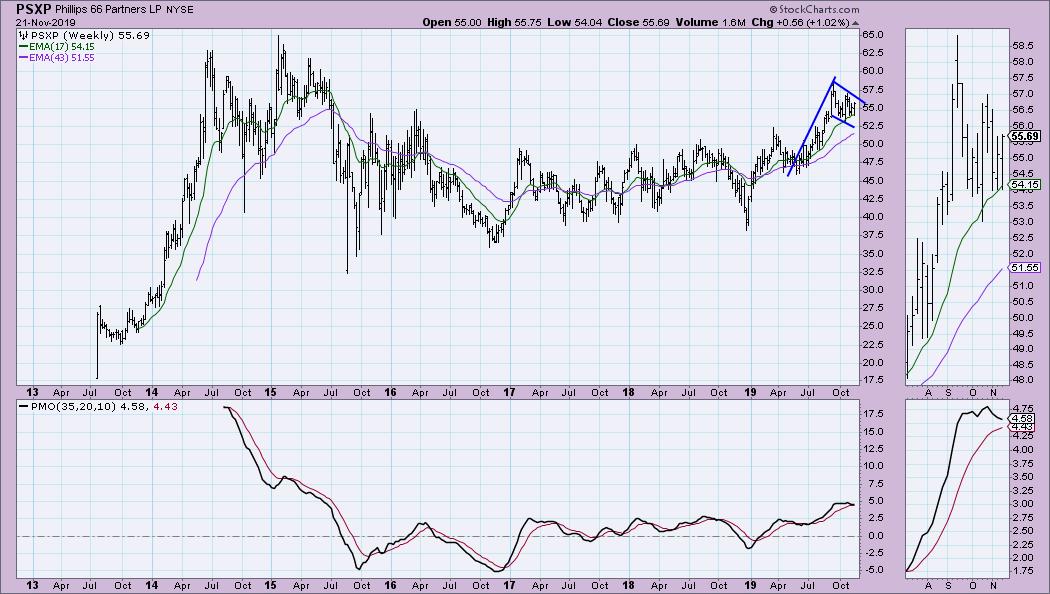
I spot a flag formation on the weekly chart. The PMO is decelerating but is still pointed lower. I'd ditch this from my watch list if it generates a SELL signal.
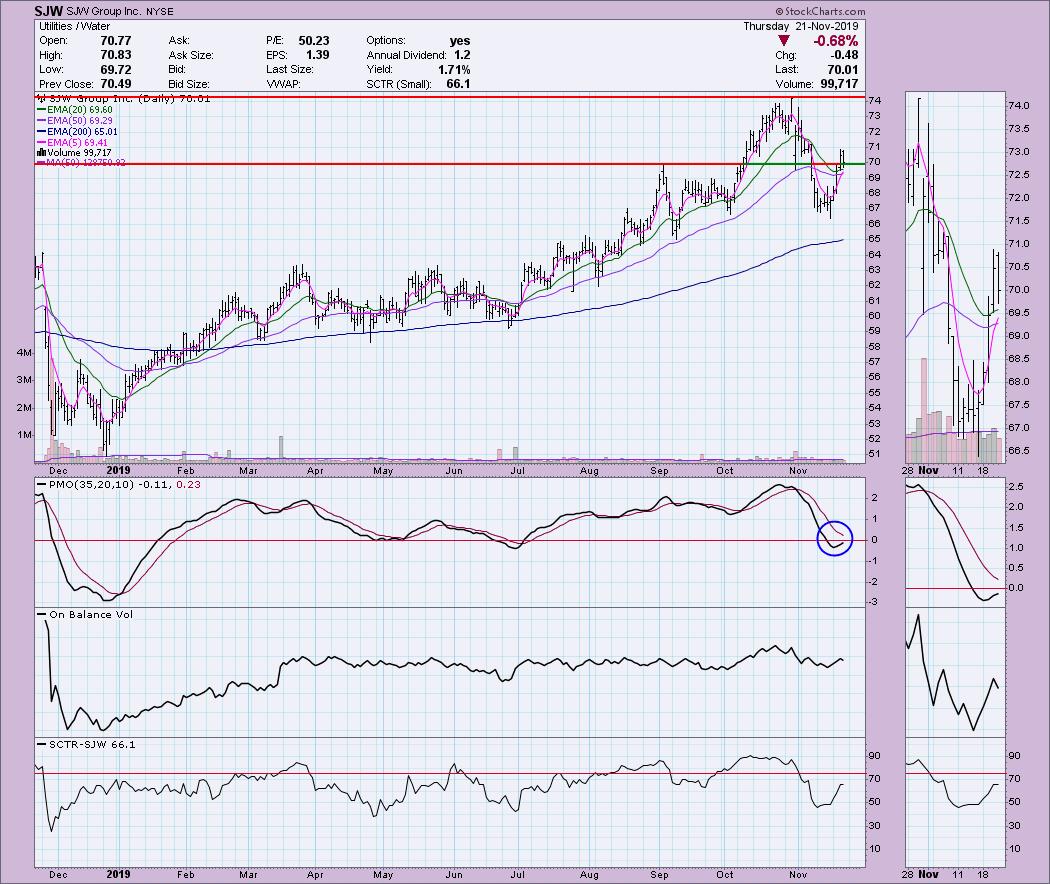
SJW Group Inc (SJW) - Earnings: 2/18 - 2/24/2020
The PMO is turning up in near-term oversold territory and we see a pullback toward the breakout area. Accumulation appears to be taking place based on the rising OBV and, of course, volume bars. Notice the 20-EMA avoided crossing below the 50-EMA. Price is holding above the 20-EMA. My upside target is $74.
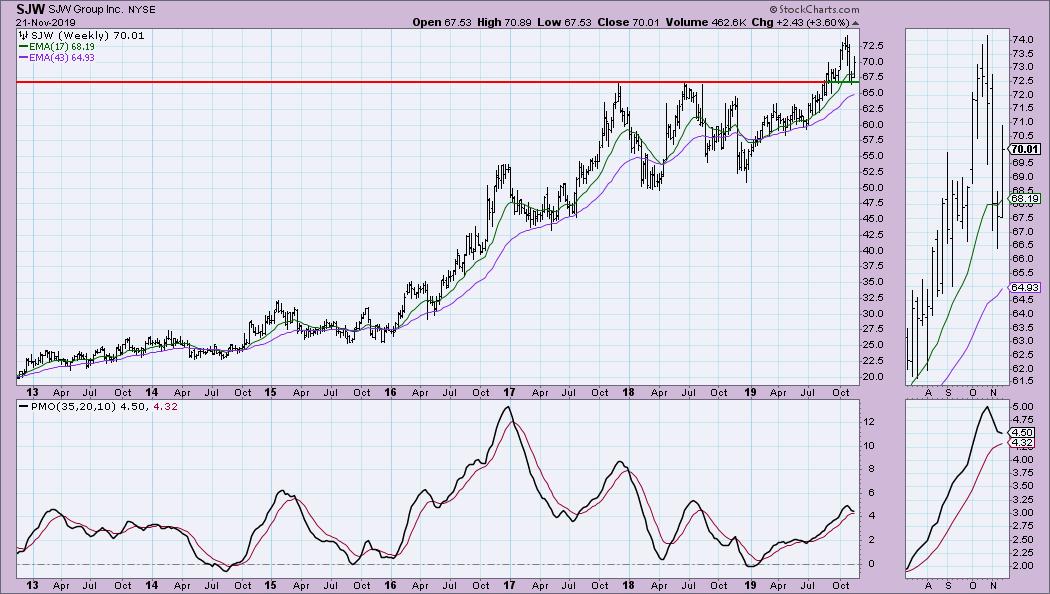
Notice how important the bounce off support is. That is strong support at the 2017 and 2018 highs. I'm not thrilled with the weekly PMO, but it is decelerating.
Seaspan Corp (SSW) - Earnings: 11/7/2019
I immediately spotted a bullish ascending wedge forming. The PMO is about to trigger a BUY signal. Volume is coming in strong, so I'm looking for a breakout. If we don't see one, it may decide to go test the bottom of the rising bottoms trend line. At this point, the chart is positive and suggests a breakout in the works. We will want to see volume on the breakout.
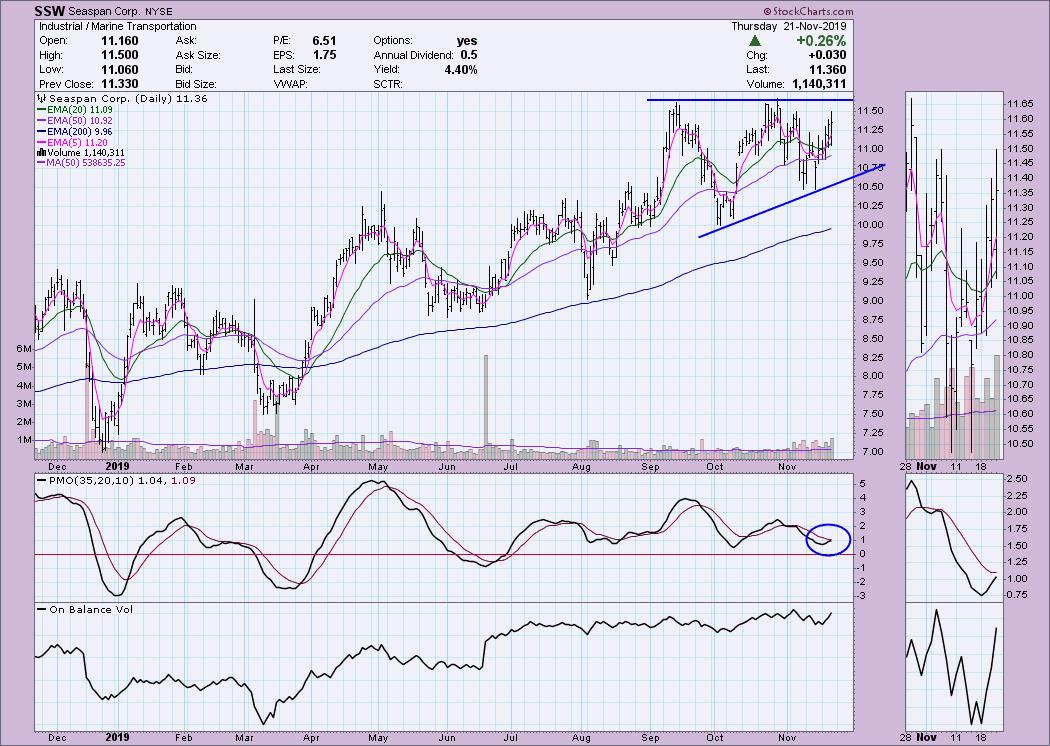
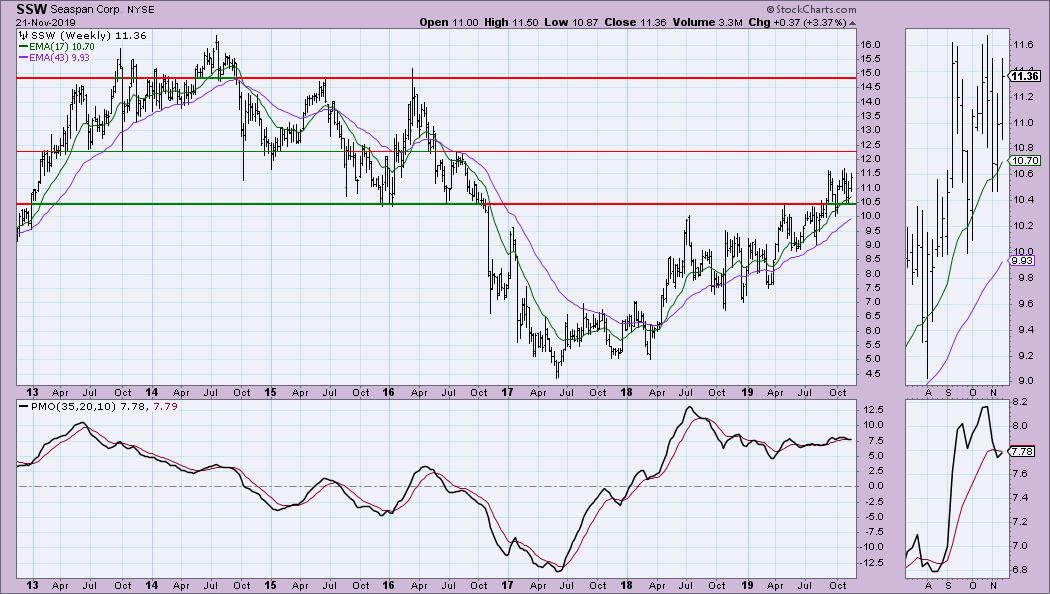
The PMO has turned up, but it has been very twitchy and flat. That is due to the steady rising trend and the volatility within it. I'd look for $12.25 as the next possible area of overhead resistance, which isn't that far away. I think the daily chart is bullish enough to bolster the case that it will break out there and likely continue toward $15.
Full Disclosure: I do not own any of the stocks above and I'm not planning on adding any at this time. I'm currently about 80% in cash.
Special Announcement!
I will be presenting at the "Market Vision 2020" online conference on January 4th! It is sponsored by EarningsBeats.com and promises to be "THE" event to start the new year. We will have many of the commentators that you love presenting their "market view" for 2020, with John Murphy as the keynote speaker! For information on the event, sign up for the free emails that will give you all the details as we get closer!

Erin Swenlin will be presenting at the The MoneyShow Las Vegas May 11-13, 2020! You'll have an opportunity to meet Erin and discuss the latest DecisionPoint news and Diamond Scans. The conference is free to attend or view online!
Watch the latest episode of DecisionPoint with Carl & Erin Swenlin LIVE on Mondays 5:00p EST or on the StockCharts TV YouTube channel here!
Technical Analysis is a windsock, not a crystal ball.
Happy Charting!
- Erin
erinh@stockcharts.com
NOTE: The stocks reported herein are from mechanical trading model scans that are based upon moving average relationships, momentum and volume. DecisionPoint analysis is then applied to get five selections from the scans. The selections given should prompt readers to do a chart review using their own analysis process. This letter is not a call for a specific action to buy, sell or short any of the stocks provided. There are NO sure things or guaranteed returns on the daily selection of "diamonds in the rough."
Helpful DecisionPoint Links:
DecisionPoint Shared ChartList and DecisionPoint Chart Gallery
Price Momentum Oscillator (PMO)
Swenlin Trading Oscillators (STO-B and STO-V)
**Don't miss DecisionPoint Commentary! Add your email below to be notified of new updates"**


