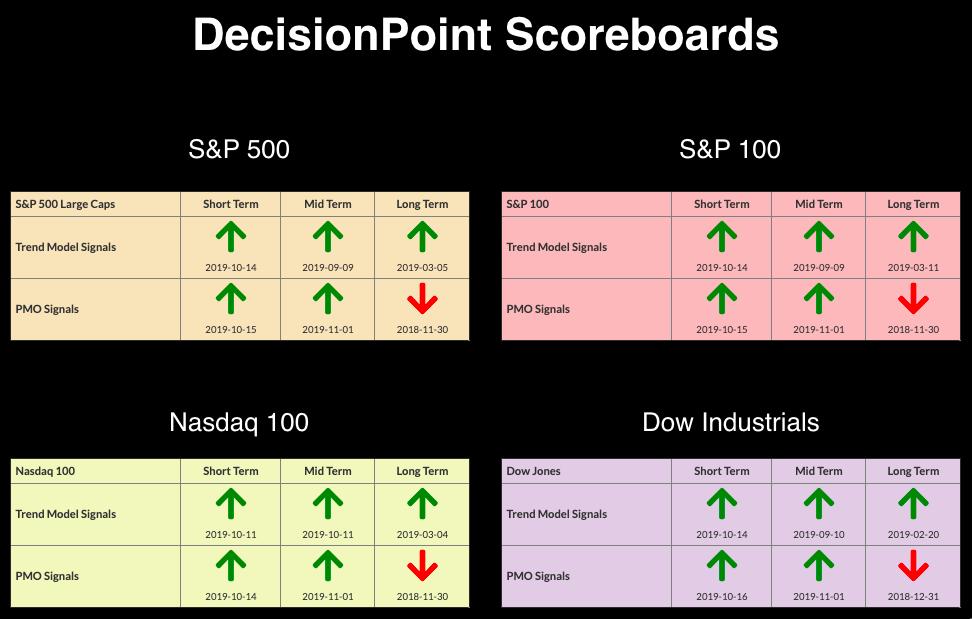
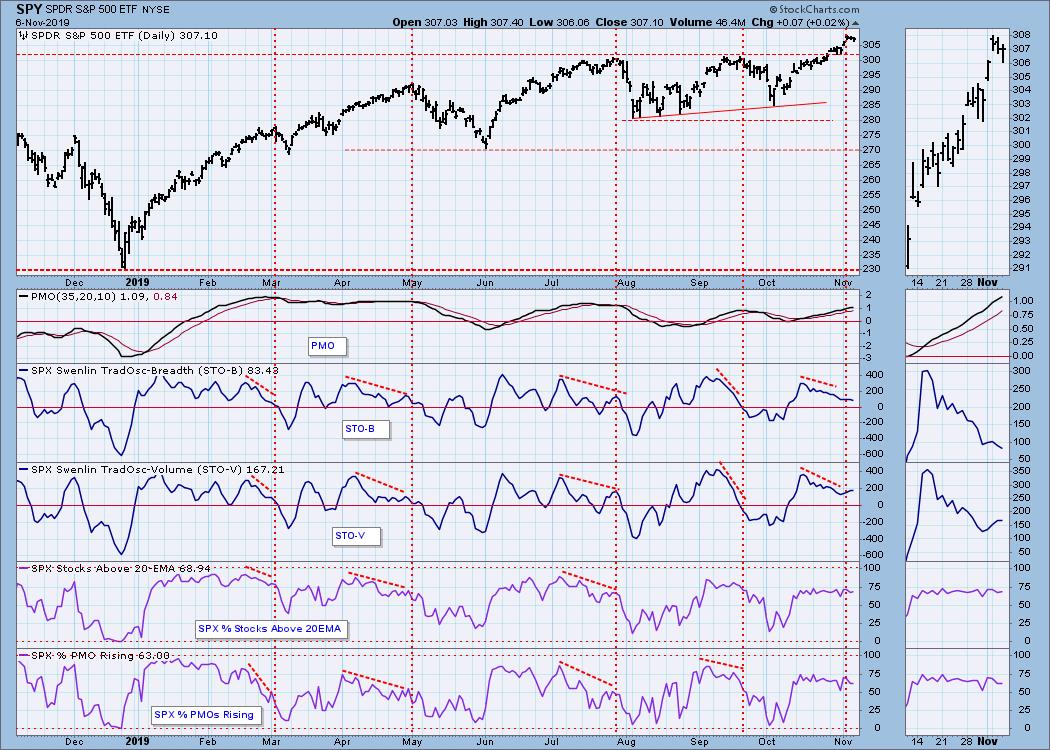
 Last Friday, all four indexes on the Scoreboards had weekly PMO crossover BUY signals. It is hard to argue a Scoreboard that is this positive, but I still see a few problems that I'll talk about further. Carl and I discussed a new version of the Swenlin Trading Oscillator chart that I want to show you. The negative divergences shown on these STOs may not be as negative as they appear when you add in a few breadth indicators. Additionally, we have to remember that overbought conditions can persist in a bull market rally, although this doesn't make me feel that much better about the market right now.
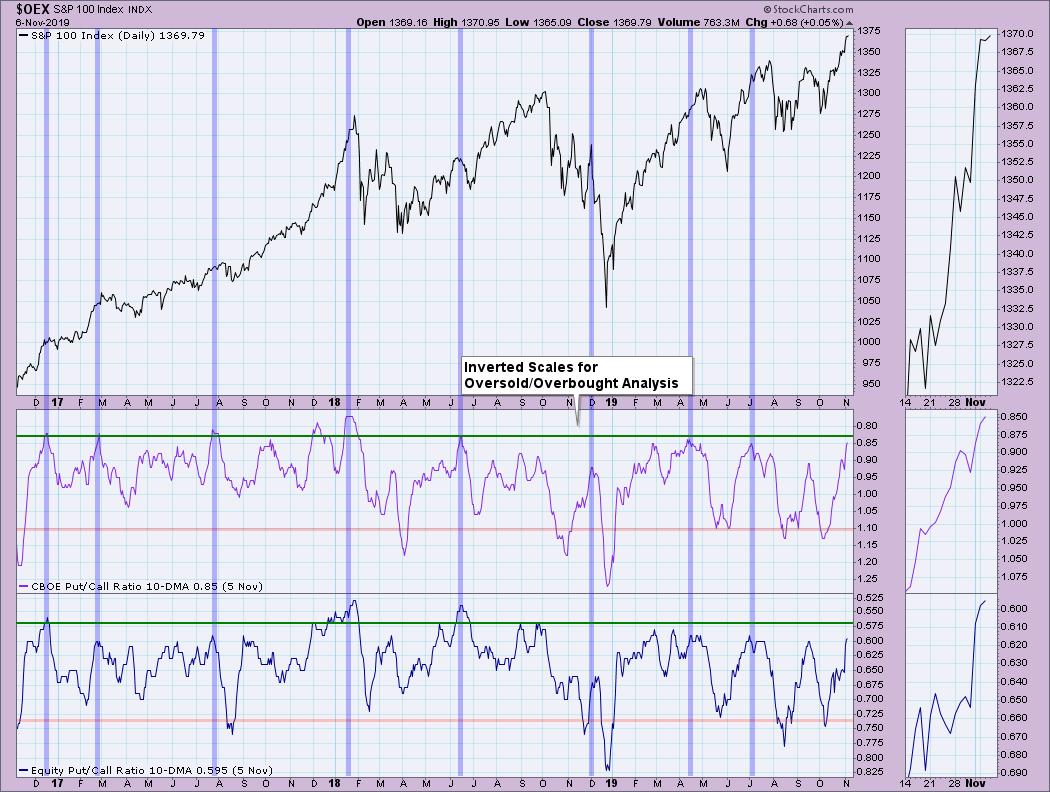
These ratios have not yet updated for today, but I suspect it won't be changing by much. I invert my scales so that overbought is on the top and oversold is on the bottom. Based on this, we can see that we have very overbought conditions on these ratios. What I like is that these indicators tend to be predictive rather than reactive. I see this chart telling me we could see some more upside, but that a downturn is likely arriving soon.
The DecisionPoint Alert presents a mid-week assessment of the trend and condition of the stock market (S&P 500), the U.S. Dollar, Gold, Crude Oil and Bonds.
Watch the latest episode of DecisionPoint on StockCharts TV's YouTube channel here!
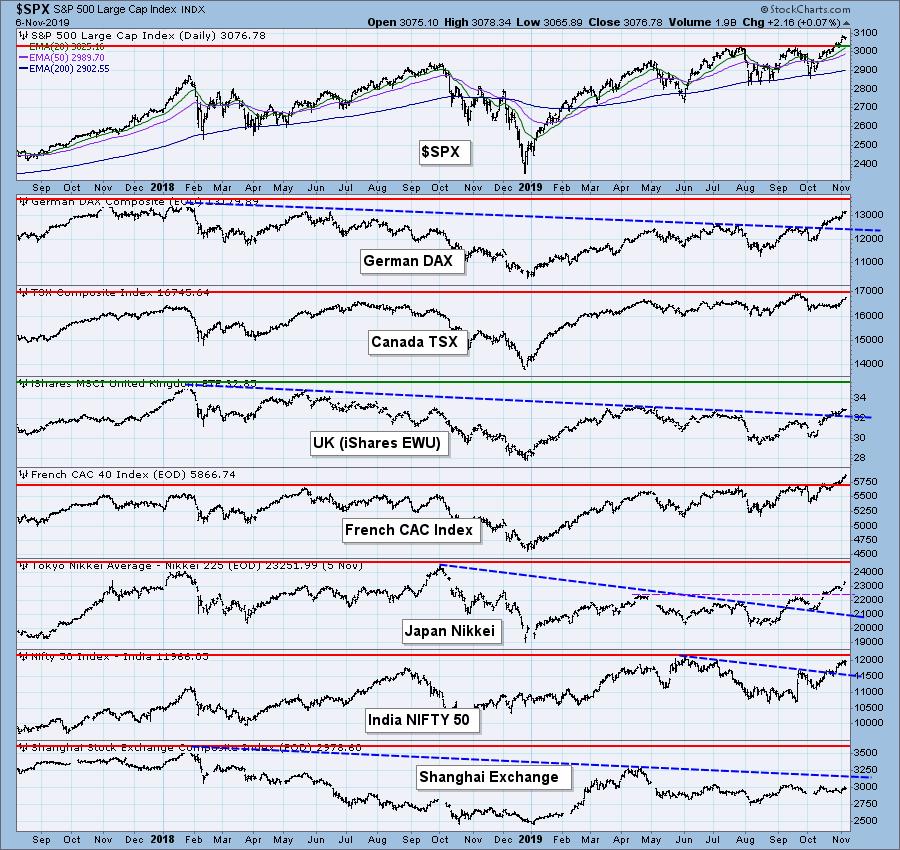
GLOBAL MARKETS
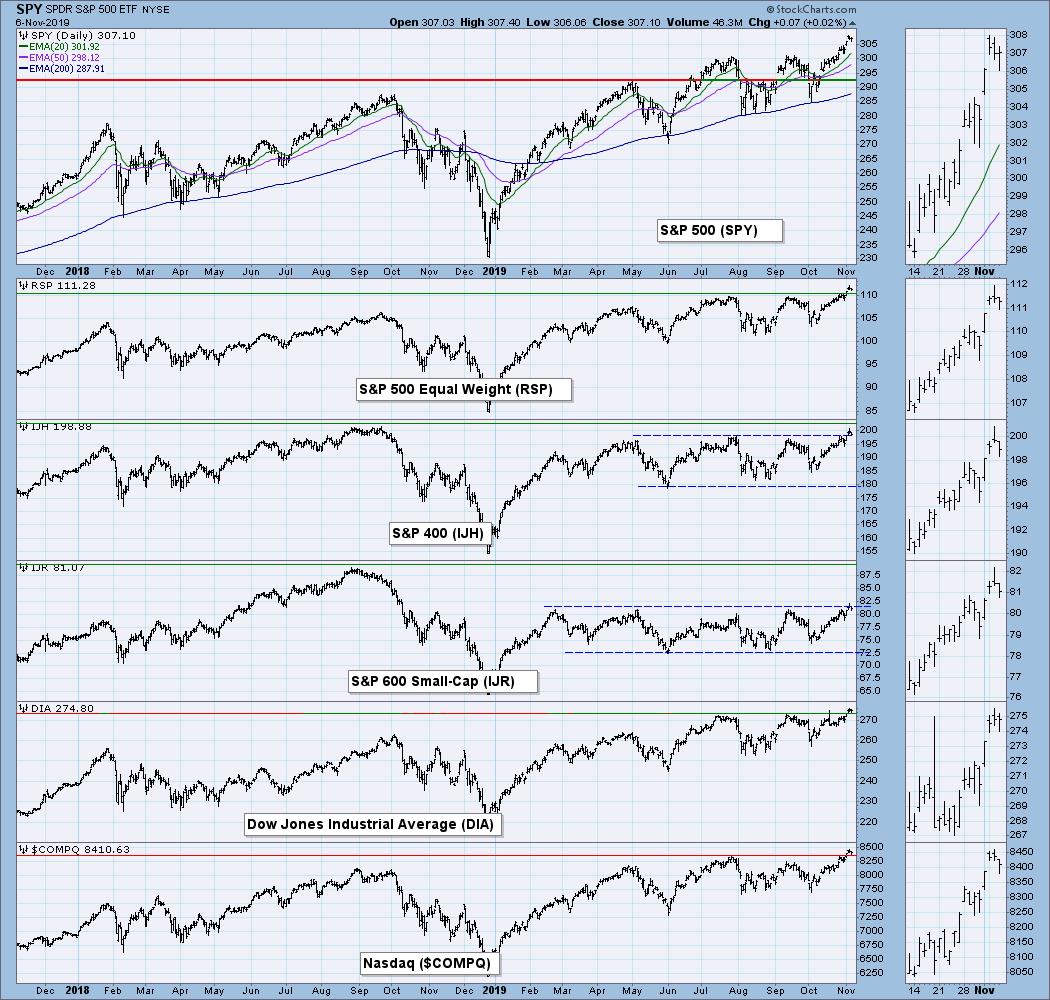
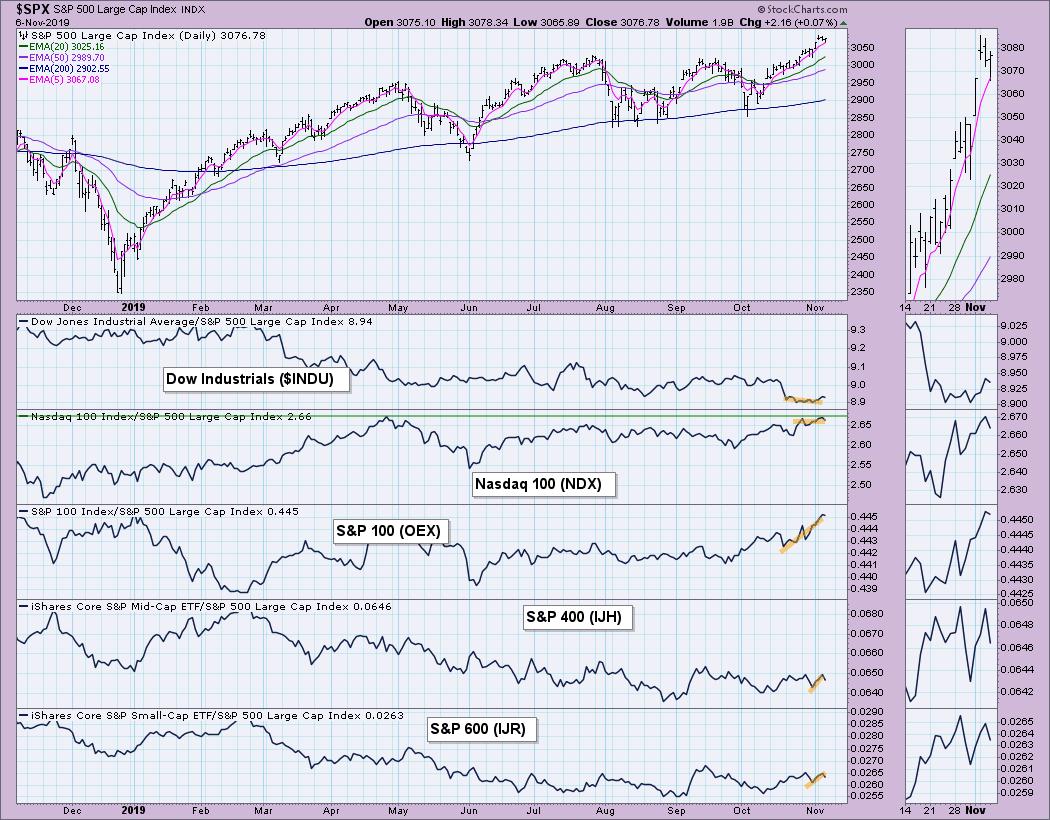
BROAD MARKET INDEXES
MARKET INDEXES PRICE RELATIVE TO SPX
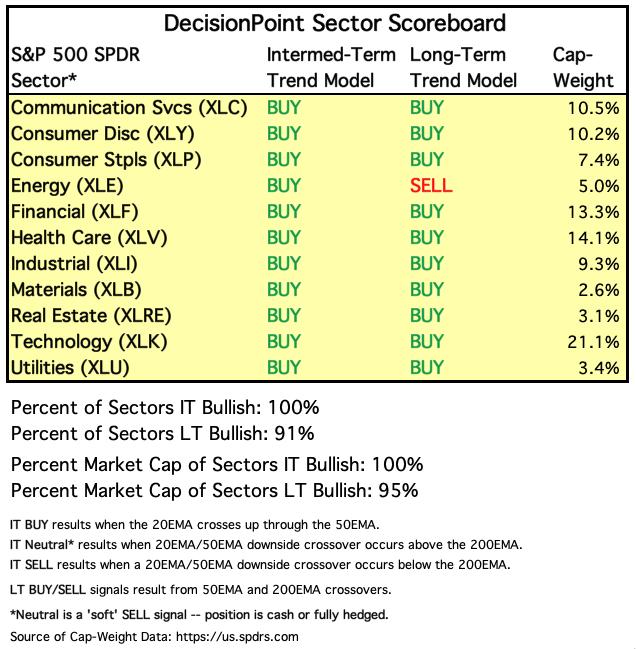
SECTORS
Each S&P 500 Index component stock is assigned to one, and only one, of eleven major sectors. This is a snapshot of the Intermediate-Term and Long-Term Trend Model signal status for those sectors.
STOCKS
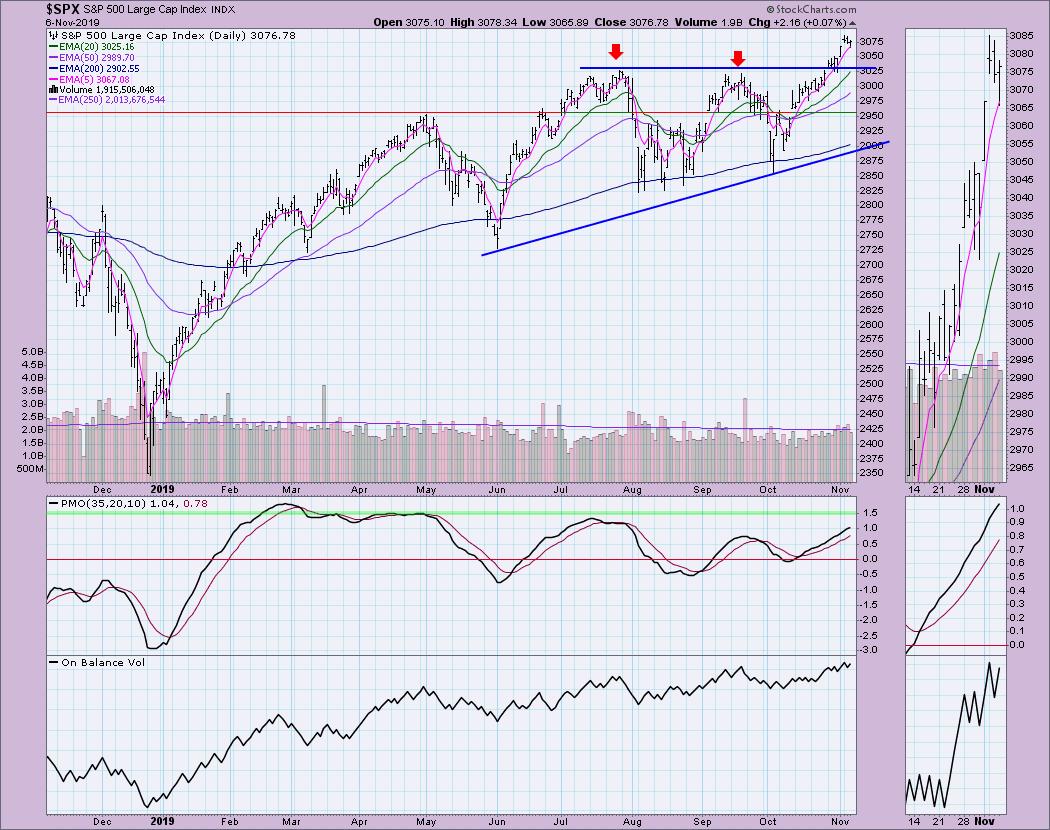
IT Trend Model: BUY as of 9/4/2019
LT Trend Model: BUY (SPY) as of 2/26/2019
SPX Daily Chart: The ascending triangle has executed with a breakout on Monday, but it isn't a decisive (3%+) breakout yet. The PMO is getting overbought and is moving higher. Today we saw pullback to the 5-EMA, but price did close near the highs for the day. Today's bar closed the gap formed on Monday. I find that, when these gaps close, price continues in that direction. A successful retest of the top of the triangle will make me feel much better about a continuation.
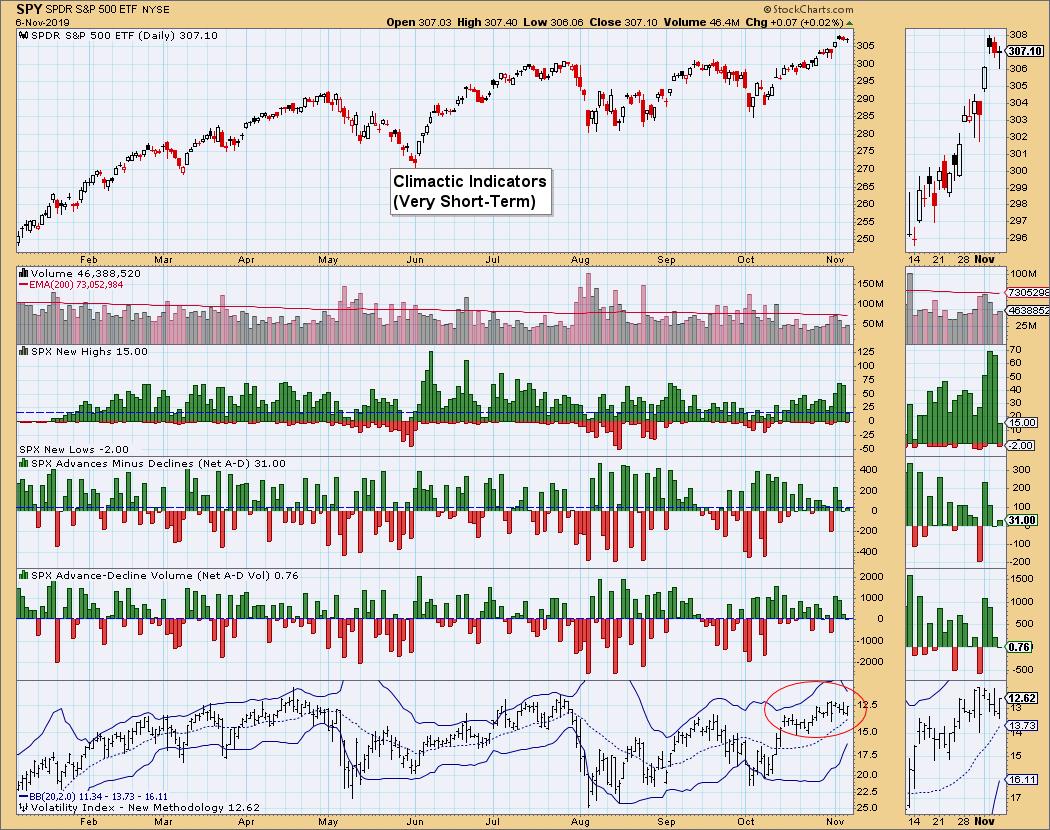
Climactic Market Indicators: No climactic activity today, but we can see the buying climax that occurred Monday and Tuesday. The VIX topped before testing the top Bollinger Band; typically, a top of the VIX means more downside. The reaction hasn't been terrible, but we did see a slight pullback from the intraday highs.
Short-Term Market Indicators: Below is the chart that Carl forwarded to me today. The negative divergences are still there on the STOs, but breadth as far as stocks above their 20-EMA and %PMOs rising were mostly flat during that same period, not in decline. Still, those readings on breadth are below 70%. Ultimately, our analysis was that the negative divergences are still an issue and that breadth readings should be higher. It was somewhat heartening to see that breadth overall has been mostly steady and not in decline, but we would expect to see those breadth numbers rising as we rally into new all-time highs.
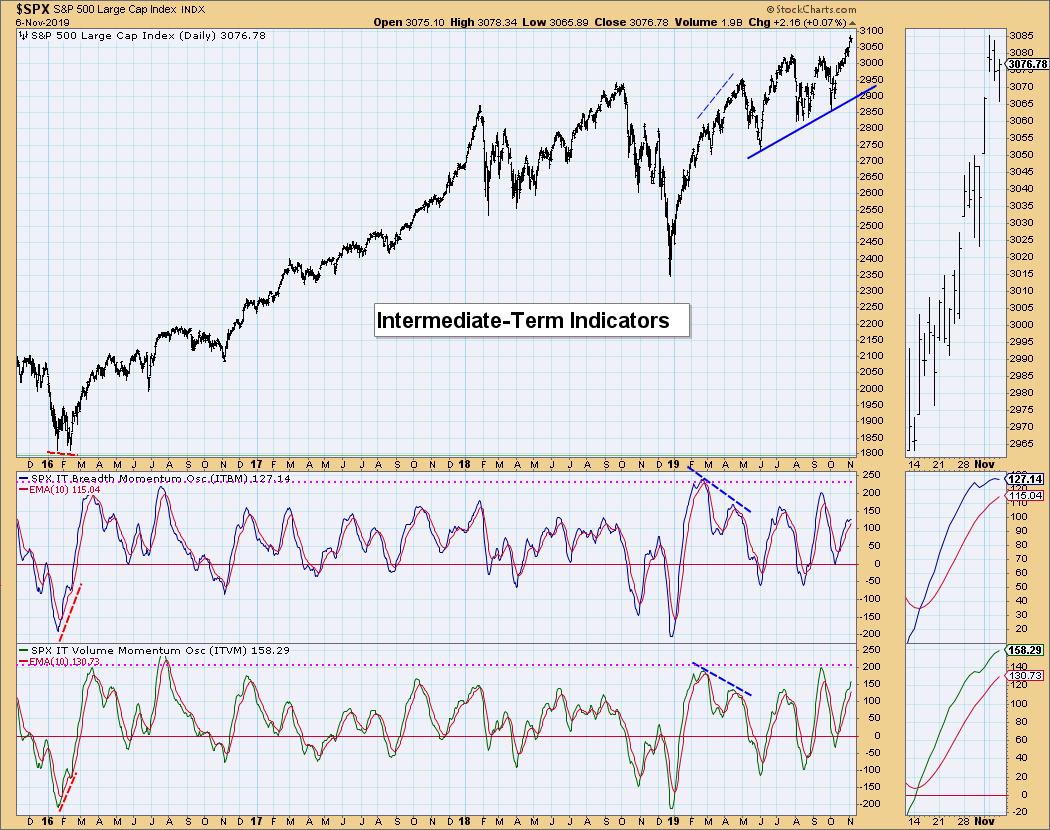
Intermediate-Term Market Indicators: These indicators are decelerating and are acting like they will top soon. As I always say about this chart, I don't get concerned until we have the negative crossovers; nor do I get overly bullish until we have positive crossovers. Seeing them topping isn't good, but they have managed to resist gravity on many occasions and keep moving higher.
Conclusion: The market is in a bullish rising trend and momentum is confirming. The market indicators aren't supporting this rally to all-time highs as I would expect, which leaves me cautious and waiting for the other shoe to drop. As I write in my Diamonds Reports, I remain 60% in cash. I'm itching to buy in, but my investing strategy and risk tolerance are more conservative. This has prevented me from getting in right at the bottom, but it has served me well in preserving capital and potential losses. I prefer to "leave money on the table" by sitting in cash during a rally, rather than be extended and face a quick decline (which nearly all declines tend to be--fast and furious). I didn't seriously reenter the market until about February last year, so I didn't reap the rewards that others did. However, I still did very well overall and that is what is most important to me as an investor. How many times have I heard "I made 15%, but I was up 35%!"? Hello! You made 15% and didn't lose! Pat yourself on the back for a job well done and don't count the money that you feel that you "left on the table." Anyway, that's enough pontificating; let's check out the Big Four...
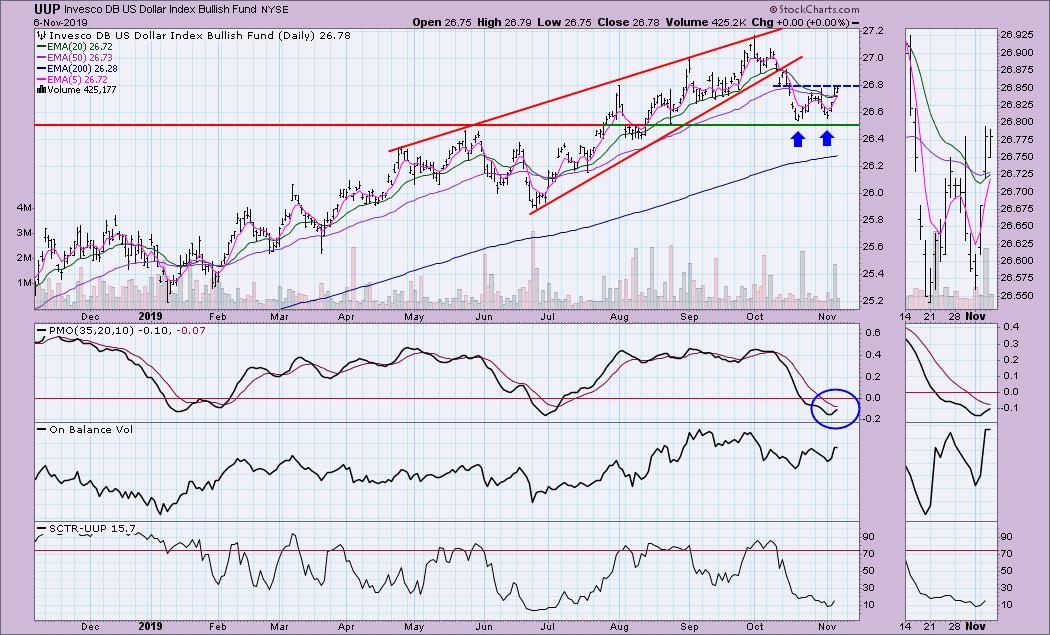
DOLLAR (UUP)
IT Trend Model: Neutral as of 10/31/2019
LT Trend Model: BUY as of 5/25/2018
UUP Daily Chart: Talk about a textbook double-bottom pattern forming! This comes as the PMO is turning up in oversold territory. Interestingly, the minimum upside target of this pattern lands just below the October top. I'm bullish on the Dollar.
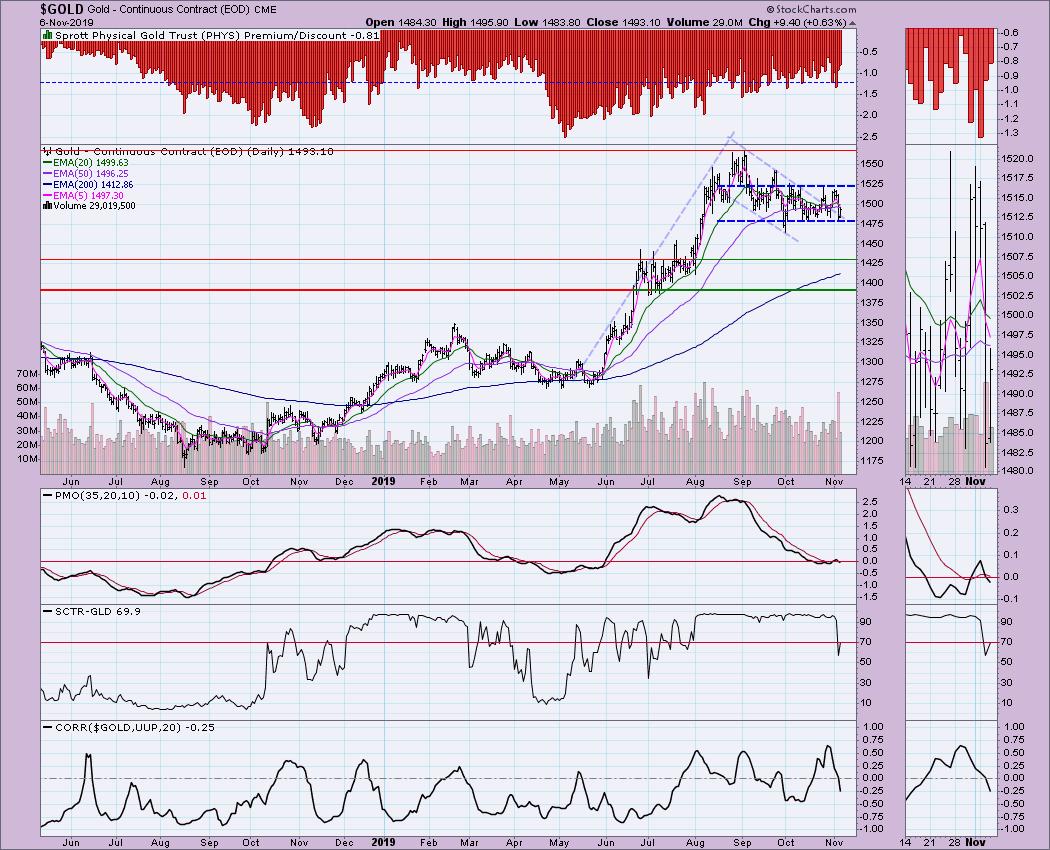
GOLD
IT Trend Model: BUY as of 6/3/2019
LT Trend Model: BUY as of 1/8/2019
GOLD Daily Chart: I still am watching a possible bull flag pattern, but right now it's more important to watch the trading channel that Gold has formed in the short term. The PMO had given us a BUY signal just as Gold appeared to be executing the flag. And yet price turned abruptly lower and took the PMO down with it. The good news is that Gold is stubbornly holding onto support around 1475 and the PMO is oversold and ripe for a turnaround. However, if the Dollar begins rising strongly off the double-bottom pattern, Gold will have some headwinds to overcome. The short-term correlation is turning negative again, which means that Gold will be apt to move lower if the Dollar moves higher.
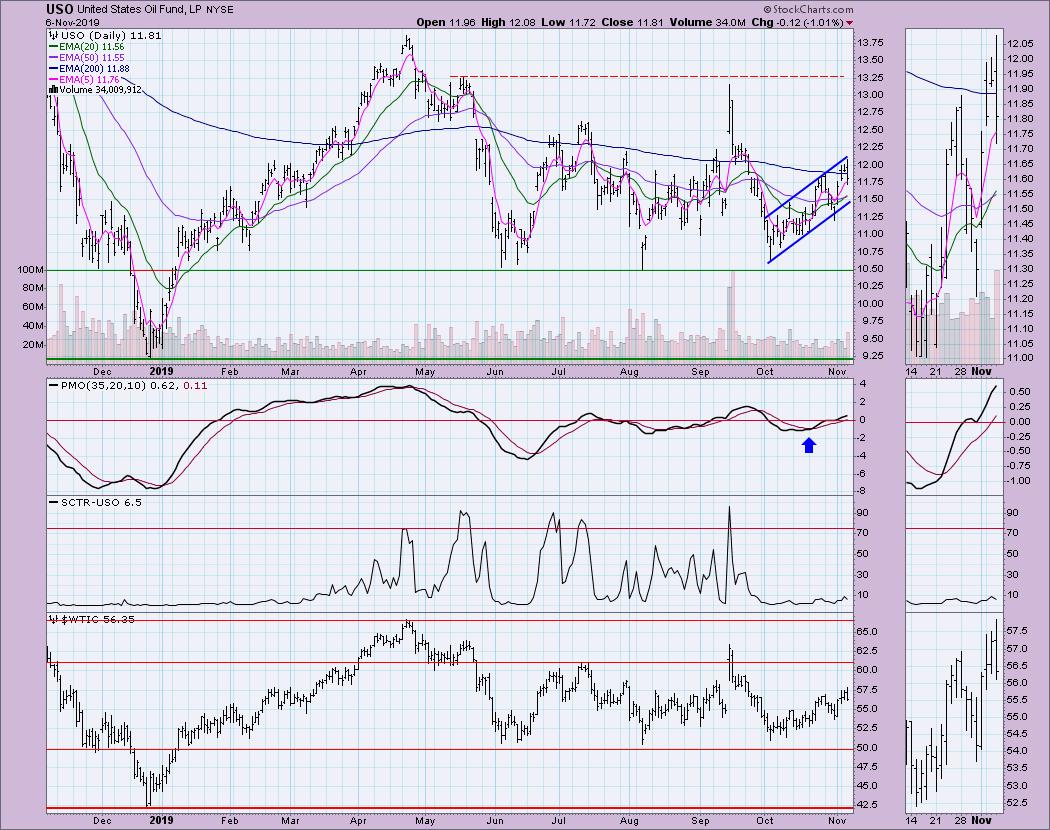
CRUDE OIL (USO)
IT Trend Model: SELL as of 10/2/2019
LT Trend Model: SELL as of 6/4/2019
USO Daily Chart: USO is traveling in a rising trend channel and appears ready to go back down and test the bottom of it. The PMO is still rising and has reached positive territory. Another piece of good news is that the 20-EMA has just crossed above the 50-EMA, triggering an Intermediate-Term Trend Model BUY signal. I suspect USO will continue rising within in the trend channel and should reach overhead resistance at the July top before seeing some problems.
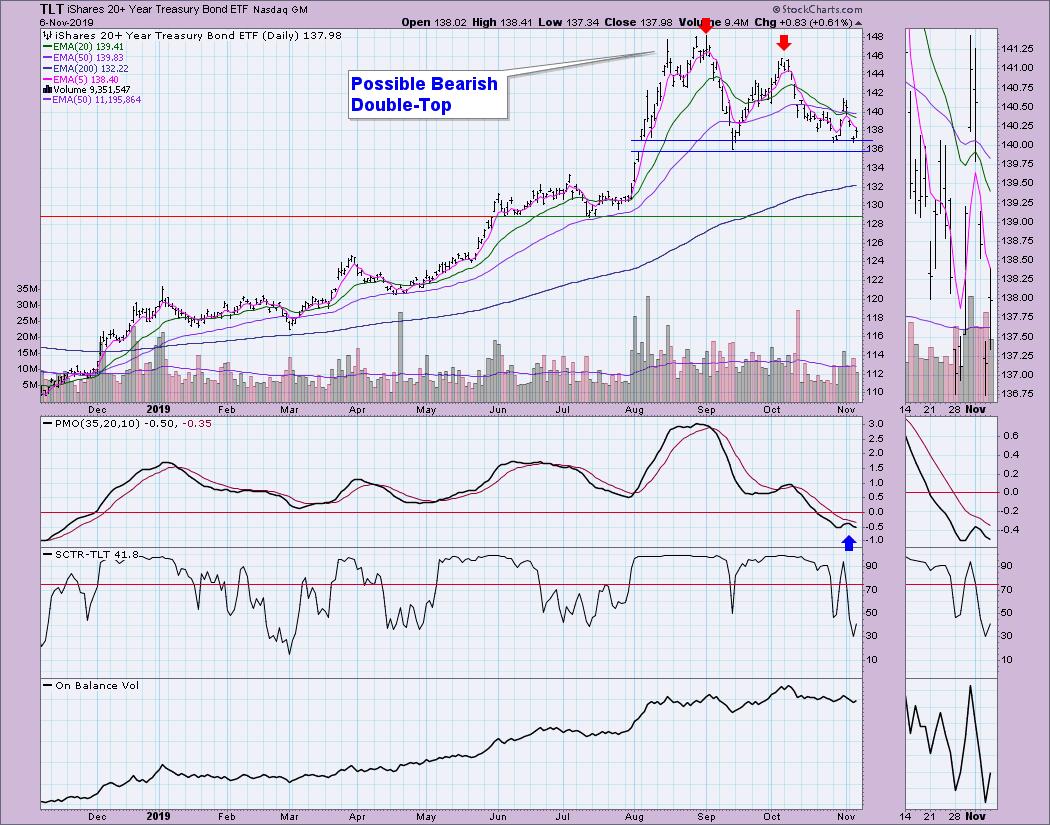
BONDS (TLT)
IT Trend Model: BUY as of 12/6/2018
LT Trend Model: BUY as of 1/2/2019
TLT Daily Chart: A PMO top below the signal line is a problem. Despite TLT resisting a breakdown below support, the indicators are suggesting that the August gap will finally be filled and that big double-top will execute. The PMO is oversold when you look at this past year, but the bottom of its "normal" range is around -2, so it can move lower. If price rallies and breaks above the top from last week, I would entertain the idea of a short-term double-bottom, but it's too early to speculate about that.
Technical Analysis is a windsock, not a crystal ball.
Happy Charting! - Erin
Email: erinh@stockcharts.com

Erin Swenlin will be presenting at the The MoneyShow Las Vegas May 11-13, 2020! You'll have an opportunity to meet Erin and discuss the latest DecisionPoint news and Diamond Scans. The conference is free to attend or view online!
**Don't miss any of the DecisionPoint commentaries! Go to the "Notify Me" box toward the end of this blog page to be notified as soon as they are published.**
NOTE: The signal status reported herein is based upon mechanical trading model signals, specifically the DecisionPoint Trend Model. These define the implied bias of the price index based upon moving average relationships, but they do not necessarily call for a specific action. They are information flags that should prompt chart review. Further, they do not call for continuous buying or selling during the life of the signal. For example, a BUY signal will probably (but not necessarily) return the best results if action is taken soon after the signal is generated. Additional opportunities for buying may be found as price zigzags higher, but the trader must look for optimum entry points. Conversely, exit points to preserve gains (or minimize losses) may be evident before the model mechanically closes the signal.
Helpful DecisionPoint Links:
DecisionPoint Shared ChartList and DecisionPoint Chart Gallery
Price Momentum Oscillator (PMO)
Swenlin Trading Oscillators (STO-B and STO-V)


