
I follow the Dollar and UUP, the companion ETF, as part of the "Big Four" in the DecisionPoint Alert. (Carl follows it as well in his Friday Weekly Wrap.) I wrote yesterday that it was looking good; today, it was among my scan results with two new BUY signals on it, so I couldn't resist including it. I also found a number of Retailers that I found interesting.
I love to get your feedback on DP commentary, so shoot me an email at erinh@stockcharts.com. I read every one of them and try to answer them all! Your insight helps me to tailor my commentary to what my readers and viewers want to hear about.
Welcome to "DecisionPoint Daily Diamonds," a newsletter in which I highlight five "diamonds in the rough" taken from the results of one of my DecisionPoint scans. Remember, these are not recommendations to buy or sell, but simply stocks that I found interesting. The objective is to save you the work of the initial, tedious culling process, but you need to apply your own analysis to see if these stocks pique your interest as well. There are no guaranteed winners here!
Current Market Outlook:
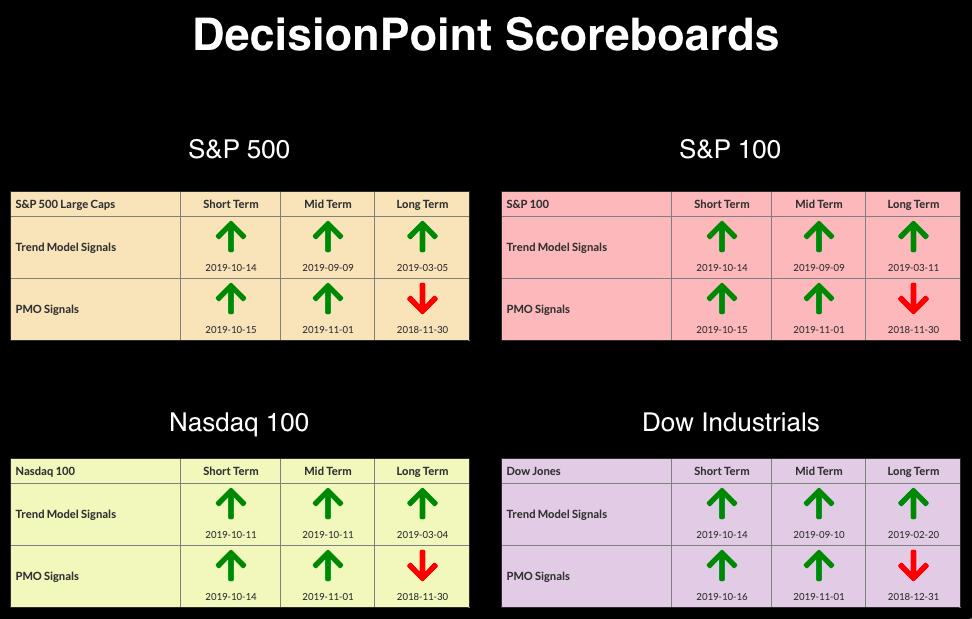
Market Trend: Currently, we have Trend Model BUY signals in all three timeframes on the DP Scoreboard Indexes.
Market Condition: The market is overbought and we have Price Momentum Oscillator (PMO) BUY signals on the DP Scoreboards. One thing I have learned that honestly drives me crazy is that overbought conditions can persist in a bull market. I did note that we had some climactic readings on New Highs that could suggest a downturn as part of a buying exhaustion.
Market Environment: It is important to consider the odds for success. Here are the current percentages on the Silver and Golden Cross Indexes:
- Silver Cross Index: 68.6% (rising) SPX IT Trend Model Buy Signals (20-EMA > 50-EMA)
- Golden Cross Index: 71.8% (rising) SPX LT Trend Model Buy Signals (50-EMA > 200-EMA)
Diamond Index:
- Diamond Scan Results: 4
- Diamond Dog Scan Results: 12
- Diamond Bull/Bear Ratio: 0.30
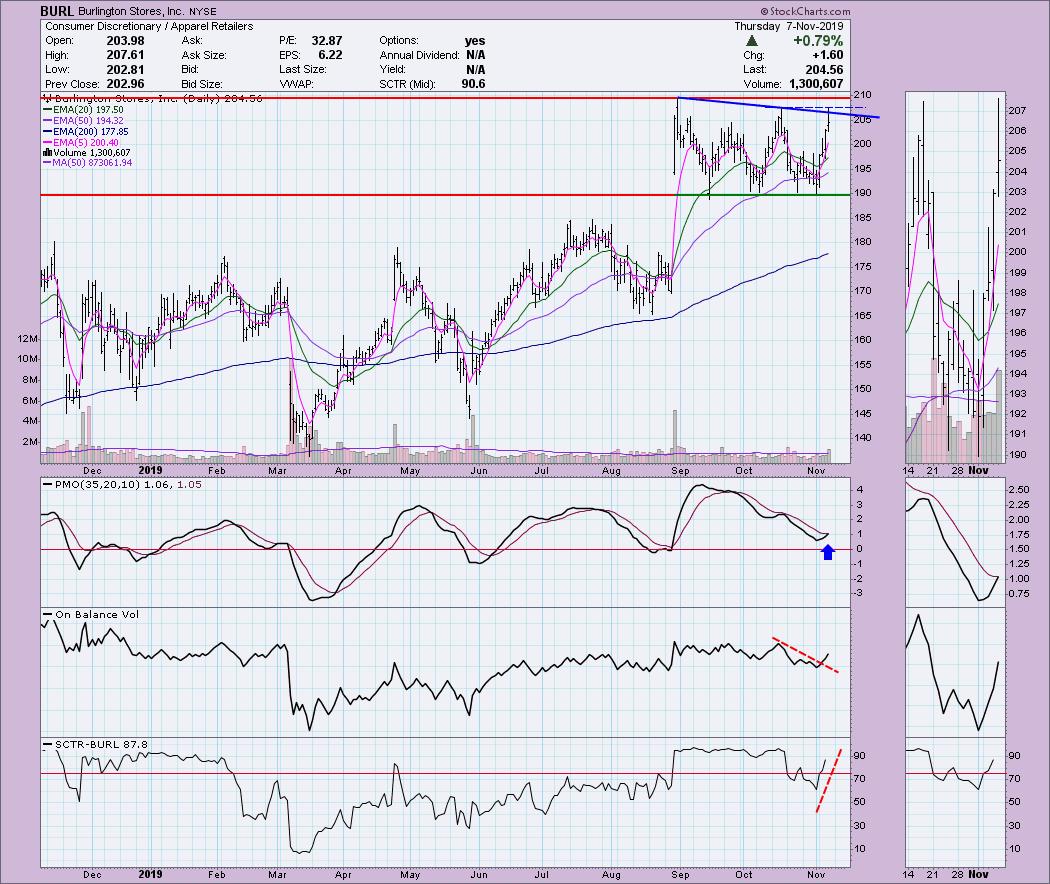
Burlington Stores Inc (BURL) - Earnings: 11/26 - 12/2/2019
Today, BURL broke out of a declining trend but closed beneath it. This one is probably a good one for a watch list. I generally don't want to get in at the top of a trading range; however, the PMO is telling us that the acceleration is bullish. The OBV shows a breakout and the SCTR is in the "hot zone" above 75, which implies internal and relative strength in the intermediate term.
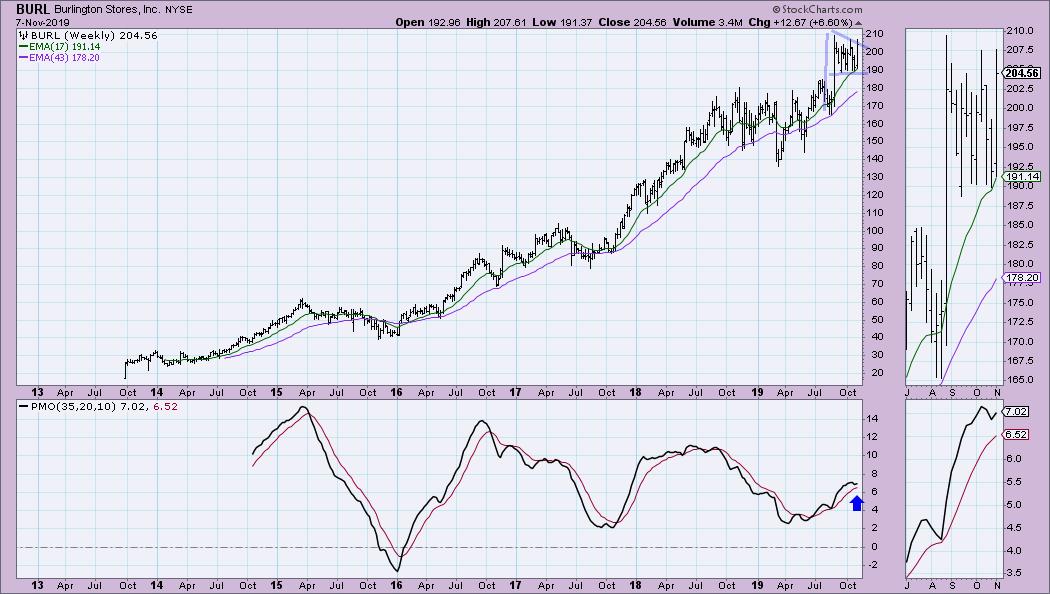
In order to have a breakout, BURL will have to reach new all-time highs. Given the bottom above the signal line on the weekly PMO, I believe it will breakout. If it does, there is a nice flag formation on the weekly chart that suggests much higher prices should we get that breakout.
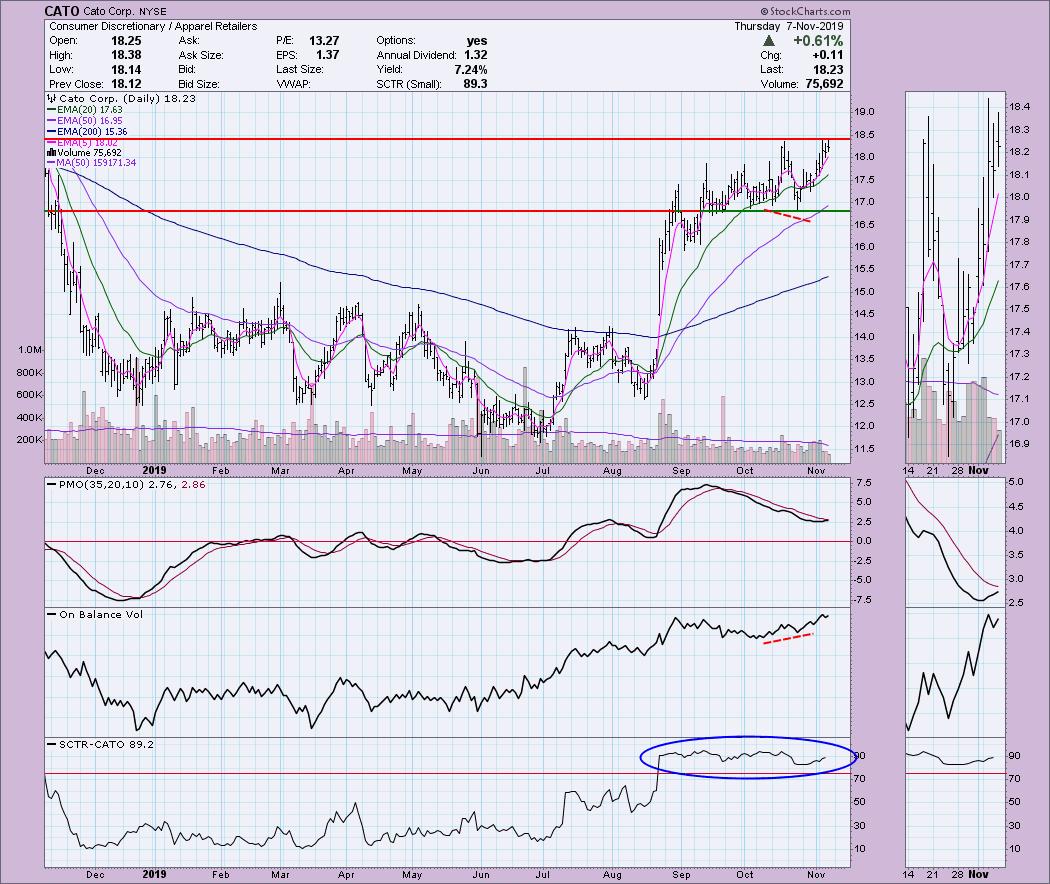
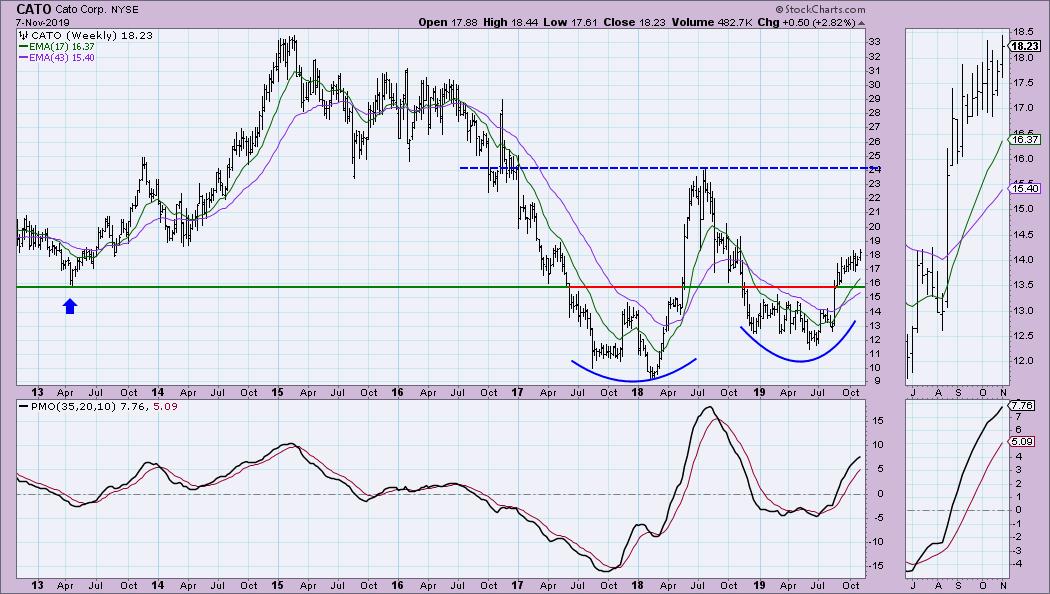
Cato Corp (CATO) - Earnings: 11/18 - 11/22/2019
CATO has also yet to break out, but the PMO is curling upward and is suggesting it could happen. The OBV had a nice positive divergence before this recent rally. The concern here is the need for a possible pullback. I'd like to see a breakout here before entering. The SCTR has been above 75 for months, which is positive. I'm expecting a breakout.
I don't see any serious overhead resistance on the weekly chart and, if anything, it appears to be forming a longer-term double-bottom formation. The PMO is rising and not overbought.
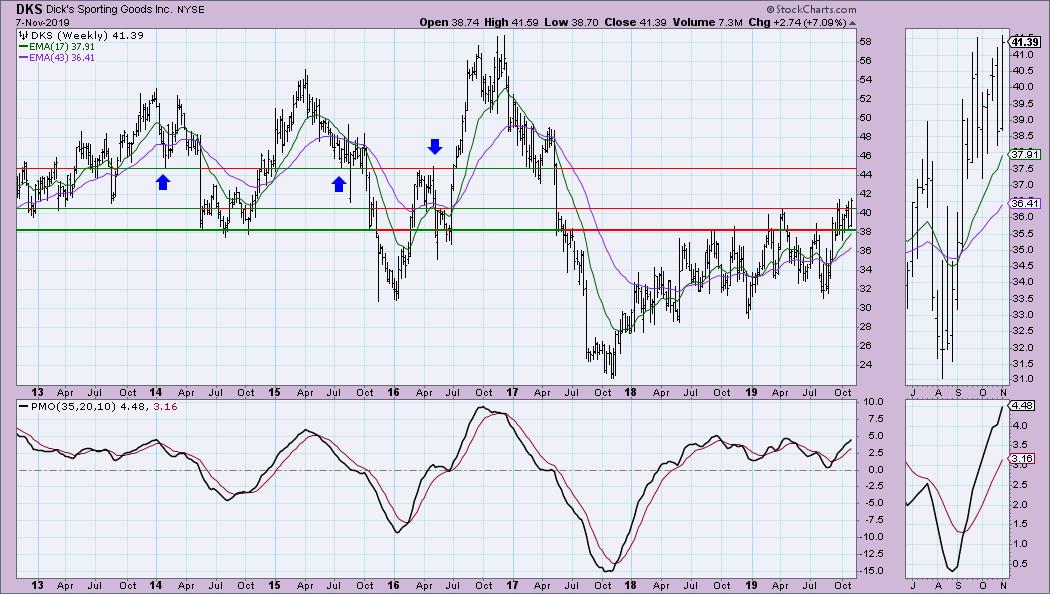
Dick's Sporting Goods (DKS) - Earnings: 11/26/2019
We see a breakout from a symmetrical triangle. These are continuation patterns; the expectation is a move higher. It has hit overhead resistance at the September high; I would like to see it break above. Seeing a pullback that holds that declining tops trend line would be acceptable and likely a potential entry point.
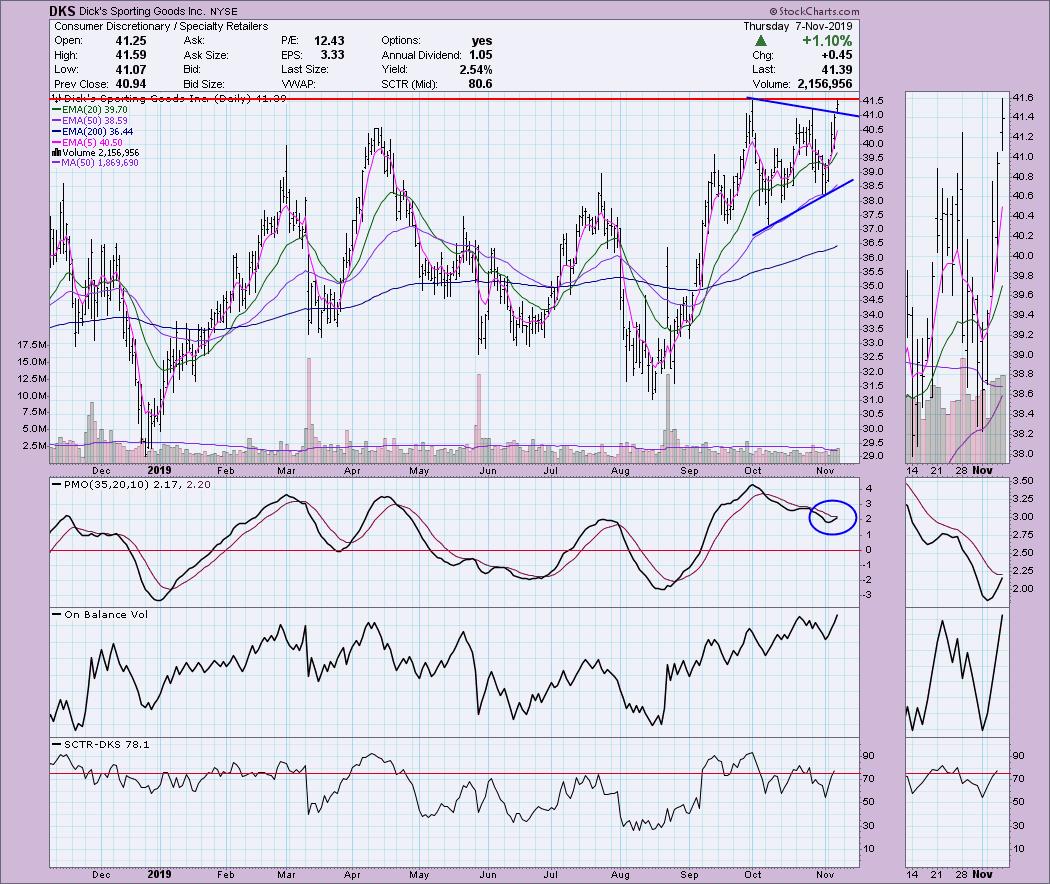
There are various levels of overhead resistance for DKS to contend with, but, given the current break above $40, I suspect we could see a move to $45.
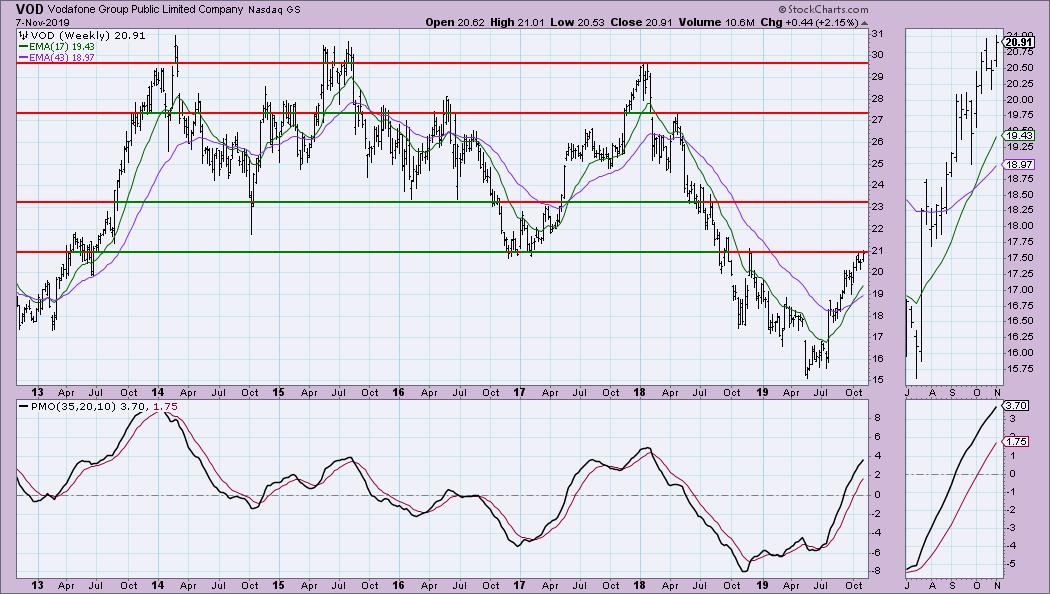
Vodaphone Group Public Limited Co (VOD) - Earnings: N/A
Another one that could use a breakout before entry, I don't want to see a double-top form here. The PMO is rising and suggests a breakout should arrive. The OBV is rising with price and the SCTR is healthy.
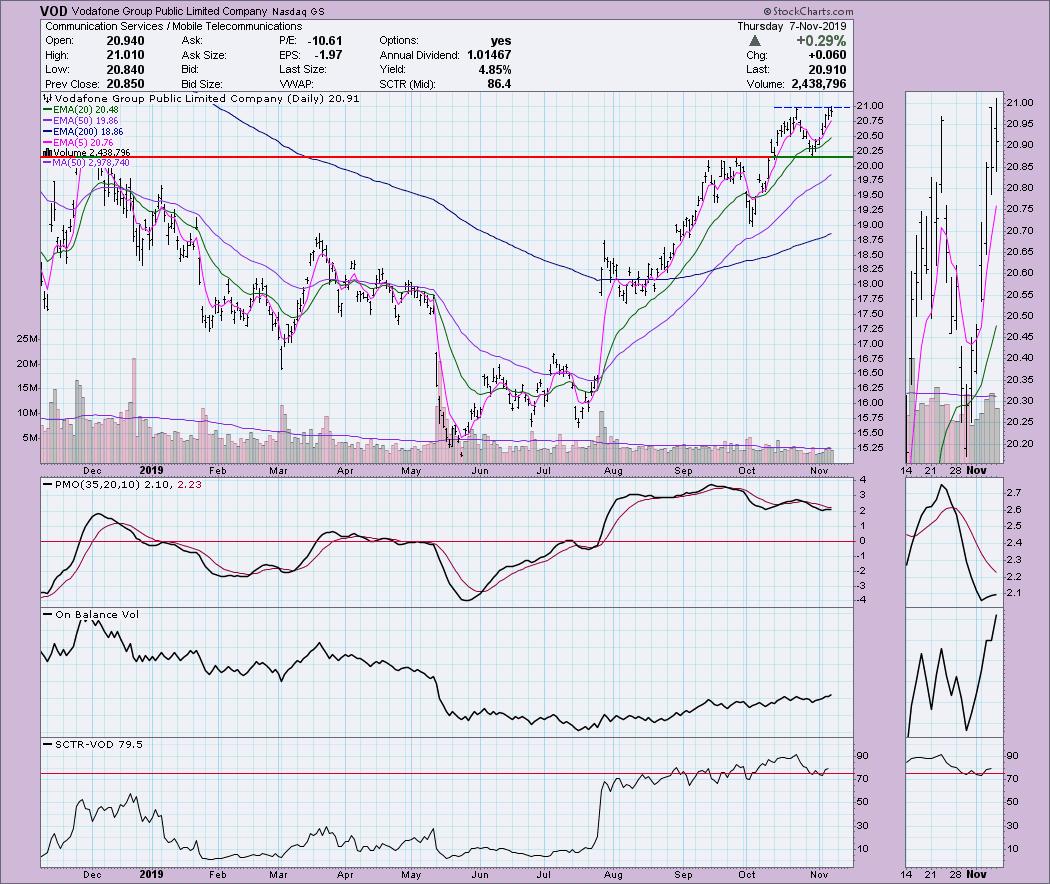
I don't foresee resistance on the weekly chart until it reaches $23, but it needs to overcome current overhead resistance at $21.
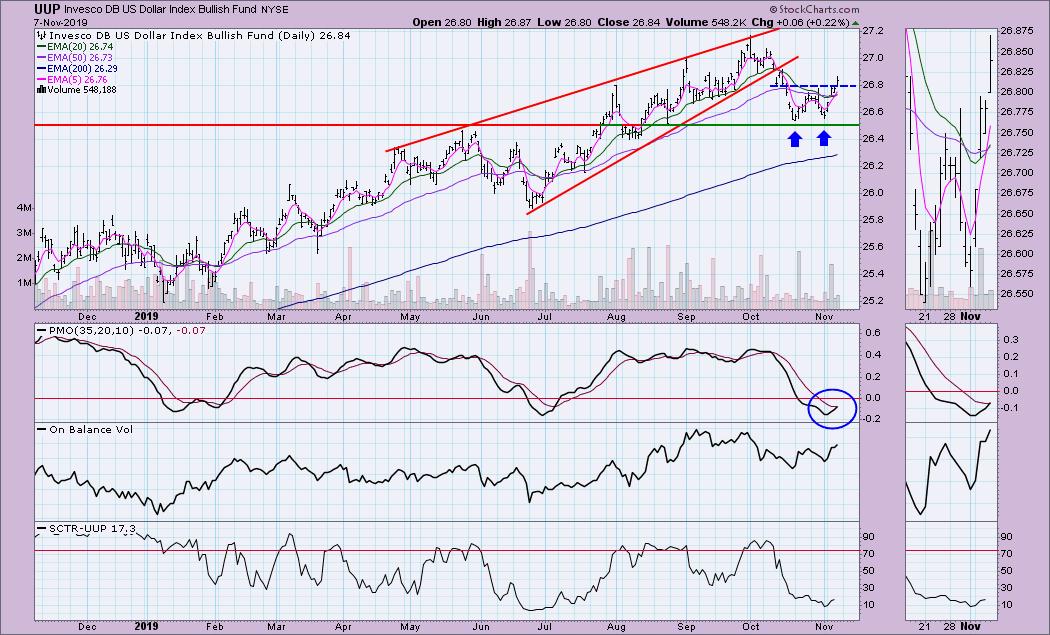
Invesco DB US Dollar Index Bullish Fund (UUP) - Earnings: N/A
The short-term double-bottom I saw yesterday has executed with today's breakout. The minimum upside target would align nicely with the September top. I will be looking to enter this position tomorrow. I like the PMO BUY signal that just arrived, as well as the Intermediate-Term Trend Model BUY signal that triggered today when the 20-EMA crossed above the 50-EMA. Notice the rising bottoms on the OBV that align with the bottoms of the double-bottom.
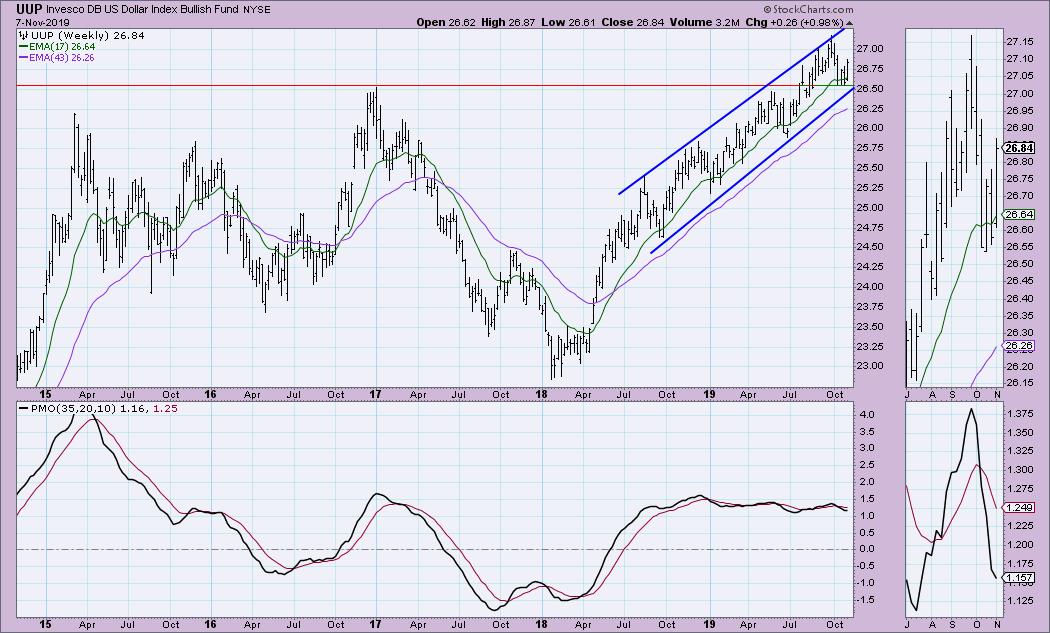
Based on the weekly chart, it appears the UUP will remain in an intermediate-term rising trend channel. The weekly PMO isn't optimum, but, since price has been rising steadily, you will see the PMO flatten. I like that it has held support this past month above the 2016 top.
Full Disclosure: I don't own any of these stocks presently, but will be looking to enter UUP after the market has been open a few hours; that way, I can have some "intel" before I purchase. As most of you know, if price action tomorrow on UUP looks unusual or suspect, I'll hold off. The market has been rallying, but I am still cautious, so I believe an entry into the Dollar right now fits my conservative strategy. I'm currently about 60% in cash.

Erin Swenlin will be presenting at the The MoneyShow Las Vegas May 11-13, 2020! You'll have an opportunity to meet Erin and discuss the latest DecisionPoint news and Diamond Scans. The conference is free to attend or view online!
Watch the latest episode of DecisionPoint with Carl & Erin Swenlin LIVE on Mondays 5:00p EST or on the StockCharts TV YouTube channel here!
Technical Analysis is a windsock, not a crystal ball.
Happy Charting!
- Erin
erinh@stockcharts.com
NOTE: The stocks reported herein are from mechanical trading model scans that are based upon moving average relationships, momentum and volume. DecisionPoint analysis is then applied to get five selections from the scans. The selections given should prompt readers to do a chart review using their own analysis process. This letter is not a call for a specific action to buy, sell or short any of the stocks provided. There are NO sure things or guaranteed returns on the daily selection of "diamonds in the rough."
Helpful DecisionPoint Links:
DecisionPoint Shared ChartList and DecisionPoint Chart Gallery
Price Momentum Oscillator (PMO)
Swenlin Trading Oscillators (STO-B and STO-V)
**Don't miss DecisionPoint Commentary! Add your email below to be notified of new updates"**


