When the market goes up, we normally expect new highs to expand and new lows to contract. So far this month, for Nasdaq Composite stocks, the opposite is happening, and that is a negative signat, at least for the short term. We should also note that an expansion of new lows against a rising price trend, as we saw in July, is negative by itself, but with weakening leaders (contracting new highs), it is a double whammy.

We can see similar divergences in the NYSE Composite Index.
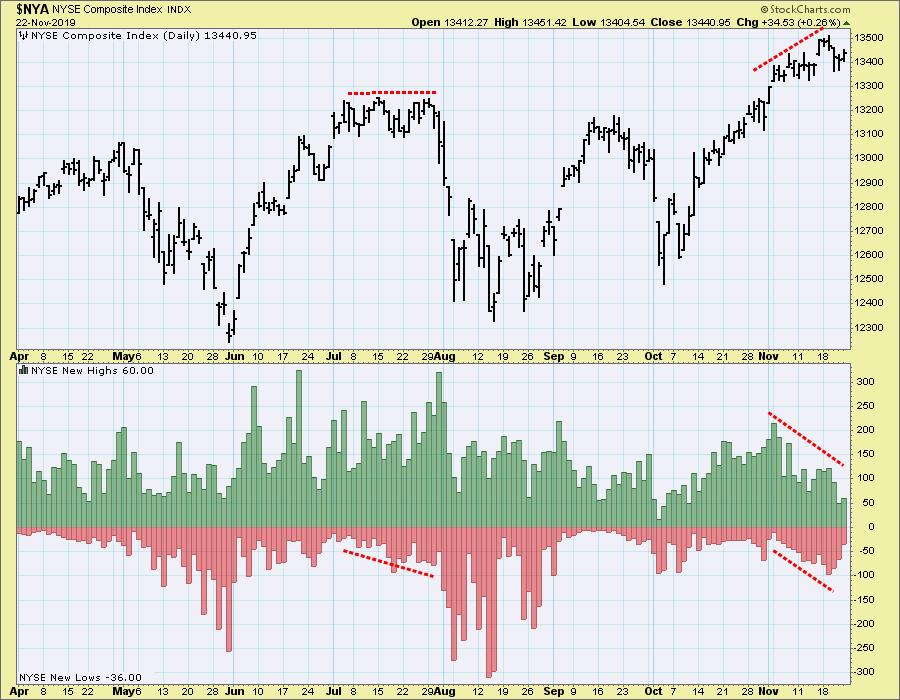
The large-cap indexes, like the S&P 500 Index, are not showing significant expansion of new lows; however, new highs contracting against a price advance are also an effective warning flag.
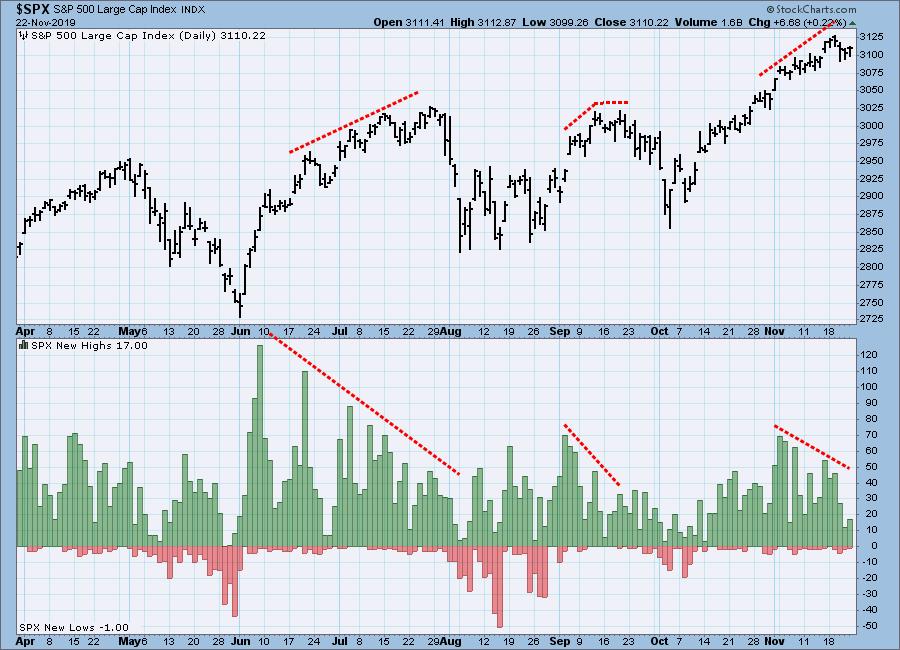
Conclusion: New highs and new lows should expand or contract in logical concert with their price index. When they don't, watch out.
The DecisionPoint Weekly Wrap presents an end-of-week assessment of the trend and condition of the stock market (S&P 500), the U.S. Dollar, Gold, Crude Oil, and Bonds.
Watch the latest episode of DecisionPoint on StockCharts TV's YouTube channel here!
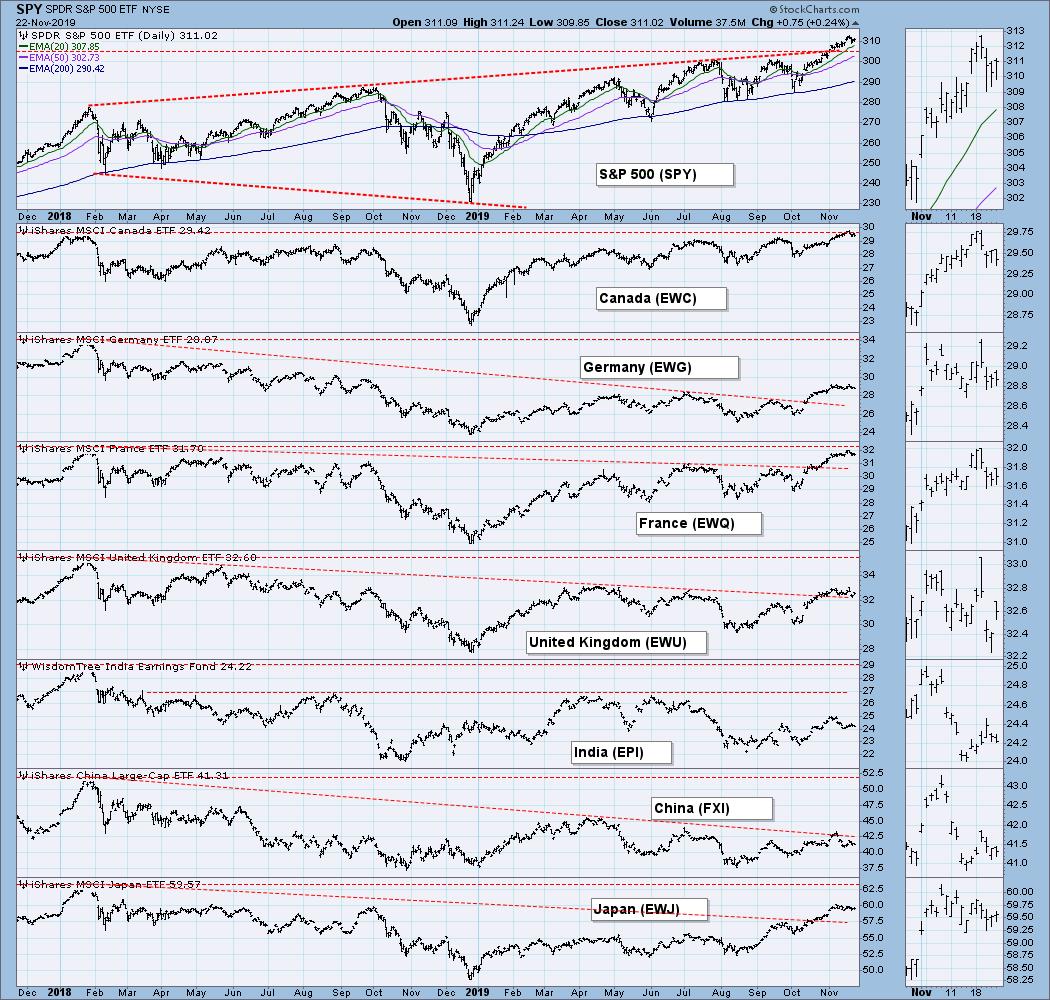
GLOBAL MARKETS
Most global market indexes are far behind the U.S. market.
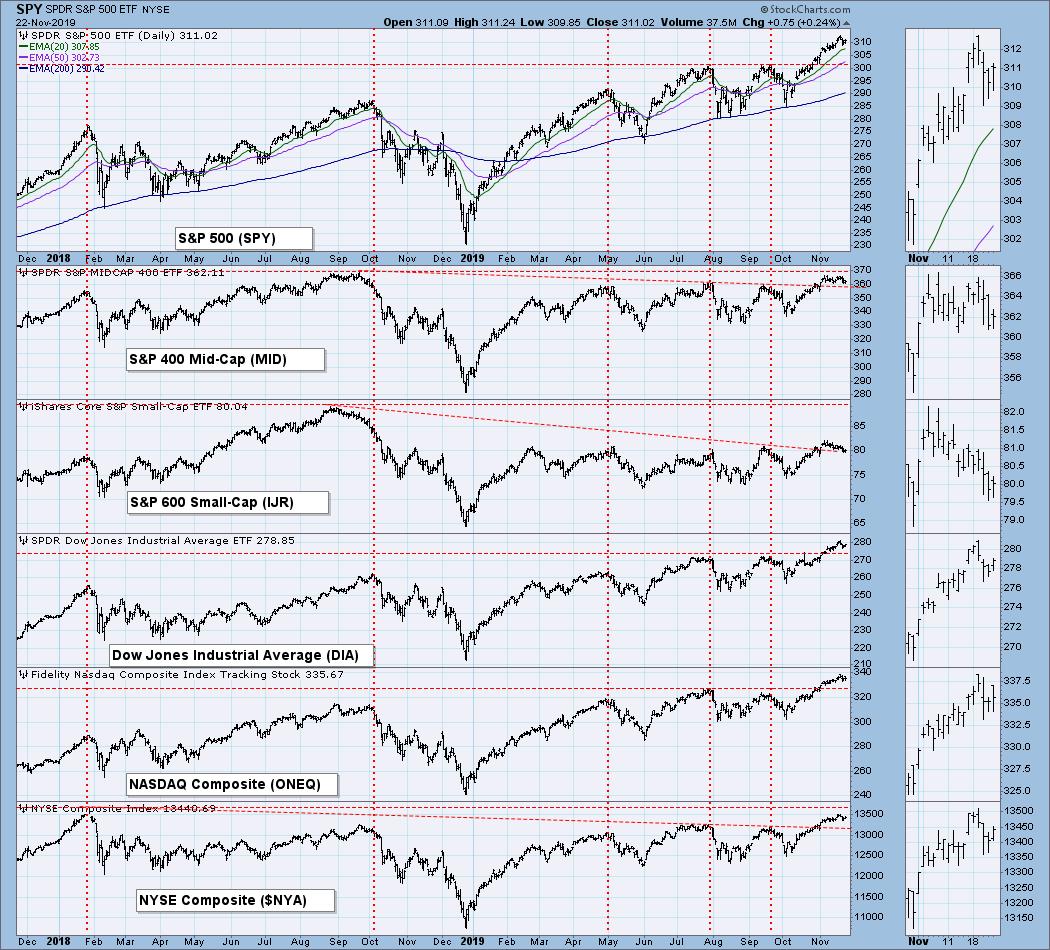
BROAD MARKET INDEXES
Large-cap indexes continue to lead.
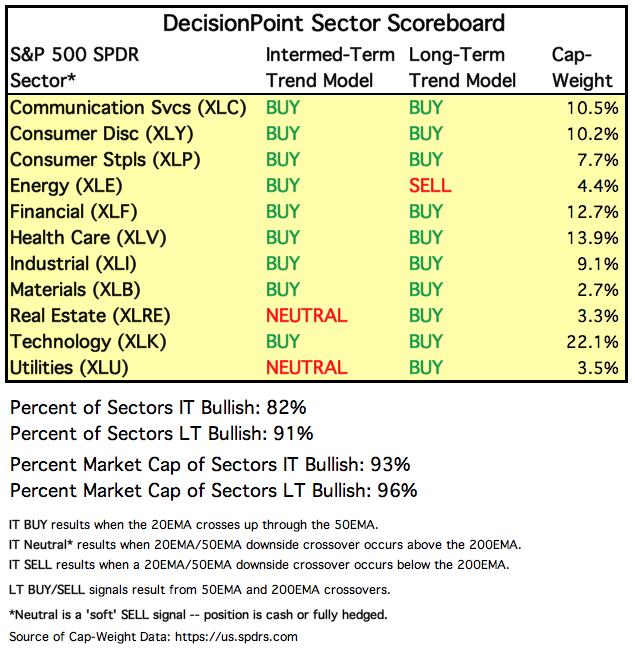
SECTORS
Each S&P 500 Index component stock is assigned to one, and only one, of 11 major sectors. This is a snapshot of the Intermediate-Term and Long-Term Trend Model signal status for those sectors.
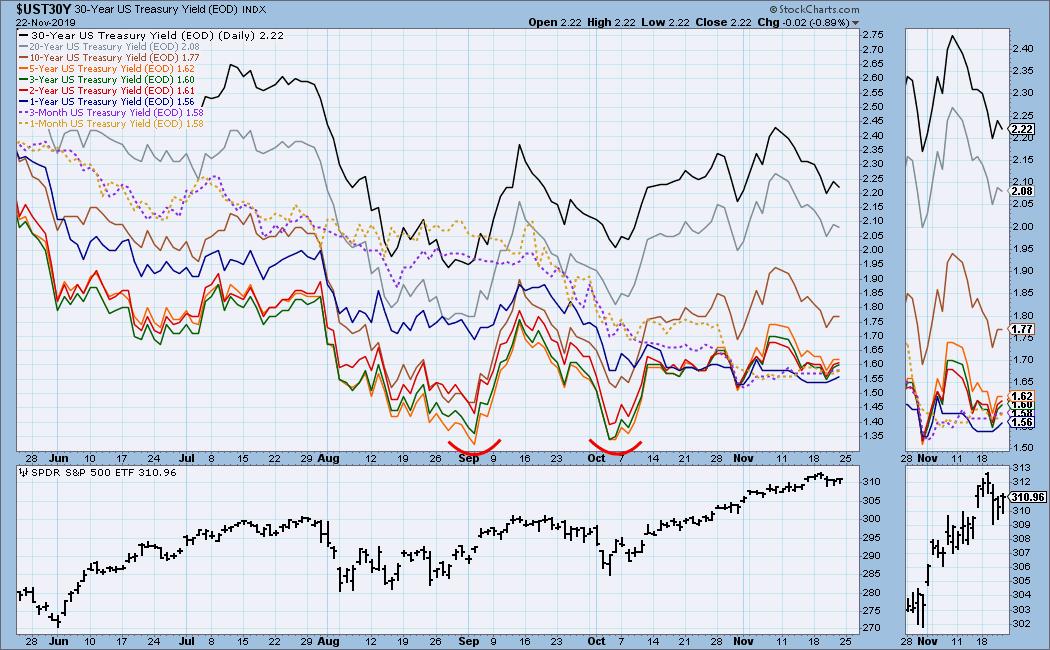
INTEREST RATES
This chart is included so we can monitor rate inversions. In normal circumstances the longer money is borrowed the higher the interest rate that must be paid. When rates are inverted, the reverse is true. Currently, rates are compressed, and minor twitching can result in inversions among the shorter duration insturments.
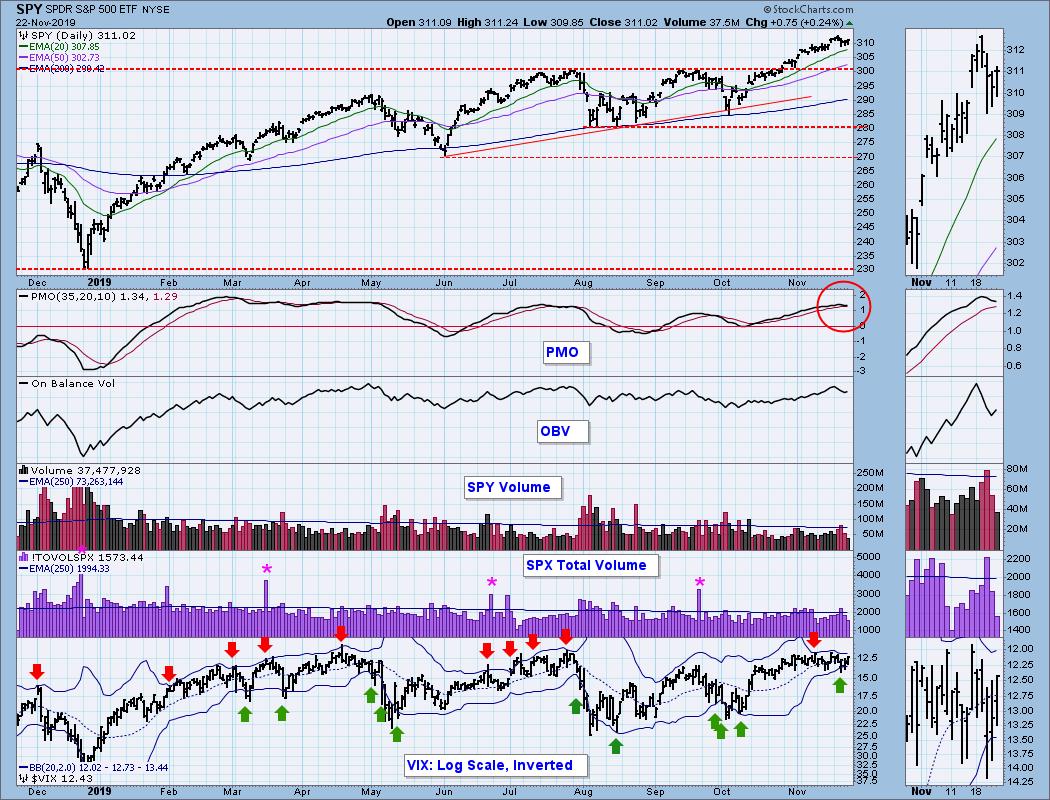
STOCKS
IT Trend Model: BUY as of 9/6/2019
LT Trend Model: BUY as of 2/26/2019
SPY Daily Chart: It appears that SPY is topping again. The PMO is somewhat overbought and falling, and the VIX is being squeezed by the tightest band structure this year.
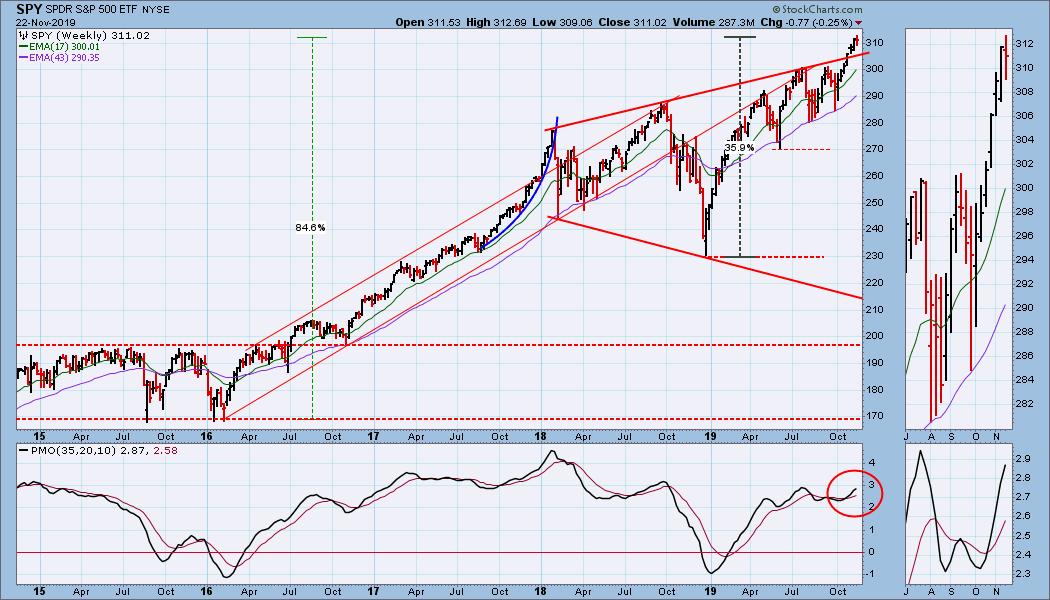
SPY Weekly Chart: The business channel headline says this week a six-week advance was "snapped." Kind of dramatic for a weekly loss of less than one percent.
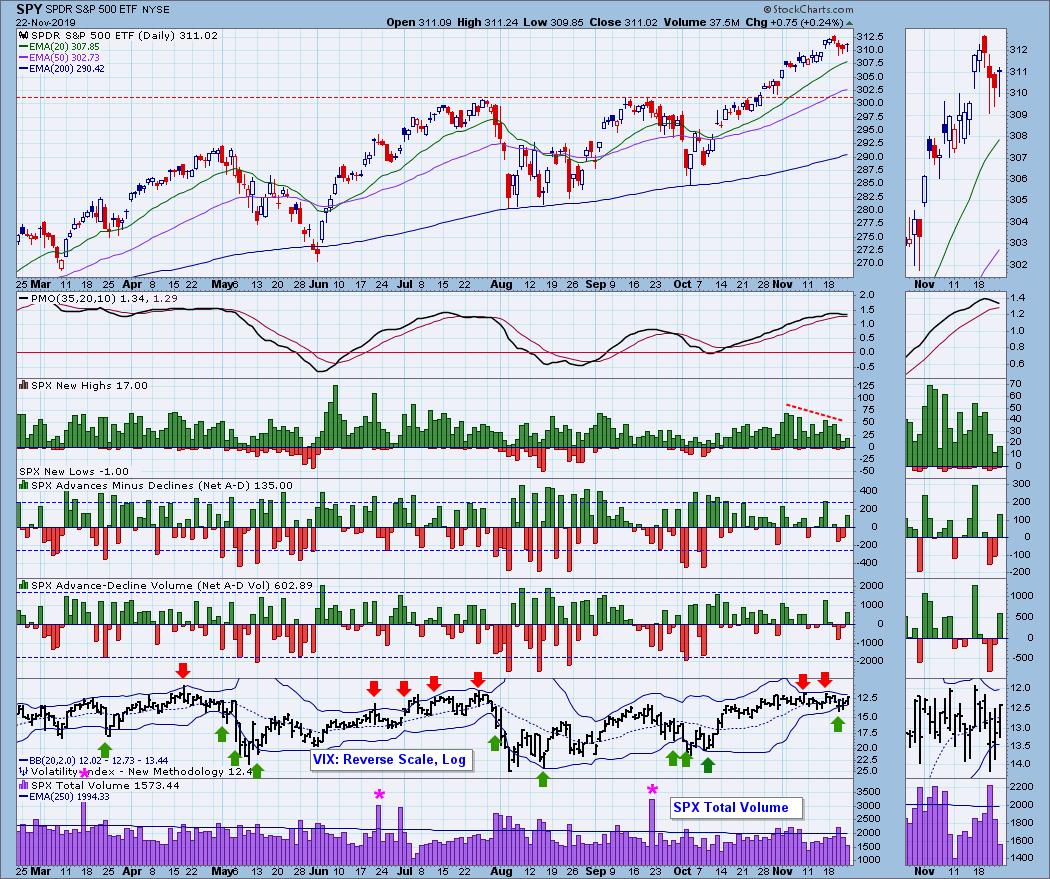
Climactic Market Indicators: No climactic activity this week, but tight Bollinger Bands and fading new highs catch my eye.
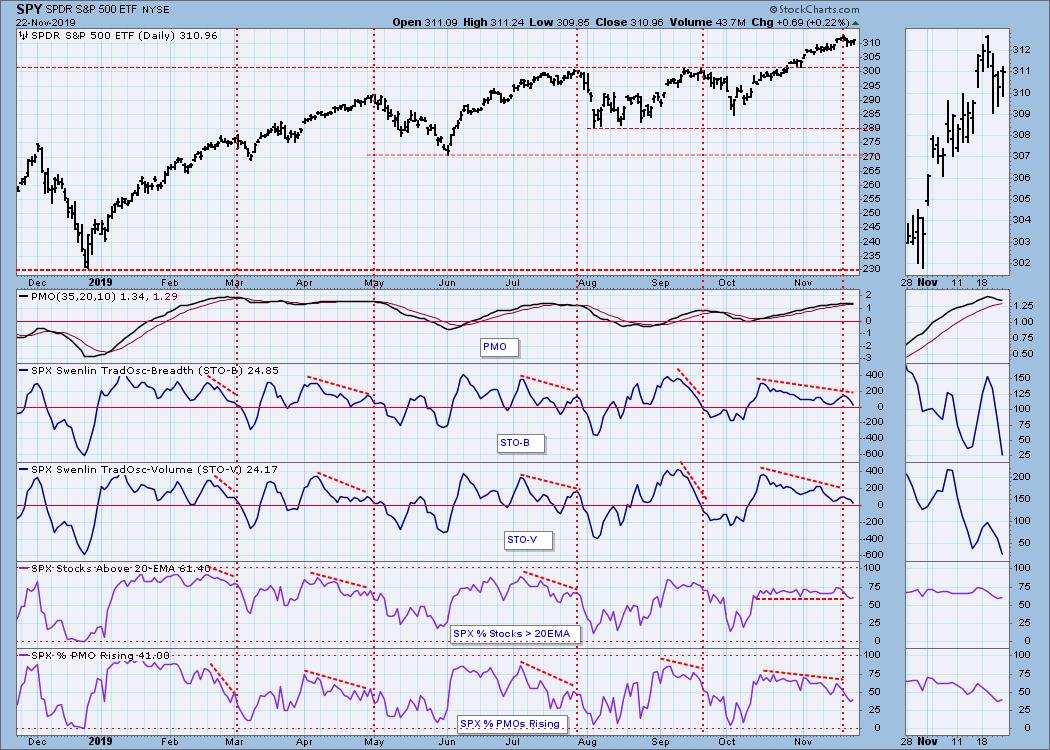
Short-Term Market Indicators: There has been fading upward pressure, but no significant downward pressure, so price has been able to move higher.
Intermediate-Term Market Indicators: I'm adding the Golden Cross and Silver Cross Indexes to this section. We can see gradually increasing strength in the Golden Cross Index since May. The Silver Cross Index has been gradually losing strength during that same period, but at 71% there is adequate participation to support current price levels, despite the negative divergence.
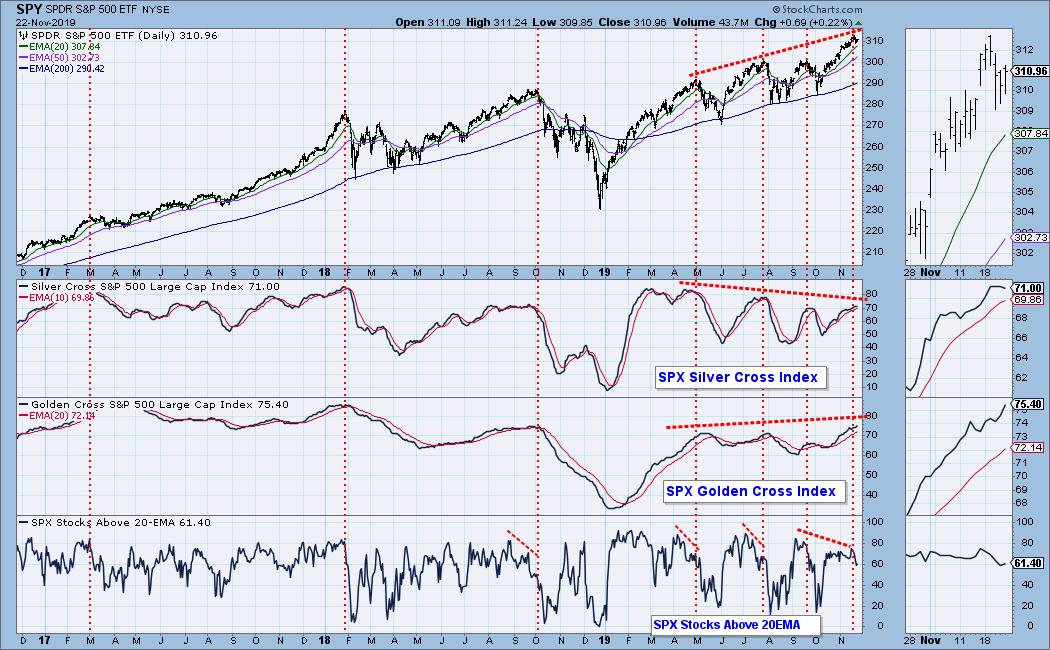
An abundance of negative divergences still errodes our confidence.
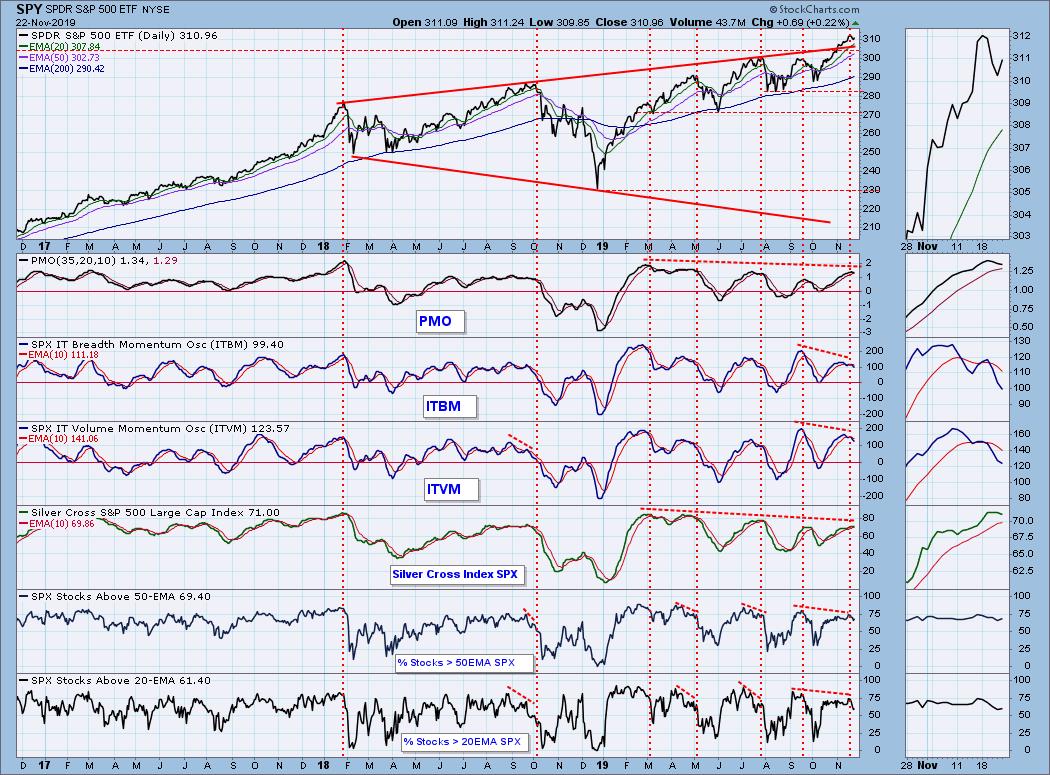
CONCLUSION: The trend is up, but internals are overbought. Many indicators have gotten progressively weaker since the peaks they reached after the initiation thrust off the 2018 price lows. Each successive internal top is lower than the one before it, but negative divergences don't always deliver the implied subsequent price weakness. The Silver Cross Index tells us that 71% of S&P 500 stocks are still on IT Trend Model BUY signals, and that is more than sufficient participation to maintain the rising price trend. Considering the stubbornness of the advance, I would not be surprised if it continued well into December; however, the intermediate-term indicators above have all topped, and a short pullback of 5-7% is more likely that a continued rally.
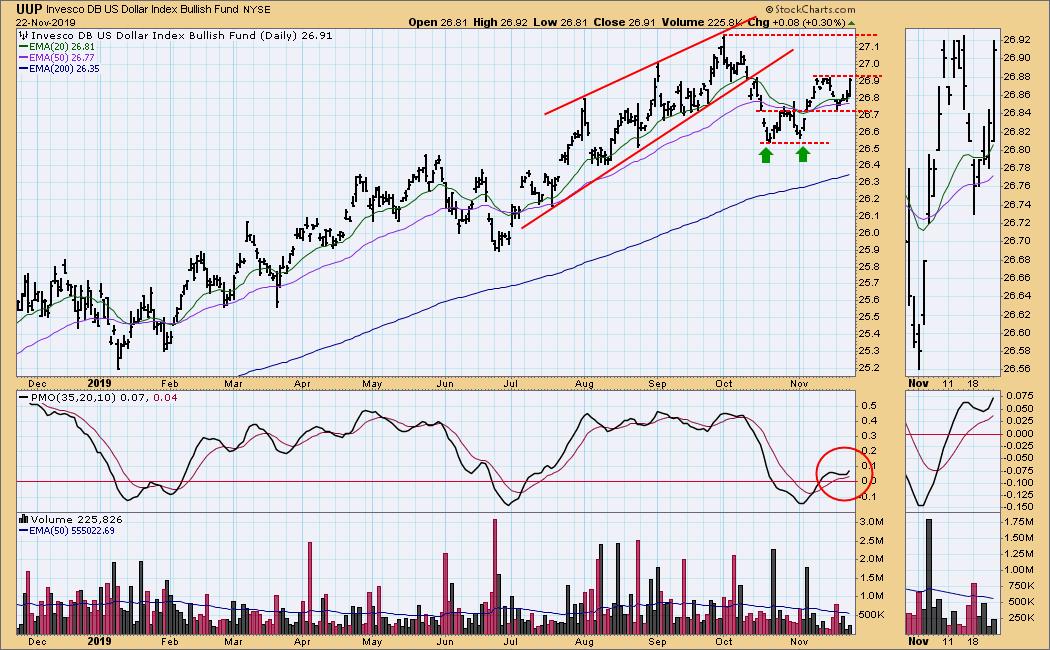
DOLLAR (UUP)
IT Trend Model: BUY as of 11/7/2019
LT Trend Model: BUY as of 5/25/2018
UUP Daily Chart: The daily PMO has bottomed above the signal line, a very bullish sign, but the October top presents important resistance.
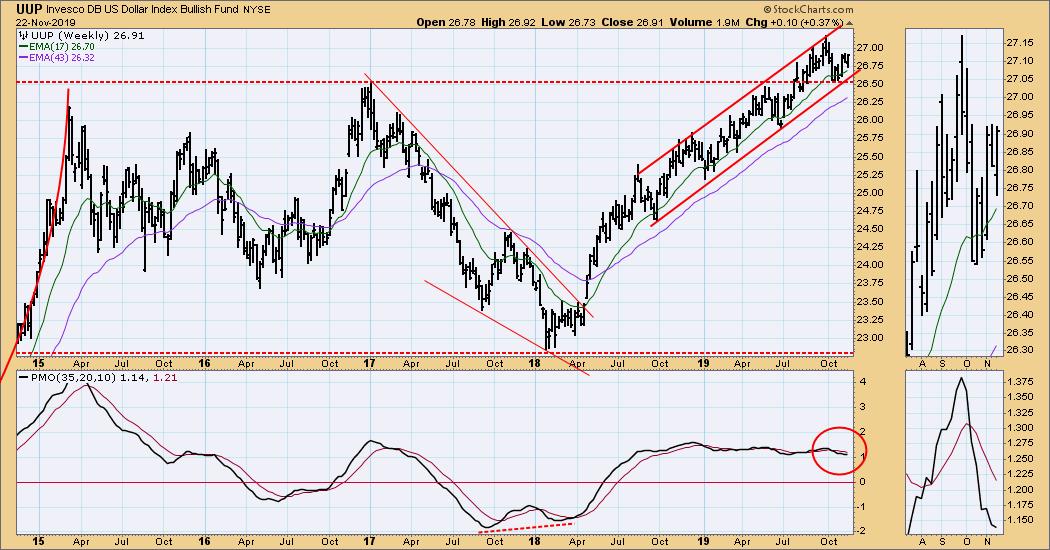
UUP Weekly Chart: The advance needs to reach the top of the rising trend channel before it drops back to the rising trend line. Failure to do so would probably result in a trend break.
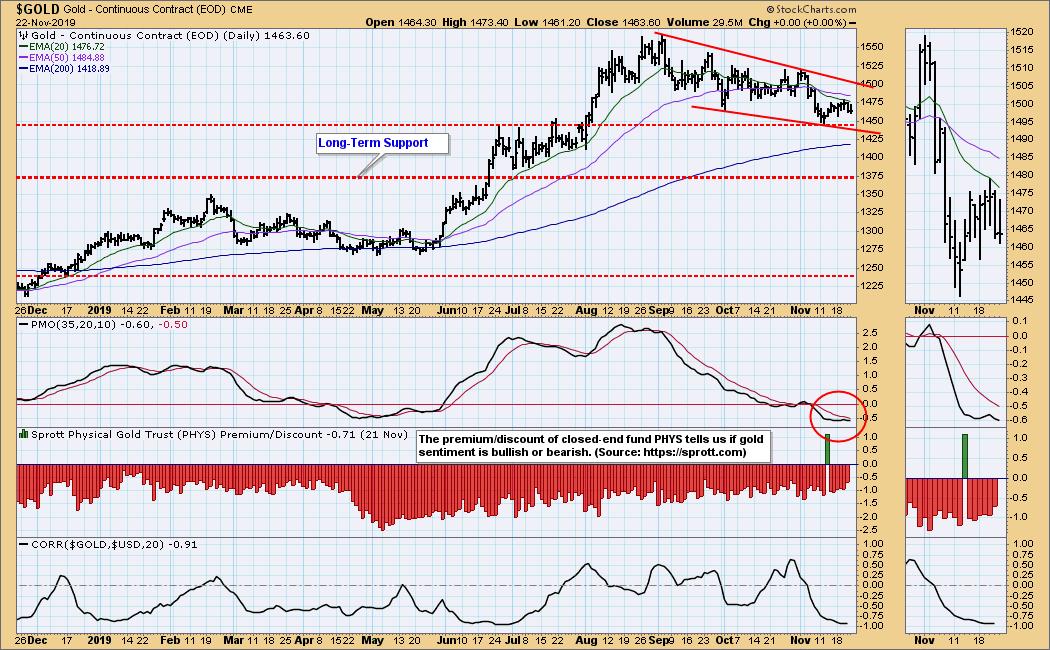
GOLD
IT Trend Model: NEUTRAL as of 11/8/2019
LT Trend Model: BUY as of 1/8/2019
GOLD Daily Chart: A bullish falling wedge has formed, but it is not a very tight one. Here is another situation where a failure to reach the top of the channel before turning back down will probably result in a breakdown.
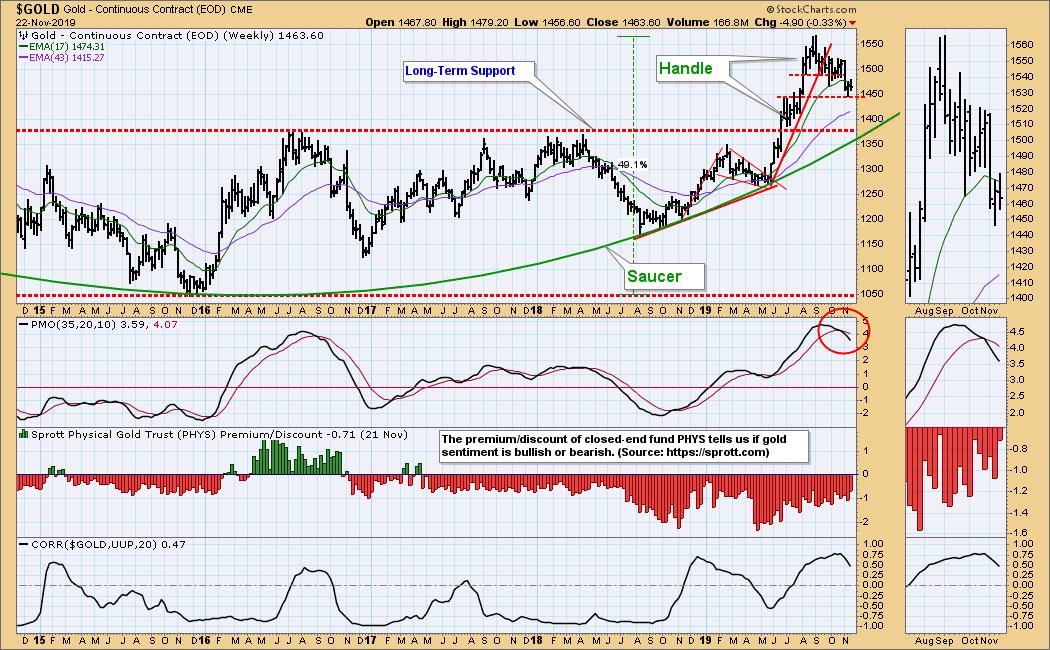
GOLD Weekly Chart: The weekly PMO implies that the decline will continue. I view the 1375 level to be critical support.
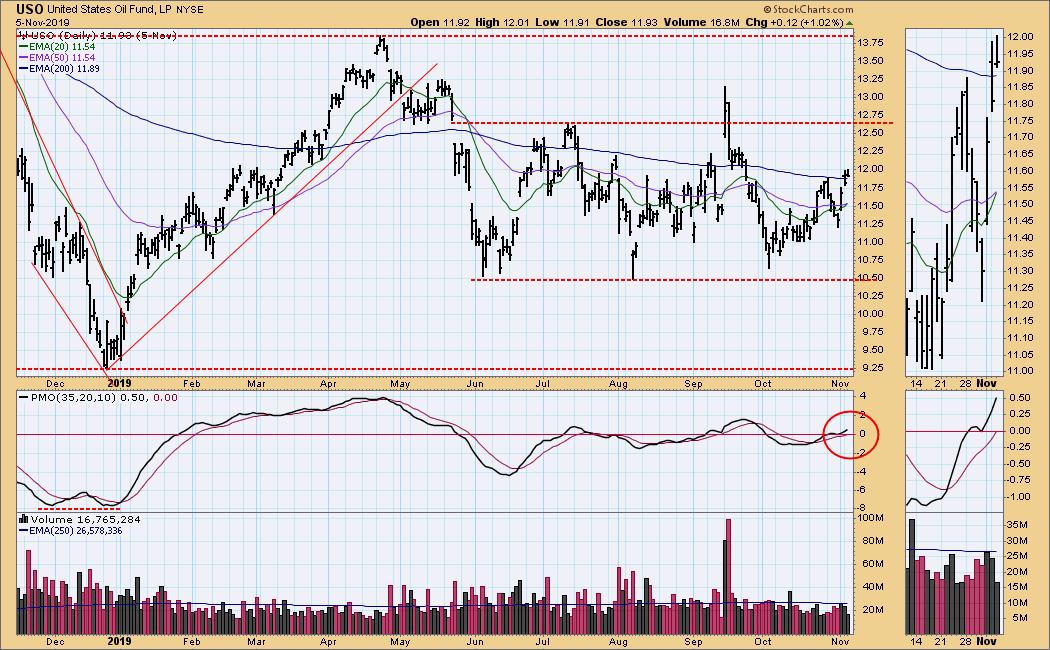
CRUDE OIL (USO)
IT Trend Model: BUY as of 11/5/2019
LT Trend Model: BUY as of 11/22/2019
USO Daily Chart: On Friday the 20EMA advanced to equal the 50EMA, so the IT Trend Model changed from SELL to BUY. The EMAs being equal doesn't constitute an upside crossover, but the crossover will complete on Monday unless price drops below the 2oEMA and 50EMA. That seems unlikely.
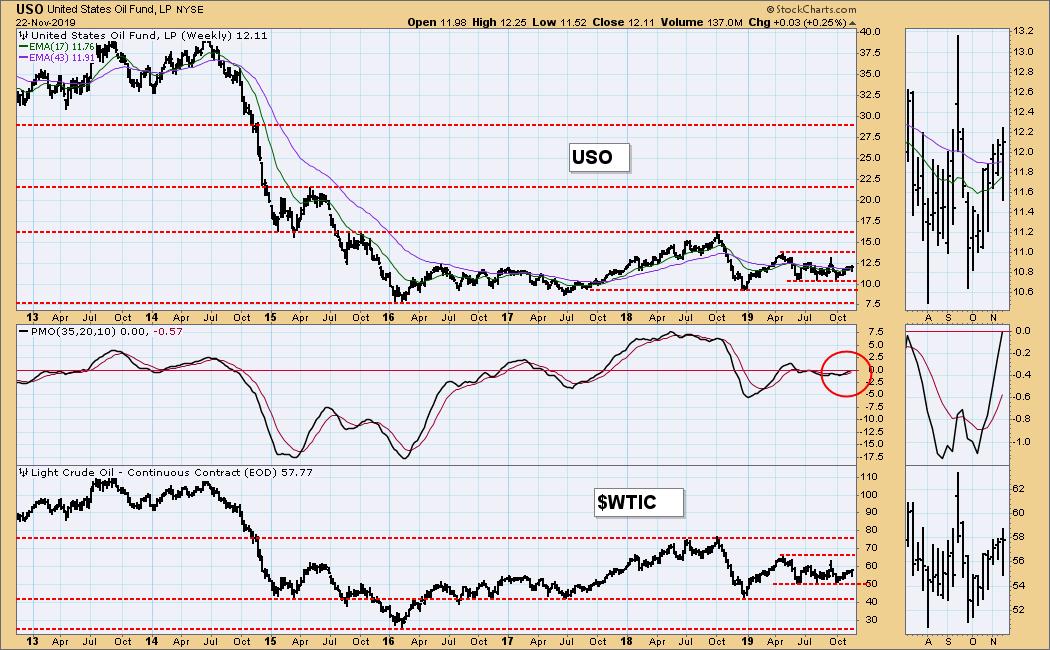
USO Weekly Chart: Until there is some major news, I expect that WTIC will remain within a range between 50.60 and 61.00, with USO maintaining a comparable range.
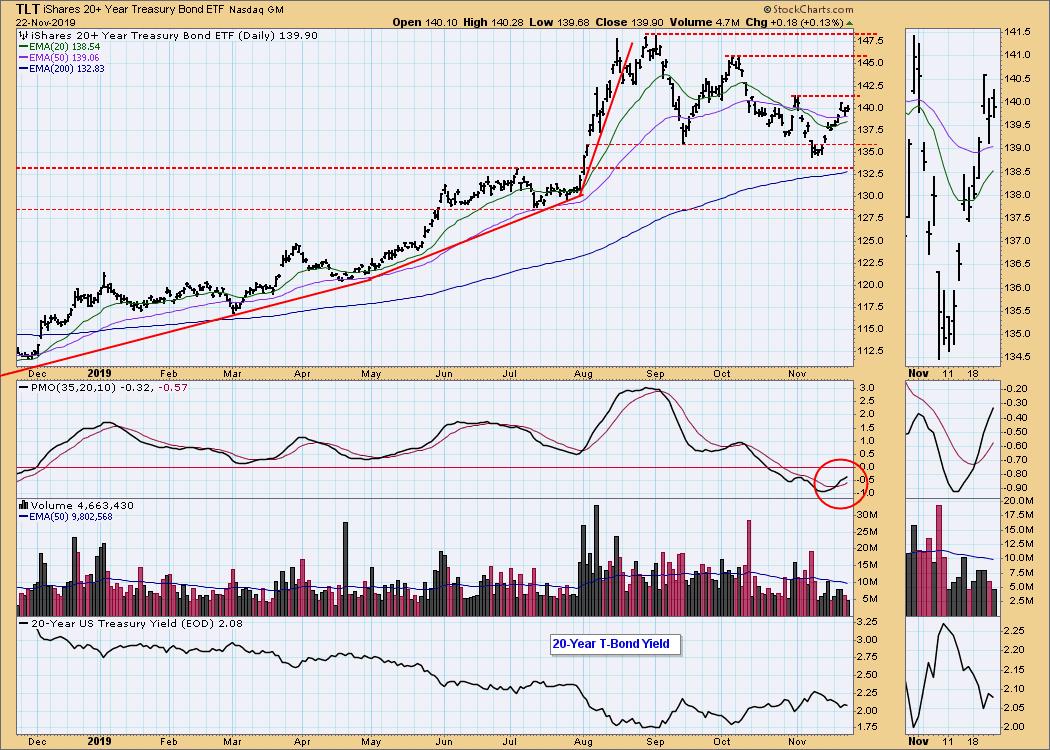
BONDS (TLT)
IT Trend Model: NEUTRAL as of 10/28/2019
LT Trend Model: BUY as of 1/2/2019
TLT Daily Chart: I don't get a sense that TLT is going to do anything significant until the Fed makes another rate change.
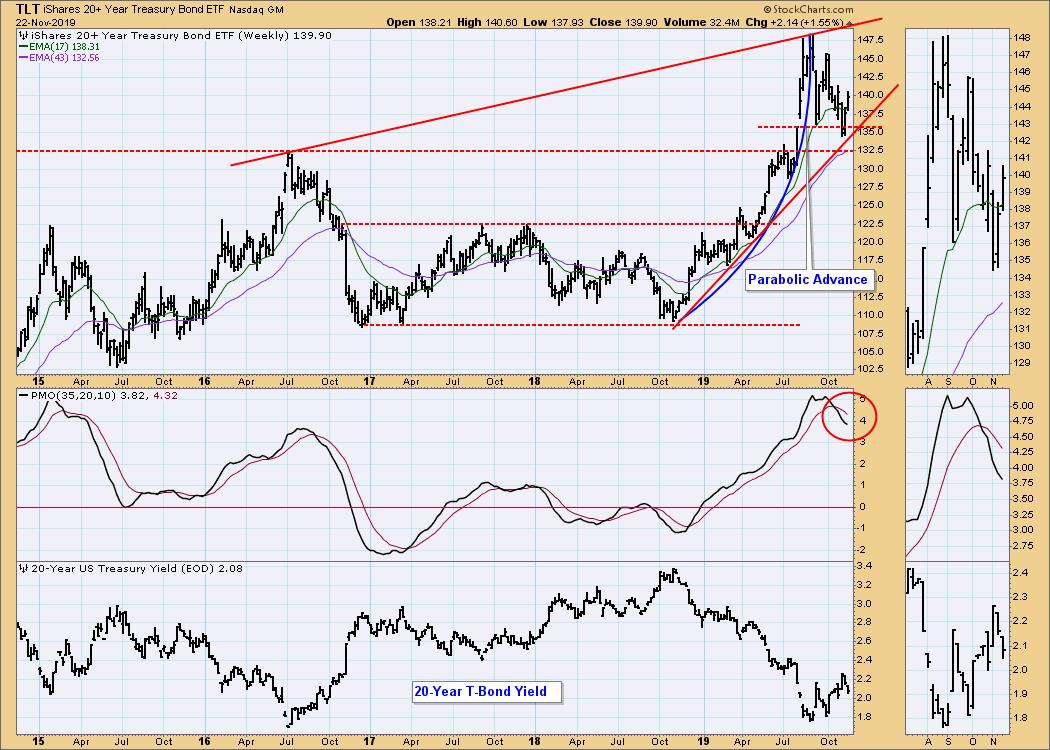
TLT Weekly Chart: I have drawn a line across the 2016 and 2019 tops, which represents the top of a rising trend channel seen more clearly on the monthly chart. In this time frame the lind is the top of a rising wedge pattern, which implies a downside resolution.
**Don't miss any of the DecisionPoint commentaries! Go to the "Notify Me" box toward the end of this blog page to be notified as soon as they are published.**
Technical Analysis is a windsock, not a crystal ball.
Happy Charting! - Carl
NOTE: The signal status reported herein is based upon mechanical trading model signals, specifically, the DecisionPoint Trend Model. They define the implied bias of the price index based upon moving average relationships, but they do not necessarily call for a specific action. They are information flags that should prompt chart review. Further, they do not call for continuous buying or selling during the life of the signal. For example, a BUY signal will probably (but not necessarily) return the best results if action is taken soon after the signal is generated. Additional opportunities for buying may be found as price zigzags higher, but the trader must look for optimum entry points. Conversely, exit points to preserve gains (or minimize losses) may be evident before the model mechanically closes the signal.
Helpful DecisionPoint Links:
DecisionPoint Shared ChartList and DecisionPoint Chart Gallery
Price Momentum Oscillator (PMO)
Swenlin Trading Oscillators (STO-B and STO-V)


