
I am finding that I get "repeats" in my scan results of stocks that I've already presented to you in recent Diamond Reports. For example, Microsoft (MSFT) and Deckers Outdoor (DECK) have found their way into today's results, but I wrote about each within the past few weeks. I will continue to provide five selections but, occasionally, I will throw in a previous selection if I believe it bears repeating. To that end, I am including DECK today. I entered it this week, so I'll show you why.
I love to get your feedback on DP commentary, so shoot me an email at erinh@stockcharts.com. I read every one of them and try to answer them all! Your insight helps me to tailor my commentary to what my readers and viewers want to hear about.
Welcome to "DecisionPoint Daily Diamonds," a newsletter in which I highlight five "diamonds in the rough" taken from the results of one of my DecisionPoint scans. Remember, these are not recommendations to buy or sell, but simply stocks that I found interesting. The objective is to save you the work of the initial, tedious culling process, but you need to apply your own analysis to see if these stocks pique your interest as well. There are no guaranteed winners here!
Current Market Outlook:
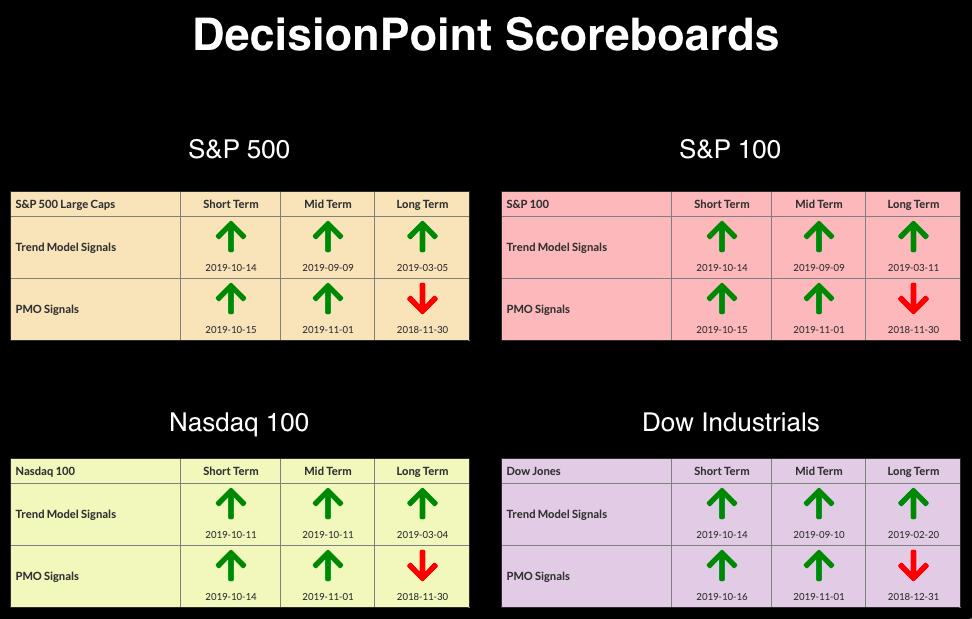
Market Trend: Currently, we have Trend Model BUY signals in all three timeframes on the DP Scoreboard Indexes.
Market Condition: The market is overbought, with Price Momentum Oscillator (PMO) BUY signals on the DP Scoreboards. Remember, overbought conditions can persist in a bull market.
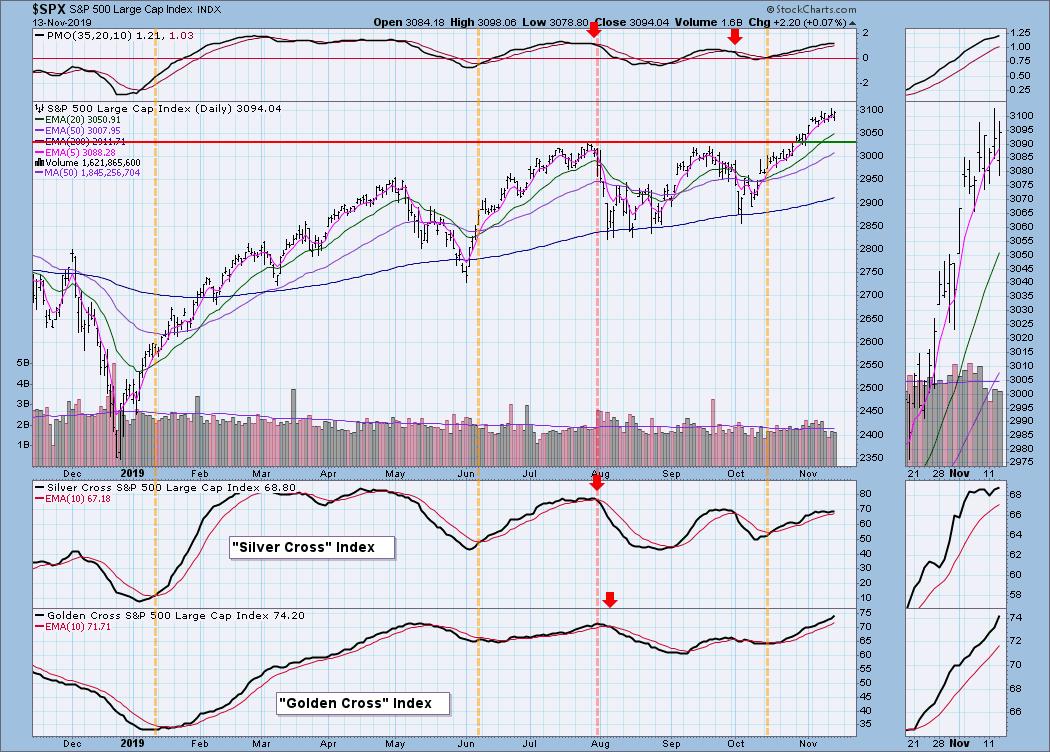
Market Environment: It is important to consider the odds for success. Here are the current percentages on the Silver and Golden Cross Indexes:
Diamond Index:
- Diamond Scan Results: 2
- Diamond Dog Scan Results: 25
- Diamond Bull/Bear Ratio: 0.08
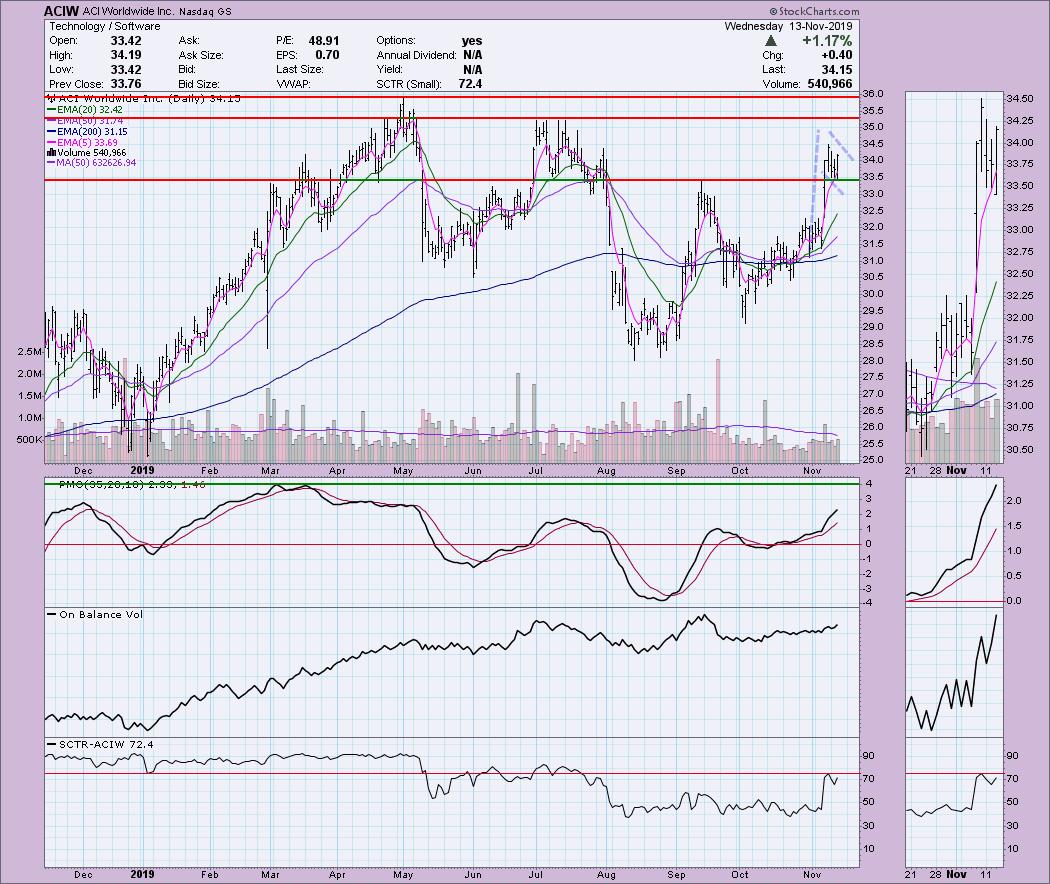
ACI Worldwide Inc (ACIW) - Earnings: 11/7/2019
The breakout above the September top happened last week on earnings. Since then, it has consolidated or paused. I like that we saw a pullback toward that breakout point and that it held at that support level. This price action is forming a bull flag formation, which suggests an upside breakout and a move the height of the flagpole. The PMO is somewhat overbought, but rising. We've seen higher readings on the PMO, so I believe it can accommodate more upside. Last month, all three Trend Models triggered BUY signals, so the moving averages are now lined up bullishly.
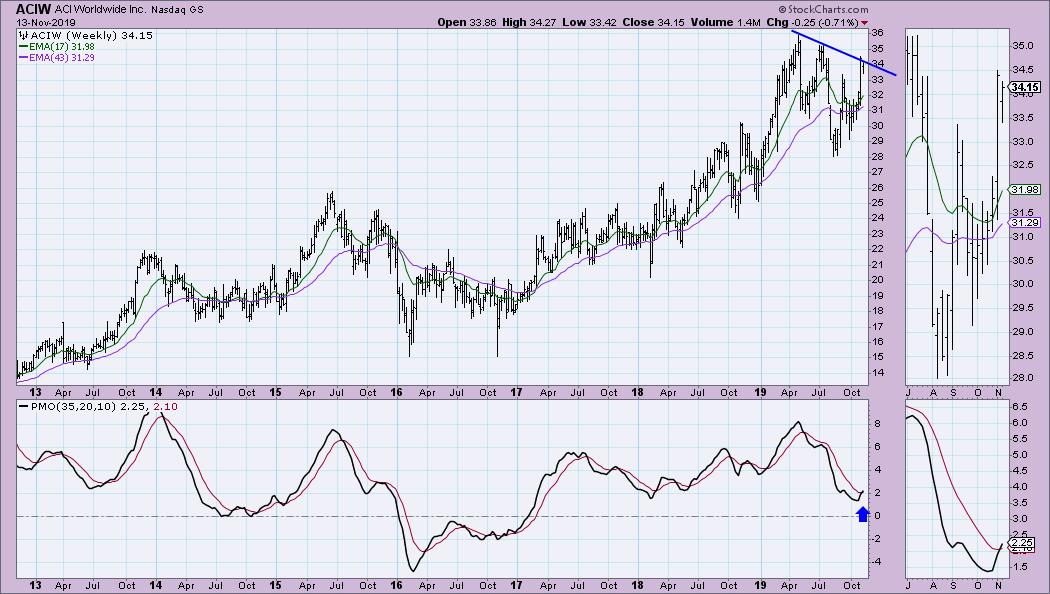
I'd like to see a better breakout from the declining trend on the weekly chart, but, given the new PMO BUY signal, I'm looking a breakout and a move to challenge all-time highs.
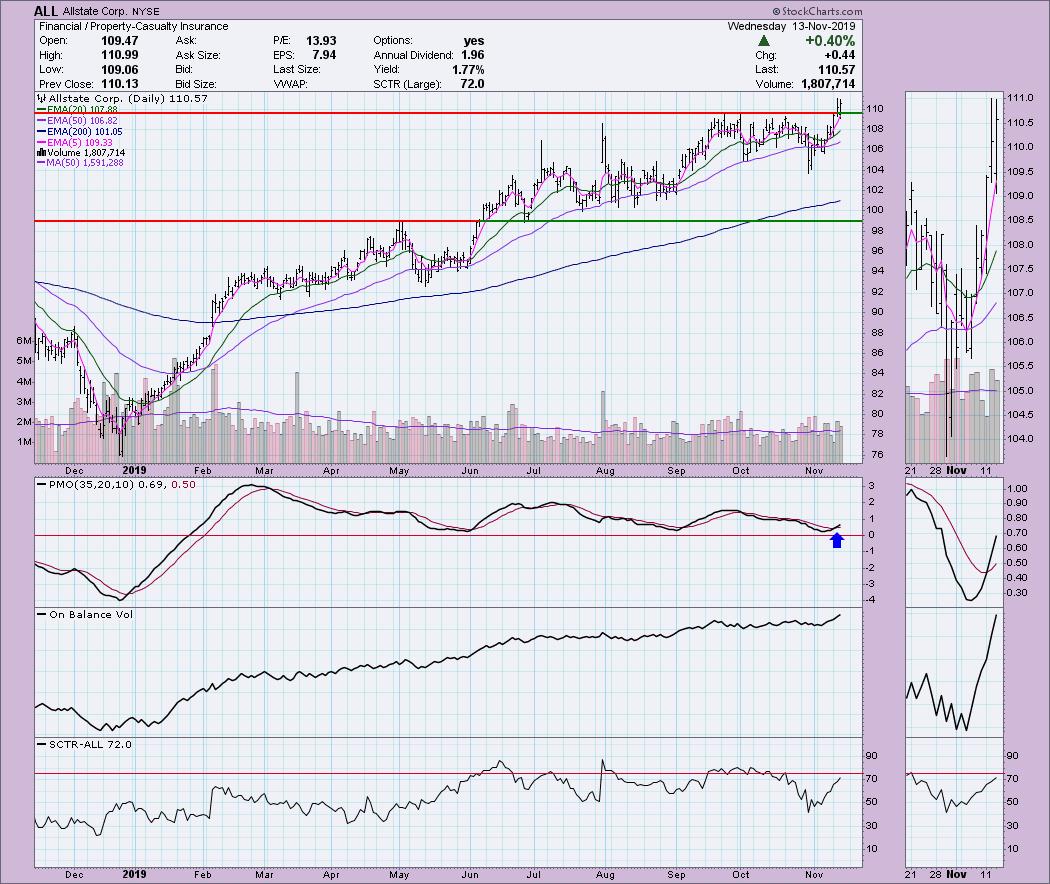
Allstate Corp (ALL) - Earnings: 2/4/2020
The insurance industry group has been making a move. I like Allstate on this recent breakout. Support is being held at previous resistance. The PMO just triggered a BUY signal and the OBV is confirming the current price breakout. The SCTR is headed for the hot zone above 75.
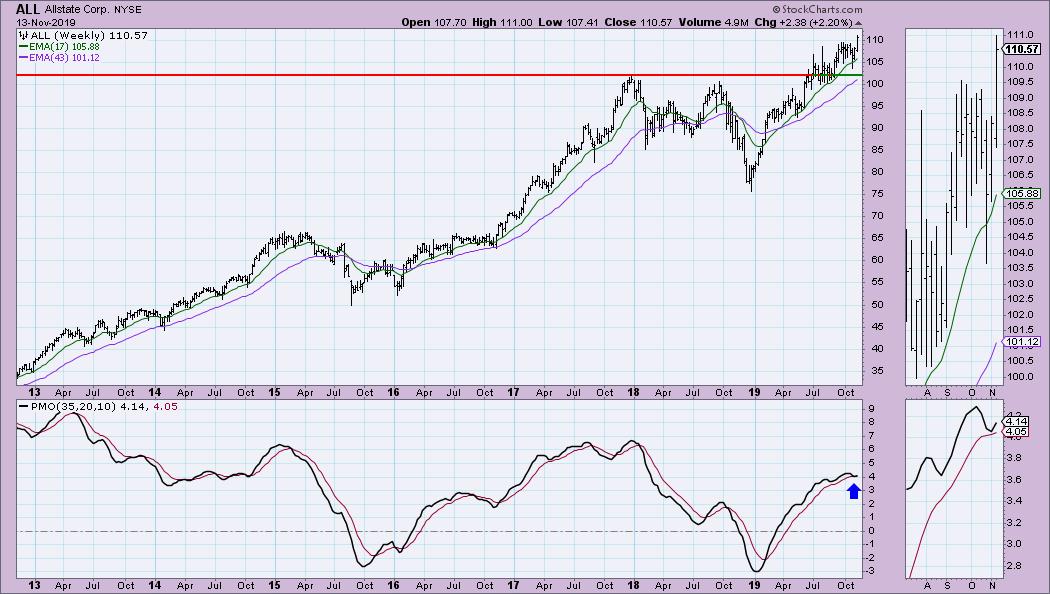
The weekly PMO is a bit suspect, but right now we are showing a weekly PMO bottom above the signal line, which is very encouraging.
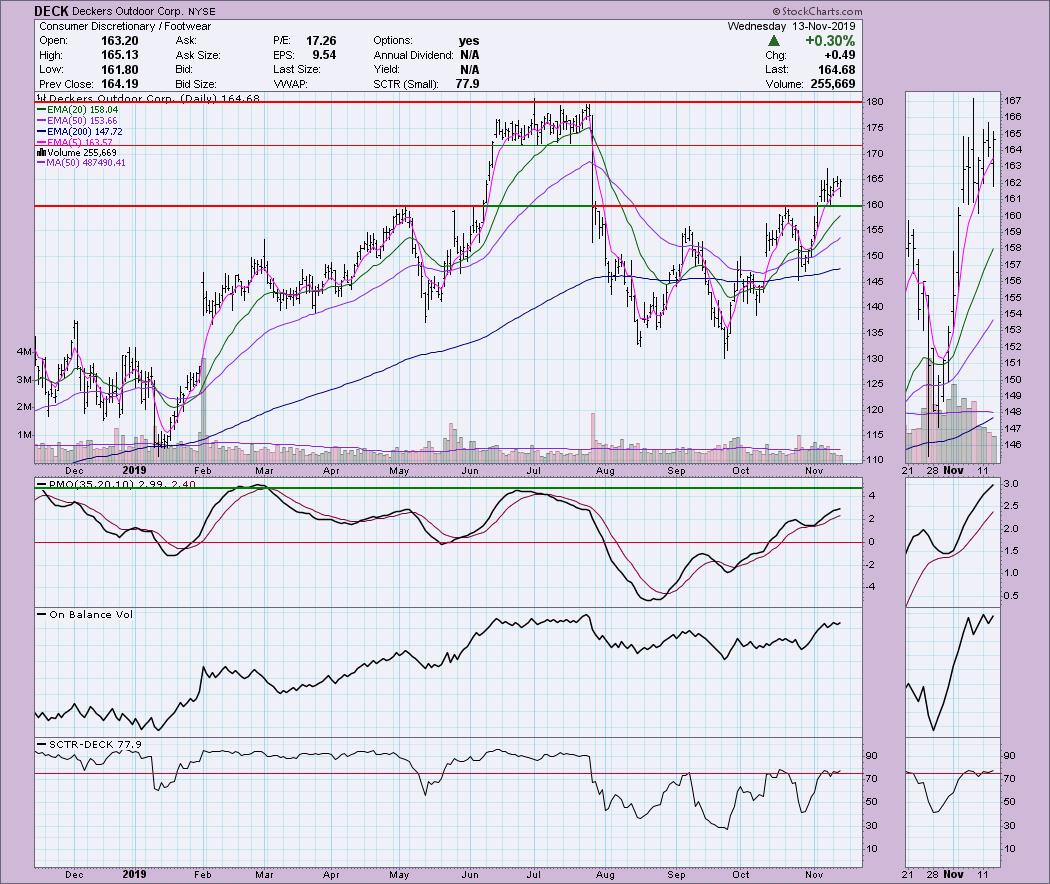
Deckers Outdoor Corp (DECK) - Earnings: 1/29 - 2/3/2020
I did mention yesterday that I purchased a position in DECK. I'm not ginning up excitement here; I only want to share my thoughts on why I jumped into this stock. I am still enamored of the recent breakout and subsequently seeing price hold that breakout area as new support. The upside potential is great as overhead resistance doesn't arrive until the lows from June/July are reached. I am looking for a move to test the highs for the year. The PMO isn't overbought just yet and is still rising.
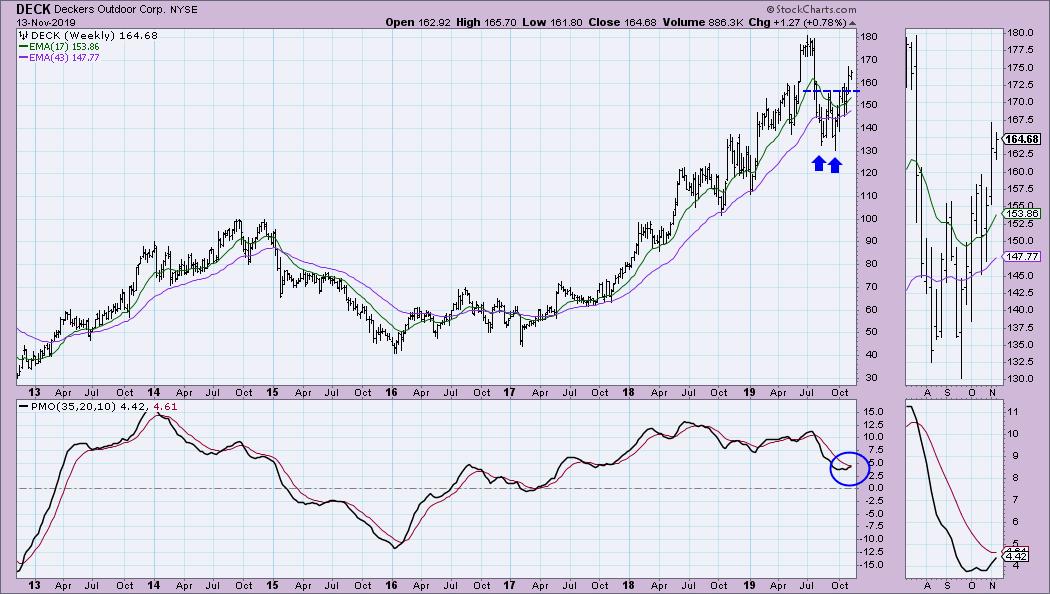
There is a clear double-bottom formation that is visible on the daily chart above but is better demonstrated on the weekly chart. It has executed and the expectation of the pattern would be a breakout to all-time highs. The PMO has turned up above the zero line and is going in for a crossover BUY signal.
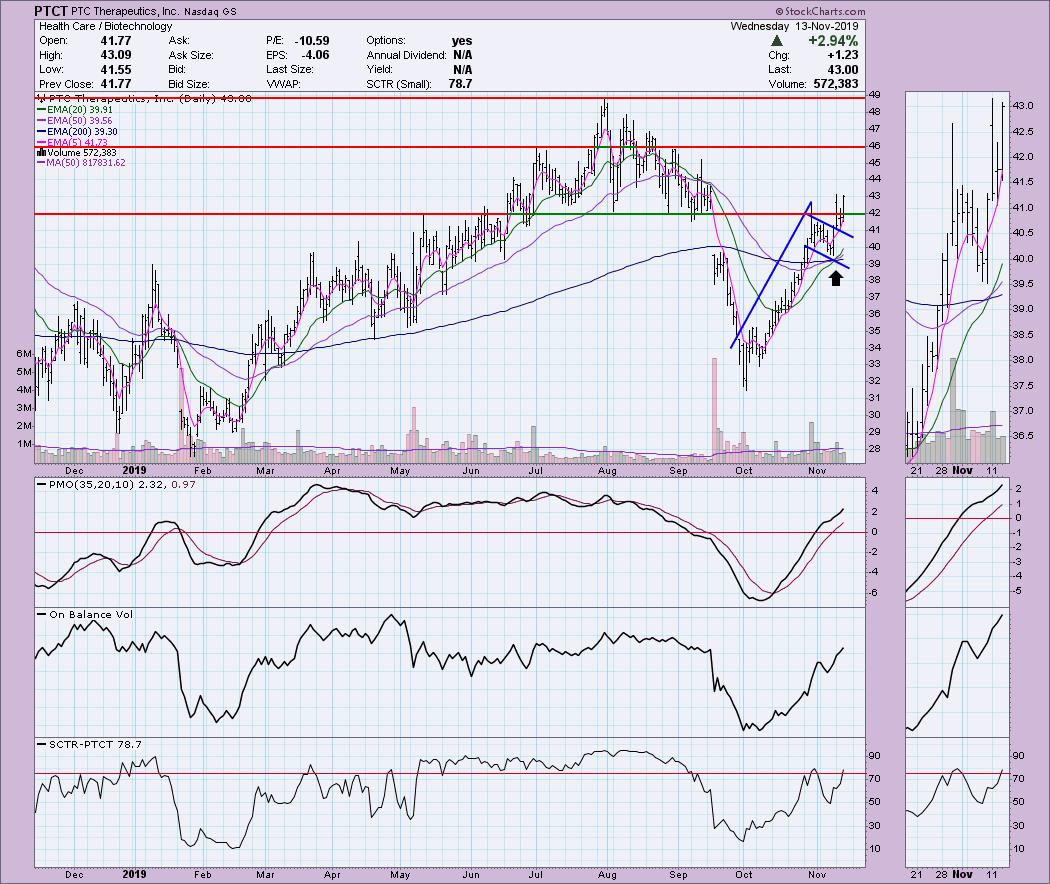
PTC Therapeutics Inc (PTCT) - Earnings: 10/29/2019
I see another flag formation that has executed. This is a biotech company, so be prepared for some volatility. I like the breakout, but it may require a pullback before entering, so I always watch the price action in the early part of the day to determine if I'll be chasing or taking advantage of a quick dip in price. The PMO is not overbought; notice that we saw the 20/50/200-EMAs all cross over for Trend Model BUY signals.
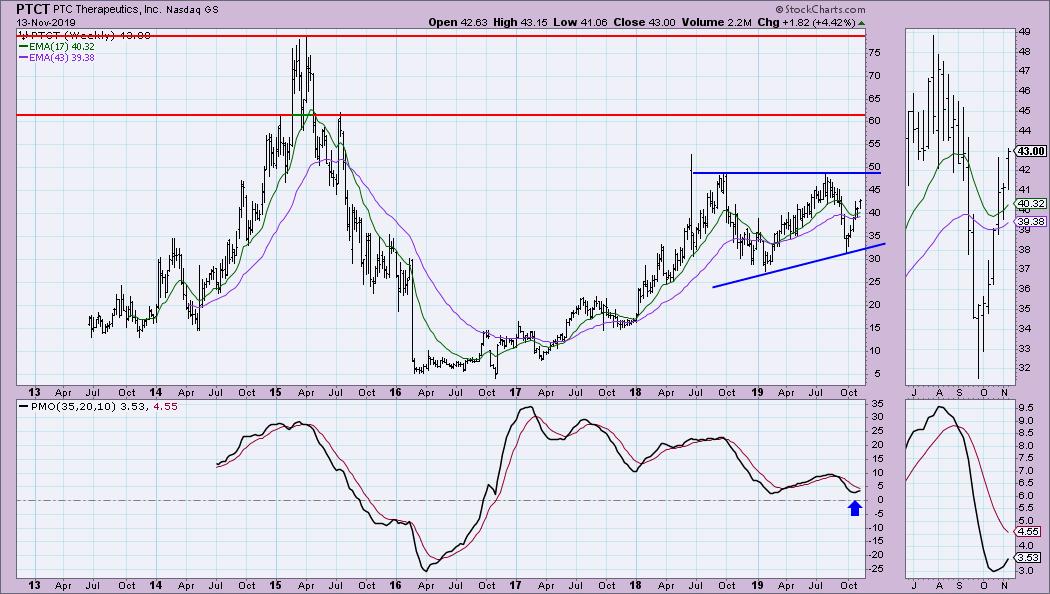
I see an ascending triangle forming on the weekly chart, with a PMO rising after bottoming above the zero line.
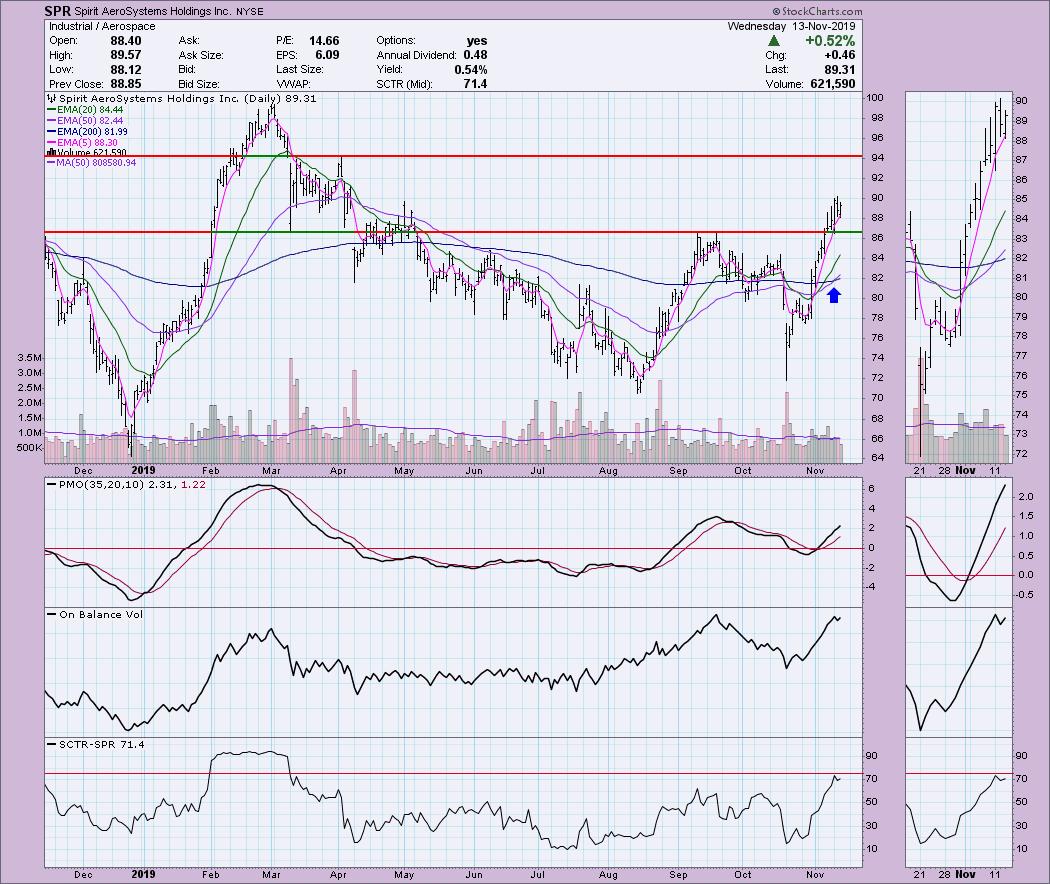
Spirit AeroSystems Holdings Inc (SPR) - Earnings: 1/30 - 2/3/2020
SPR recently entered a "bull market" configuration when the 50-EMA crossed above the 200-EMA. This is a Long-Term Trend Model BUY signal. Typically, when the 50-EMA is above the 200-EMA, price will behave bullishly or the chances of success are increased. The PMO is rising strongly and is not overbought. The OBV is confirming the rally as it rises.
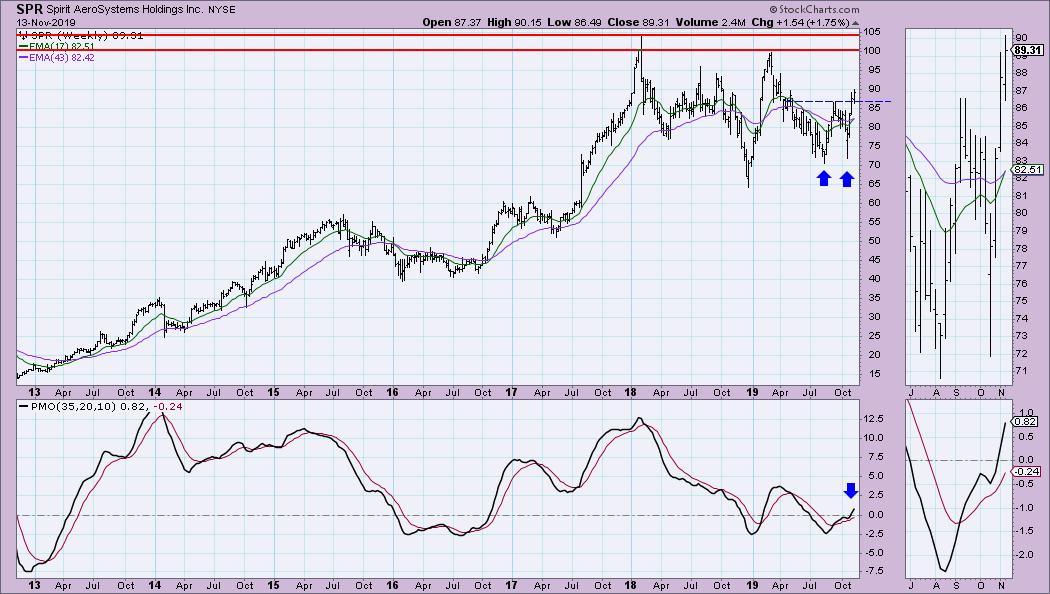
A double-bottom pattern has executed on the weekly chart and the minimum upside target would be calculated by adding the height of the pattern to the breakout point. That would most certainly bring price up to challenge the 2018 high. The weekly PMO has reached positive territory. Also, notice that the 17-week EMA has just crossed above the 43-week EMA.
Full Disclosure: I own Deckers Outdoor (DECK), but I don't own any of the others. I am not planning on purchasing any at this time. I'm currently about 80% in cash.

Erin Swenlin will be presenting at the The MoneyShow Las Vegas May 11-13, 2020! You'll have an opportunity to meet Erin and discuss the latest DecisionPoint news and Diamond Scans. The conference is free to attend or view online!
Watch the latest episode of DecisionPoint with Carl & Erin Swenlin LIVE on Mondays 5:00p EST or on the StockCharts TV YouTube channel here!
Technical Analysis is a windsock, not a crystal ball.
Happy Charting!
- Erin
erinh@stockcharts.com
NOTE: The stocks reported herein are from mechanical trading model scans that are based upon moving average relationships, momentum and volume. DecisionPoint analysis is then applied to get five selections from the scans. The selections given should prompt readers to do a chart review using their own analysis process. This letter is not a call for a specific action to buy, sell or short any of the stocks provided. There are NO sure things or guaranteed returns on the daily selection of "diamonds in the rough."
Helpful DecisionPoint Links:
DecisionPoint Shared ChartList and DecisionPoint Chart Gallery
Price Momentum Oscillator (PMO)
Swenlin Trading Oscillators (STO-B and STO-V)
**Don't miss DecisionPoint Commentary! Add your email below to be notified of new updates"**


