
Another week has passed and the market isn't really showing its hand. Momentum is slowing, but we haven't seen any serious pullbacks. I have been suspicious of this market since the breakout to new all-time highs, given the soft breadth numbers and the lack of positive reaction from our indicators, particularly the Swenlin Trading Oscillators (STOs). Today, our intermediate-term indicators have formed negative divergences while the Intermediate-Term Breadth Momentum Oscillator (ITBM) had a negative crossover. The warning signs continue.
The DecisionPoint Alert presents a mid-week assessment of the trend and condition of the stock market (S&P 500), the U.S. Dollar, Gold, Crude Oil and Bonds.
Watch the latest episode of DecisionPoint on StockCharts TV's YouTube channel here!
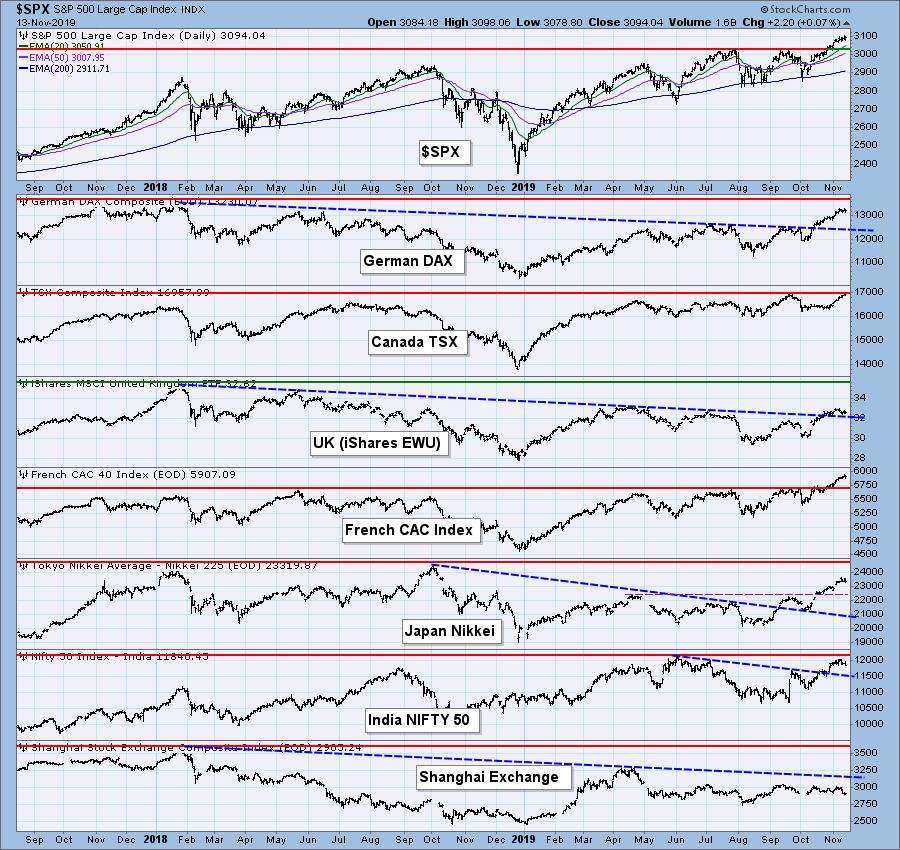
GLOBAL MARKETS
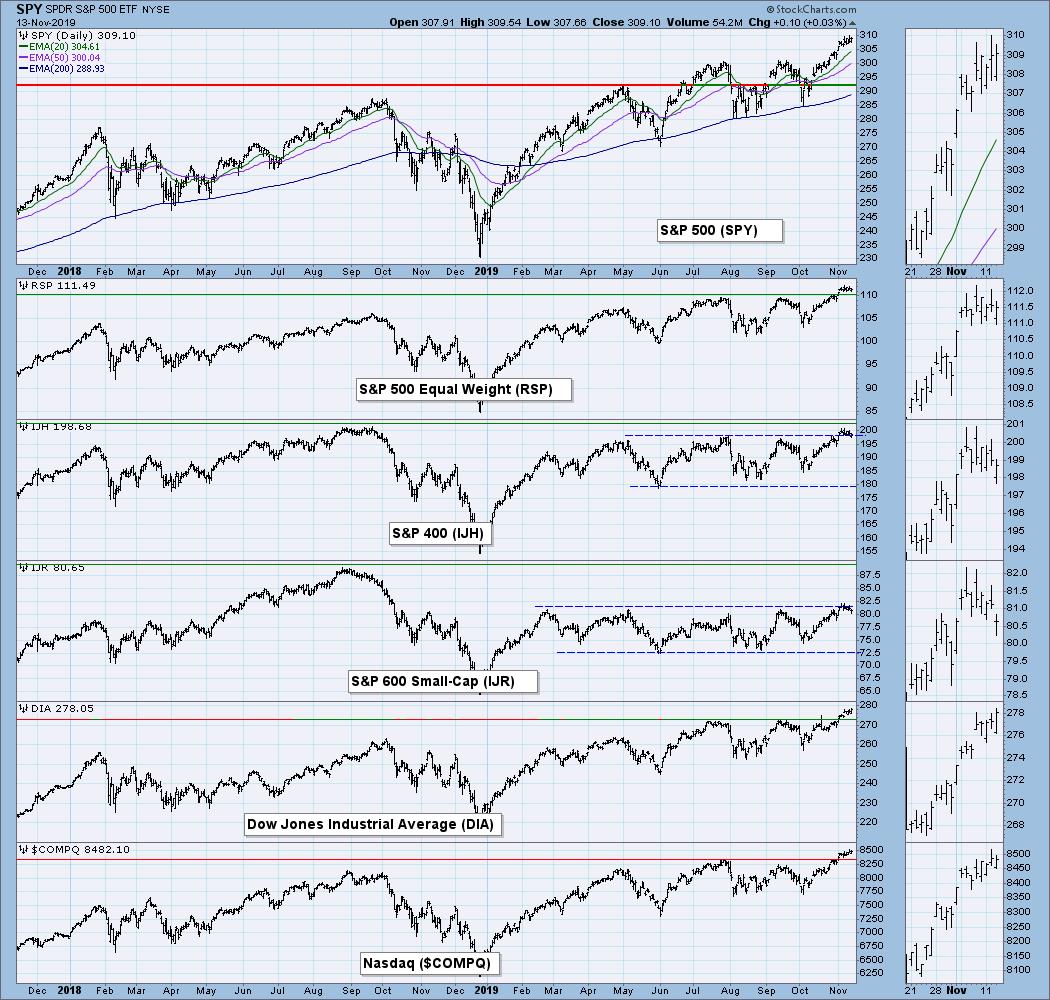
BROAD MARKET INDEXES
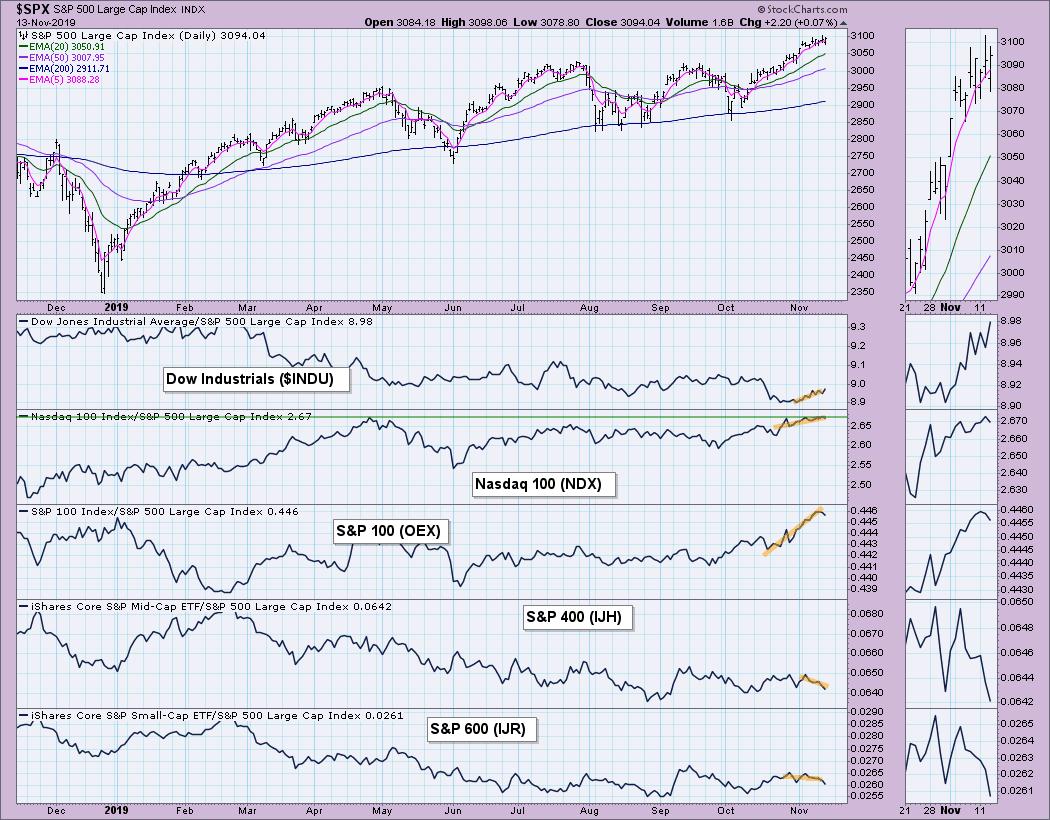
MARKET INDEXES PRICE RELATIVE TO SPX
SECTORS
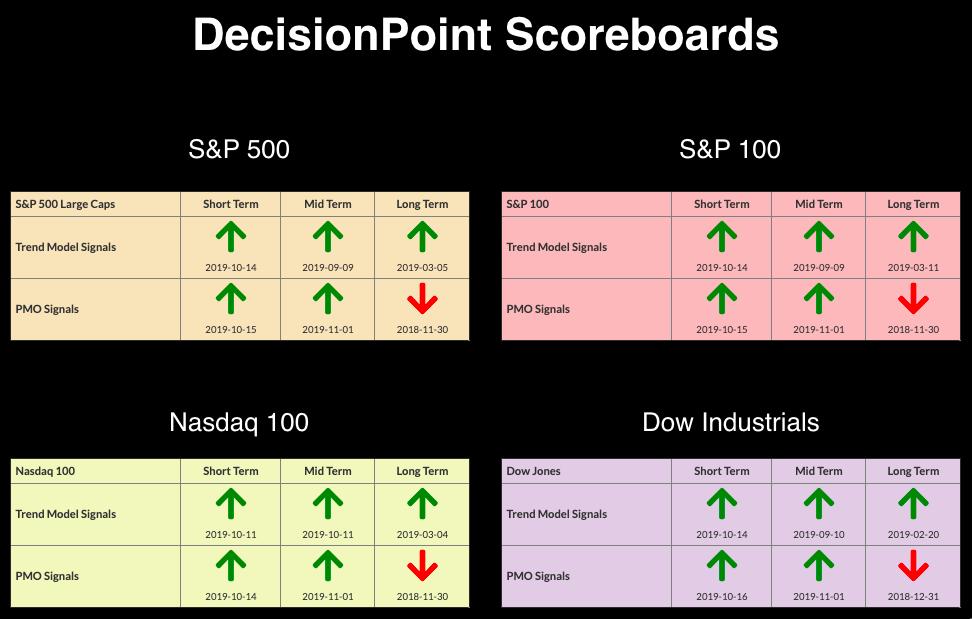
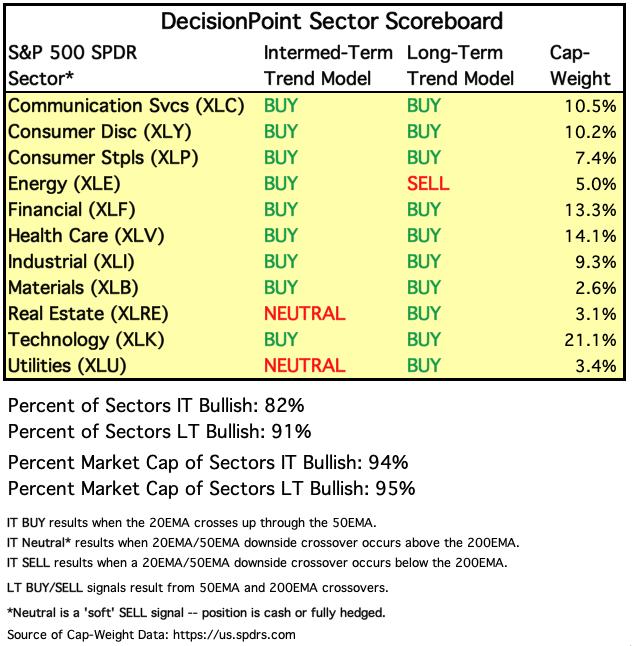
Each S&P 500 Index component stock is assigned to one, and only one, of eleven major sectors. This is a snapshot of the Intermediate-Term and Long-Term Trend Model signal status for those sectors.
STOCKS
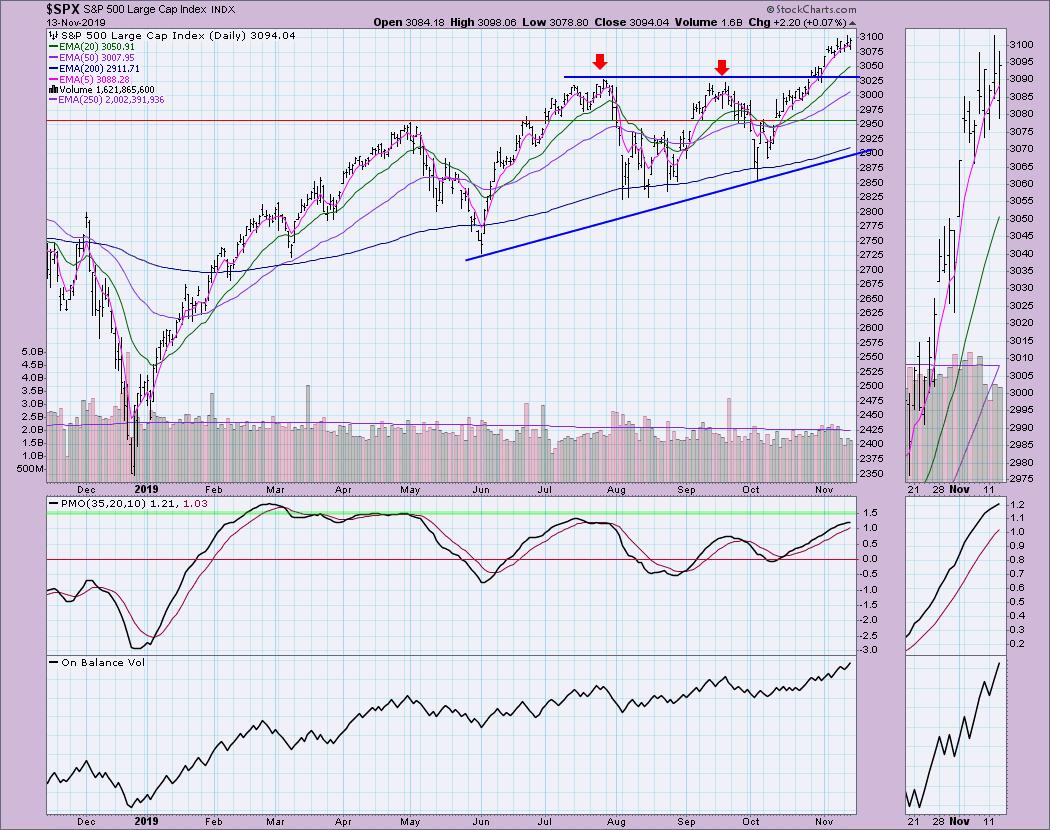
IT Trend Model: BUY as of 9/4/2019
LT Trend Model: BUY (SPY) as of 2/26/2019
SPX Daily Chart: Momentum is slowing as the PMO decelerates in somewhat overbought territory. Volume has been below the 250-EMA for nearly a week. The chart looks healthy, with the PMO still rising (though slowing) and the OBV confirming the rally with its rising bottoms. It appears that a bullish ascending triangle has been executed, which would suggest more all-time highs to come. But there is more to the story.
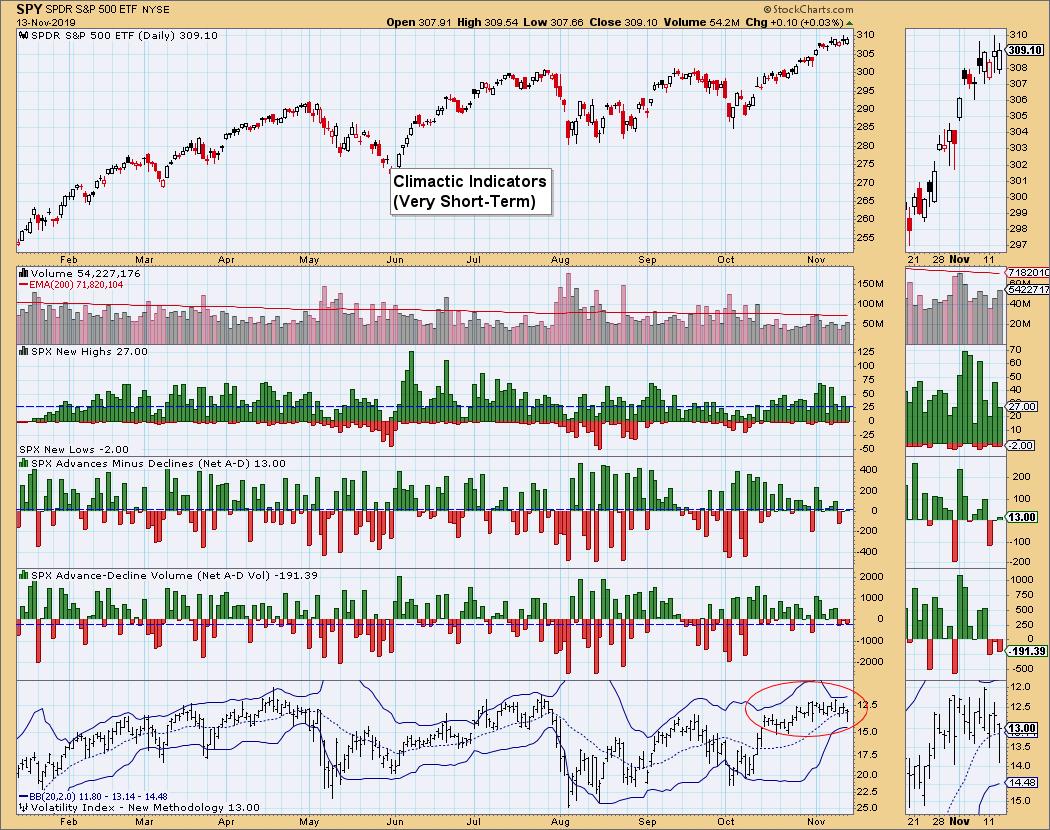
Climactic Market Indicators: No climactic activity on the chart, but it does highlight the low volume in November. The Bollinger Bands on the VIX have shrunk considerably, but readings are still right on average. I like to look for punctures of the bands and we haven't seen that in some time. Note that "new highs" are in a declining trend in November.
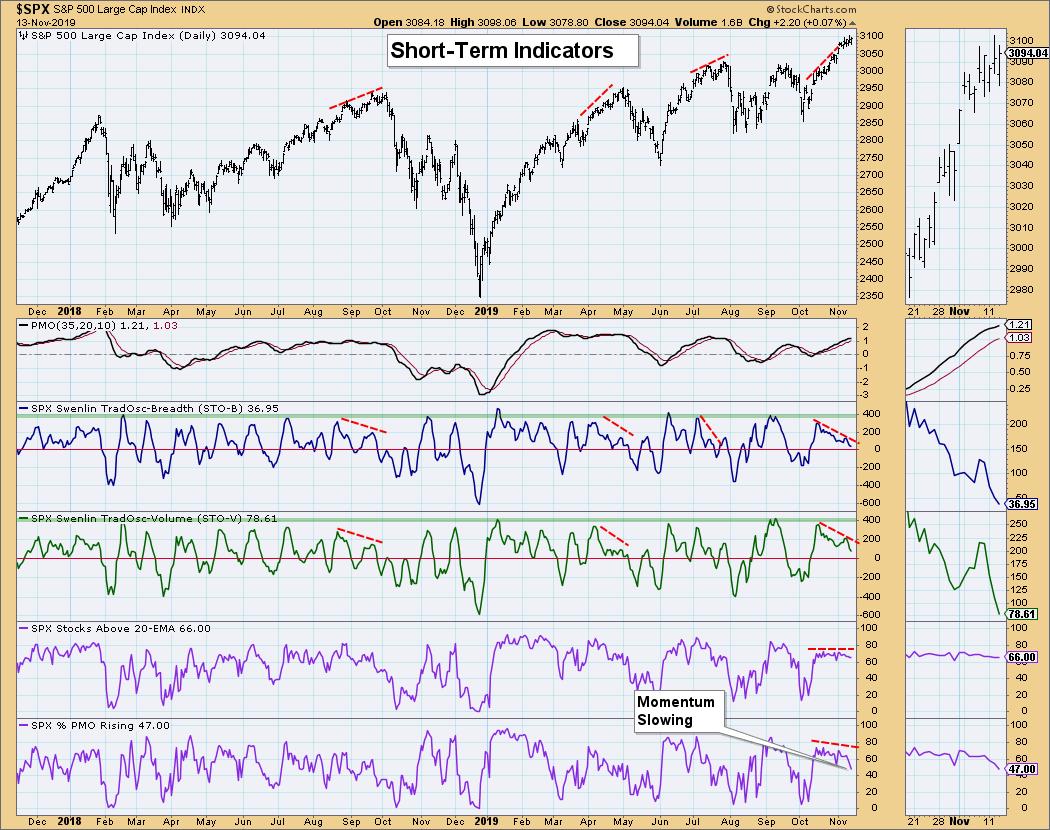
Short-Term Market Indicators: The negative divergences remain between the price tops and STO tops. This typically precedes a decline, but we've yet to see that. The %of stocks above their 20-EMA has been steady and less worrisome; however, notice the quickly declining %of stocks with rising PMOs, which is now less than 50%. Participation is one of the keys to a rally continuation and we don't want to see that waning to this degree.
Intermediate-Term Market Indicators: The ITBM had a negative crossover with its signal line and the ITVM is quickly headed in that direction. Now that we have tops on both, I was able to draw declining trend lines and display the negative divergences.
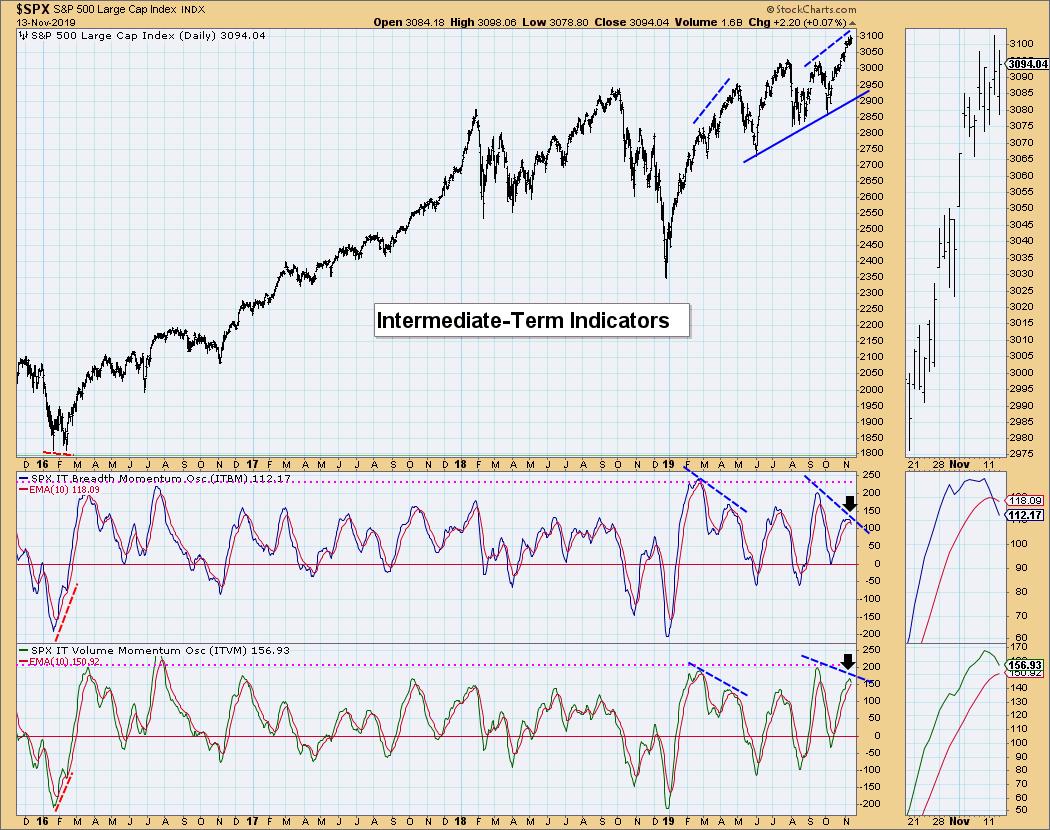
Conclusion: The market is looking a little bit toppy. Momentum is slowing. This could certainly be a pause after the breakout to new all-time highs, but, given the negative divergences on the ST and IT indicators, I am expecting a pullback at the very least.
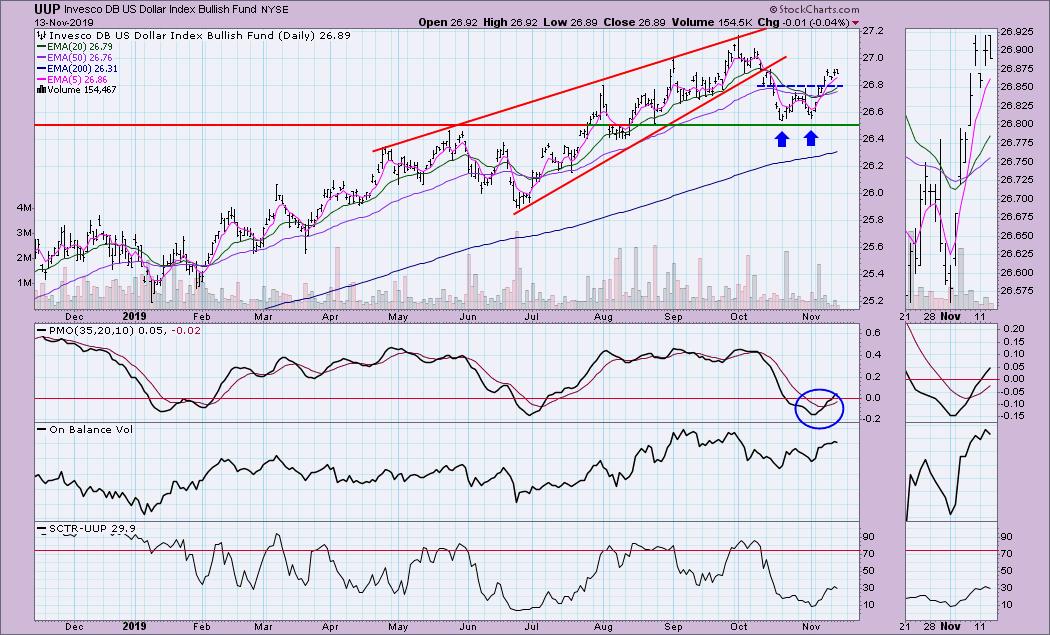
DOLLAR (UUP)
IT Trend Model: Neutral as of 10/31/2019
LT Trend Model: BUY as of 5/25/2018
UUP Daily Chart: The double-bottom is performing as expected, although I am not particularly happy with the consolidation or pause we are seeing right now. Full disclosure, I bought UUP on Friday and am still looking for the pattern to execute and reach its target, which would be the October top. The PMO has entered positive territory and the OBV bottoms are still rising even with this pause in the action.
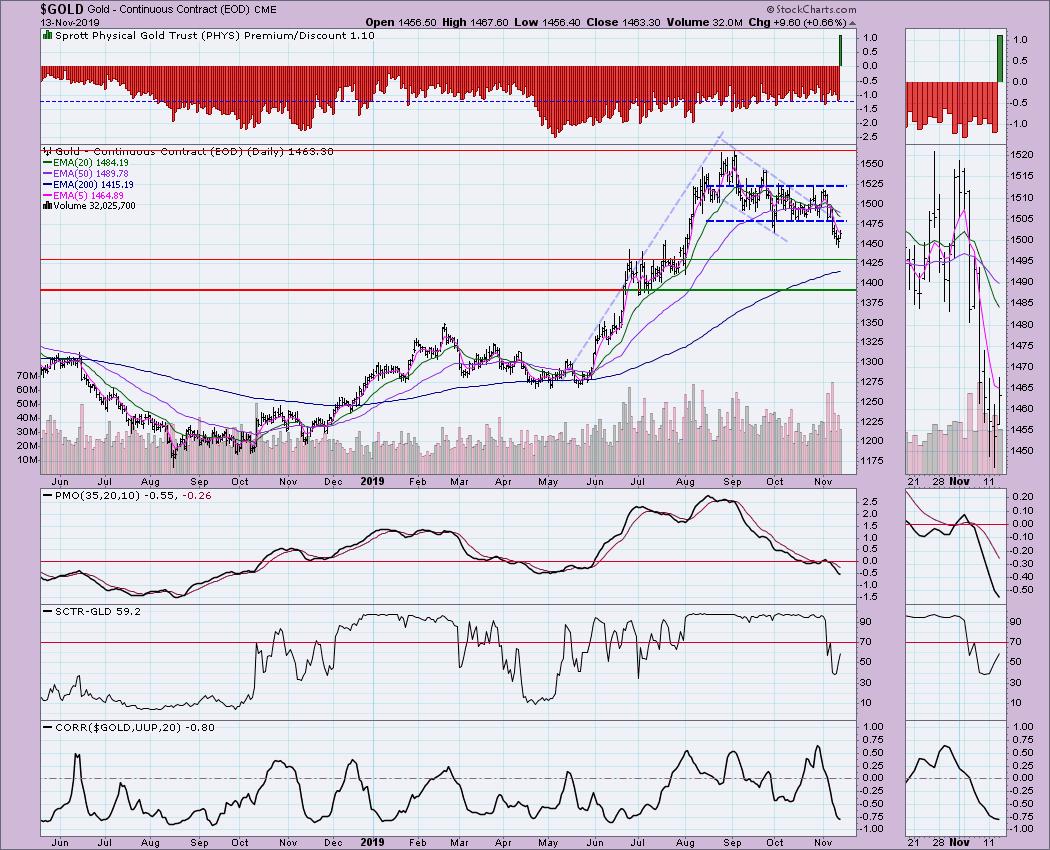
GOLD
IT Trend Model: Neutral as of 11/8/2019
LT Trend Model: BUY as of 1/8/2019
GOLD Daily Chart: I did a double-take when I saw the premium in the top indicator window. We haven't seen a premium in well over a year. Carl checked on it and, apparently, the total market value of gold within the Trust is lower than the total net asset value of the Trust, which is what creates the premium. A premium indicates that people are bullish on Gold and willing to pay a "premium" to own PHYS. Bullish sentiment is not good here. When people are too bullish, it generally means a reversal is on the horizon. The chart doesn't look good right now, as the PMO is at a level we have not seen since 2018 and still declining. I continue to believe that support will be found around 1425 or the 200-EMA, but, if they don't hold, a move to 1400 or below looks likely.
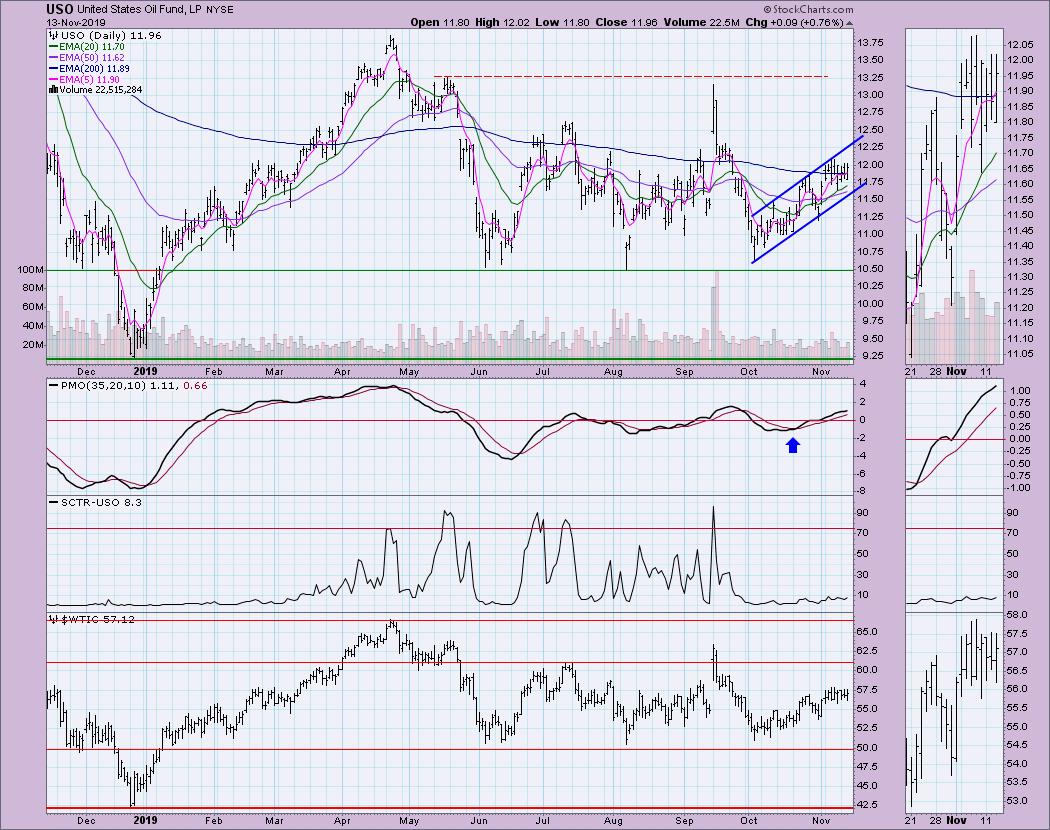
CRUDE OIL (USO)
IT Trend Model: BUY as of 11/6/2019
LT Trend Model: SELL as of 6/4/2019
USO Daily Chart: Oil is still in a rising trend channel. The PMO is rising and not overbought. I remain bullish on Oil.
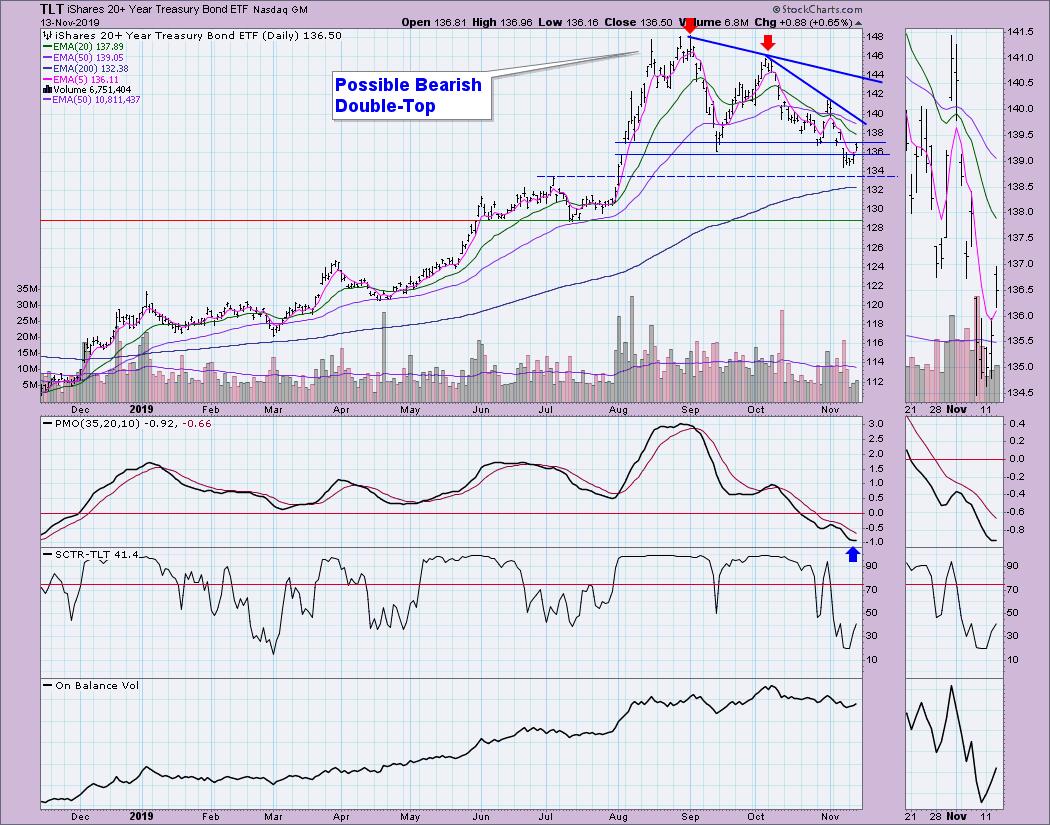
BONDS (TLT)
IT Trend Model: BUY as of 12/6/2018
LT Trend Model: BUY as of 1/2/2019
TLT Daily Chart: It appears that the double-top formation has executed, with the drop below not only the September low but also by the closure of the early August gap. Price is now rebounding somewhat. The PMO is oversold and trying to turn up. Although it appears TLT is ready to make a comeback, I believe the double-top is still in play until we see a breakout from the steep short-term declining tops trend line.
Technical Analysis is a windsock, not a crystal ball.
Happy Charting! - Erin
Email: erinh@stockcharts.com

Erin Swenlin will be presenting at the The MoneyShow Las Vegas May 11-13, 2020! You'll have an opportunity to meet Erin and discuss the latest DecisionPoint news and Diamond Scans. The conference is free to attend or view online!
**Don't miss any of the DecisionPoint commentaries! Go to the "Notify Me" box toward the end of this blog page to be notified as soon as they are published.**
NOTE: The signal status reported herein is based upon mechanical trading model signals, specifically the DecisionPoint Trend Model. These define the implied bias of the price index based upon moving average relationships, but they do not necessarily call for a specific action. They are information flags that should prompt chart review. Further, they do not call for continuous buying or selling during the life of the signal. For example, a BUY signal will probably (but not necessarily) return the best results if action is taken soon after the signal is generated. Additional opportunities for buying may be found as price zigzags higher, but the trader must look for optimum entry points. Conversely, exit points to preserve gains (or minimize losses) may be evident before the model mechanically closes the signal.
Helpful DecisionPoint Links:
DecisionPoint Shared ChartList and DecisionPoint Chart Gallery
Price Momentum Oscillator (PMO)
Swenlin Trading Oscillators (STO-B and STO-V)


