
Today, the Energy ETF (XLE) triggered a new Intermediate-Term Trend Model BUY signal for the first time in months. I was already seeing more energy-related stocks in my DecisionPoint scans, so I wasn't totally surprised to see that the sector is appearing to make a comeback. It has been beaten down for awhile, so there are likely some opportunities lying within. Yesterday I included two energy stocks; today, I include one more.
I love to get your feedback on DP commentary, so shoot me an email at erinh@stockcharts.com. I read every one of them!
Welcome to "DecisionPoint Daily Diamonds," a newsletter in which I highlight five "diamonds in the rough" taken from the results of one of my DecisionPoint scans. Remember, these are not recommendations to buy or sell, but simply stocks that I found interesting. The objective is to save you the work of the initial, tedious culling process, but you need to apply your own analysis to see if these stocks pique your interest as well. There are no guaranteed winners here!
Current Market Outlook:
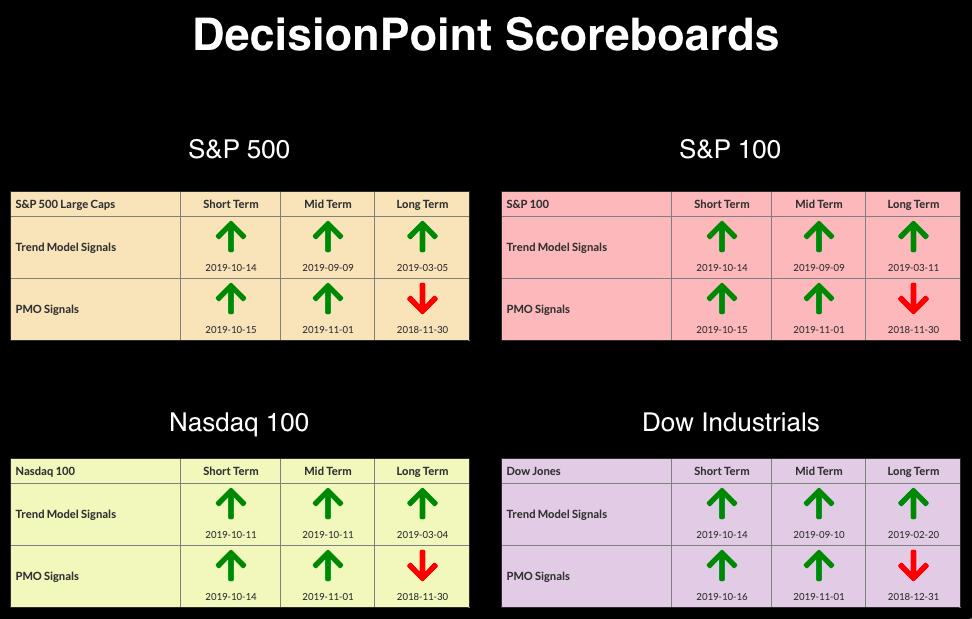
Market Trend: Currently, we have Trend Model BUY signals in all three timeframes on the DP Scoreboard Indexes.
Market Condition: The market is overbought and we have Price Momentum Oscillator (PMO) BUY signals on the DP Scoreboards. Caution is still warranted as volume, breadth and DP indicators are not confirming these new all-time highs.
Market Environment: It is important to consider the odds for success. Here are the current percentages on the Silver and Golden Cross Indexes:
- Silver Cross Index: 68.47% SPX IT Trend Model Buy Signals (20-EMA > 50-EMA)
- Golden Cross Index: 70.88% SPX LT Trend Model Buy Signals (50-EMA > 200-EMA)
Diamond Index:
- Diamond Scan Results: 2
- Diamond Dog Scan Results: 8
- Diamond Bull/Bear Ratio: 0.25
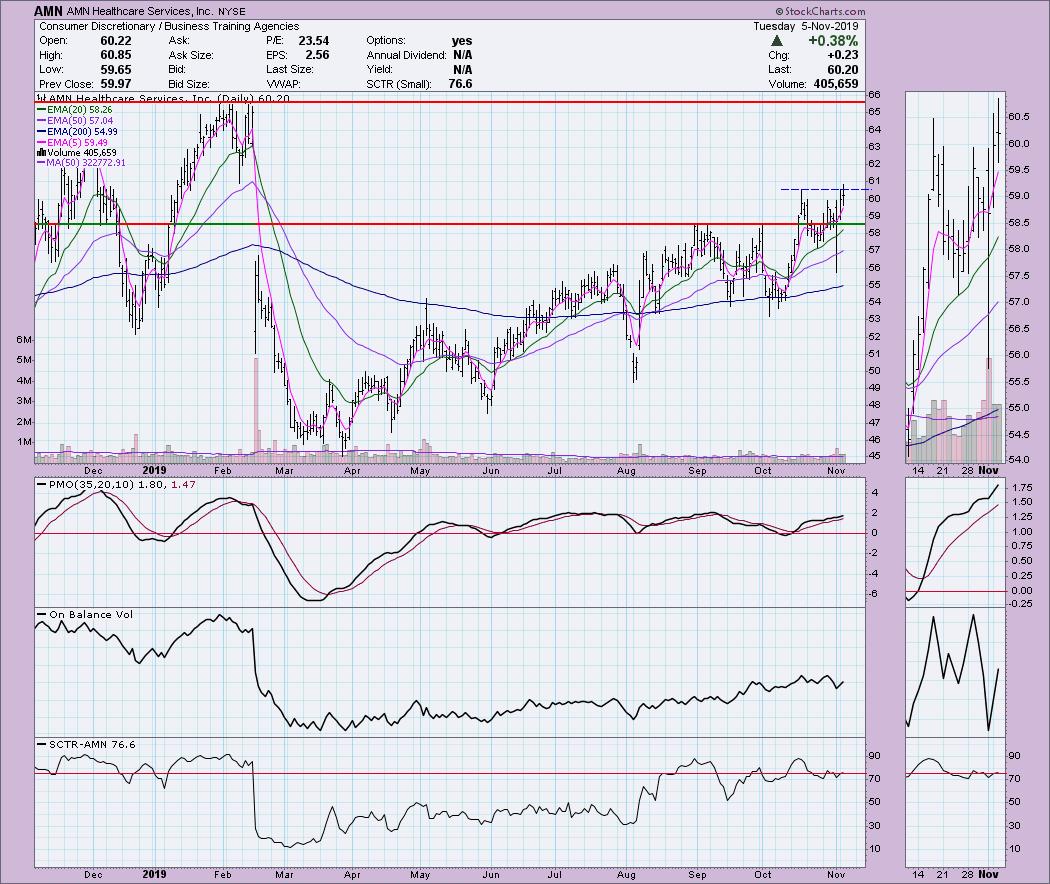
AMN Healthcare Services Inc (AMN) - Earnings: 10/31/2019
The PMO is already on a BUY signal, but it is not overbought. I like today's break above the October top, but it did close just below that. Since the August low, the OBV and price bottoms have been moving higher. The SCTR has reversed and is moving back into the "hot zone" above 75.
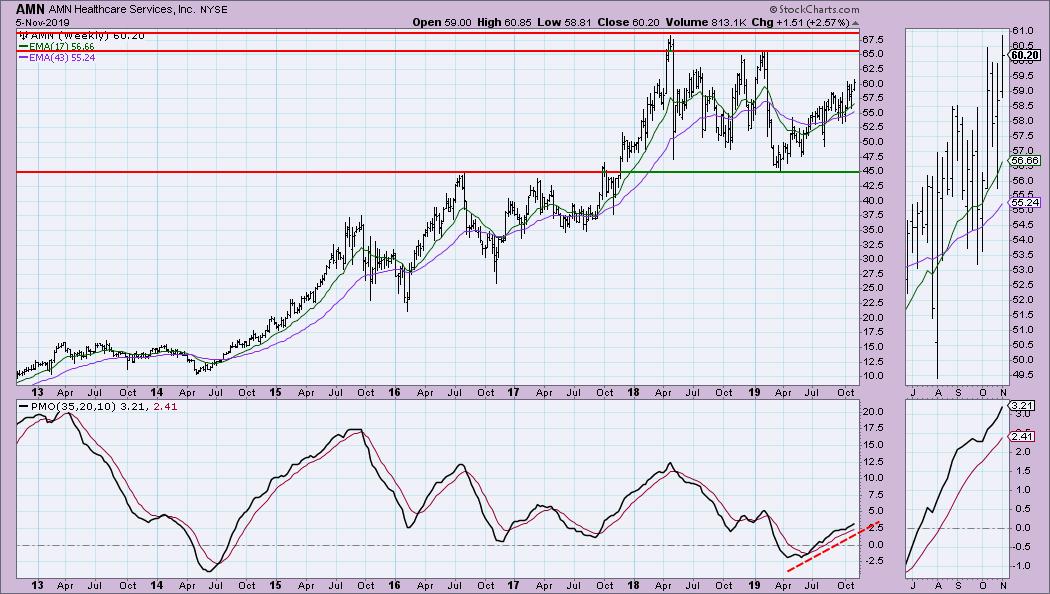
The weekly chart is far more enticing than the daily chart. The PMO is rising nicely and is definitely not overbought. Overhead resistance doesn't arrive until about $66 and the 2018 top would put resistance above $67.50.
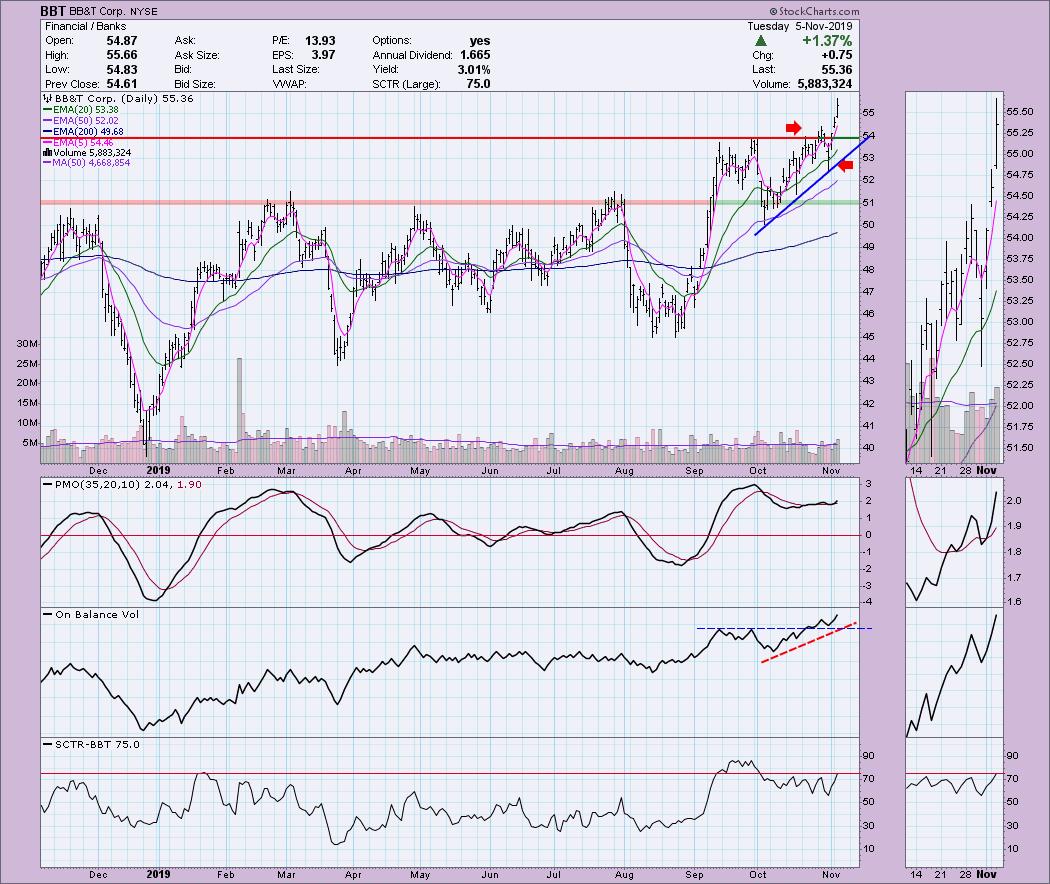
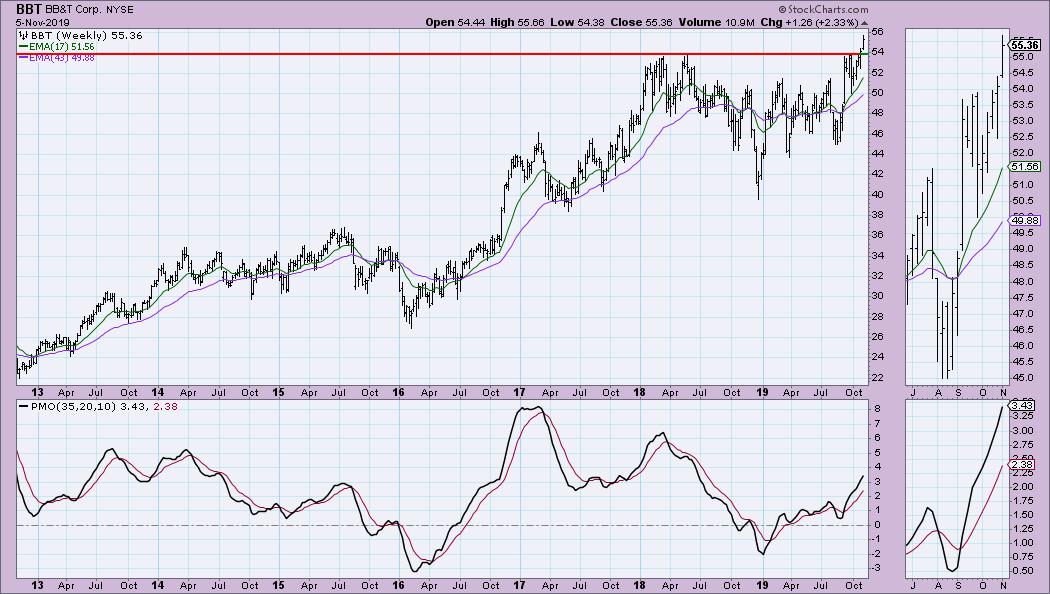
BB&T Corp (BBT) - Earnings: 1/15 - 1/20/2020
We had a beautiful breakout yesterday and today. Although we can see the original breakout failed, the low it hit still kept the rising trend intact. After that, it bounced off the 20-EMA. The PMO is on a new BUY signal; it is somewhat overbought, but the downside of the PMO range back in 2018 reached all the way to -4. This tells me that the upper end of the range is +4, so it has plenty of room to run. OBV is rising with price and the price breakout is confirmed by the OBV breakout.
The weekly chart shows the veracity of this week's breakout move. The PMO is healthy, rising and not overbought.
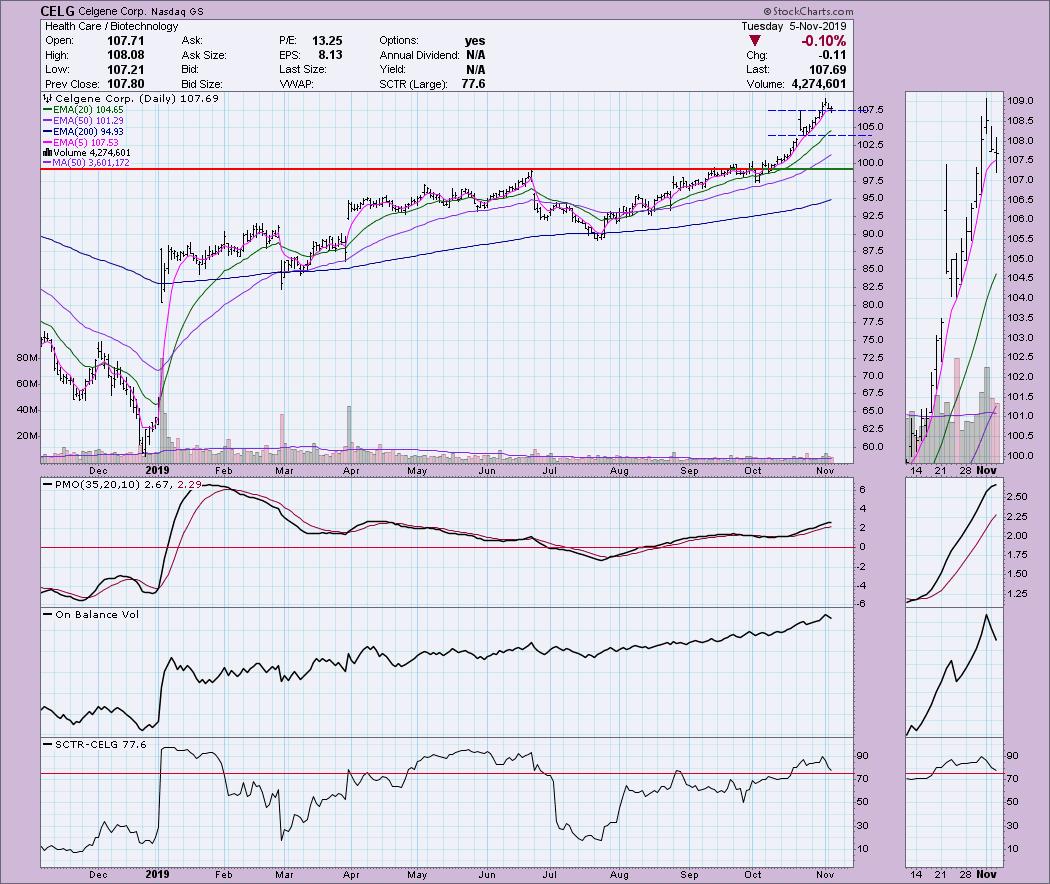
Celgene Corp (CELG) - Earnings: 1/29 - 2/3/2020
At first glance I thought this one might mean "chasing" an already mature rally. However, it has pulled back and is holding the previous top in October. The PMO is decelerating with this pullback, but is still rising and is not overbought.
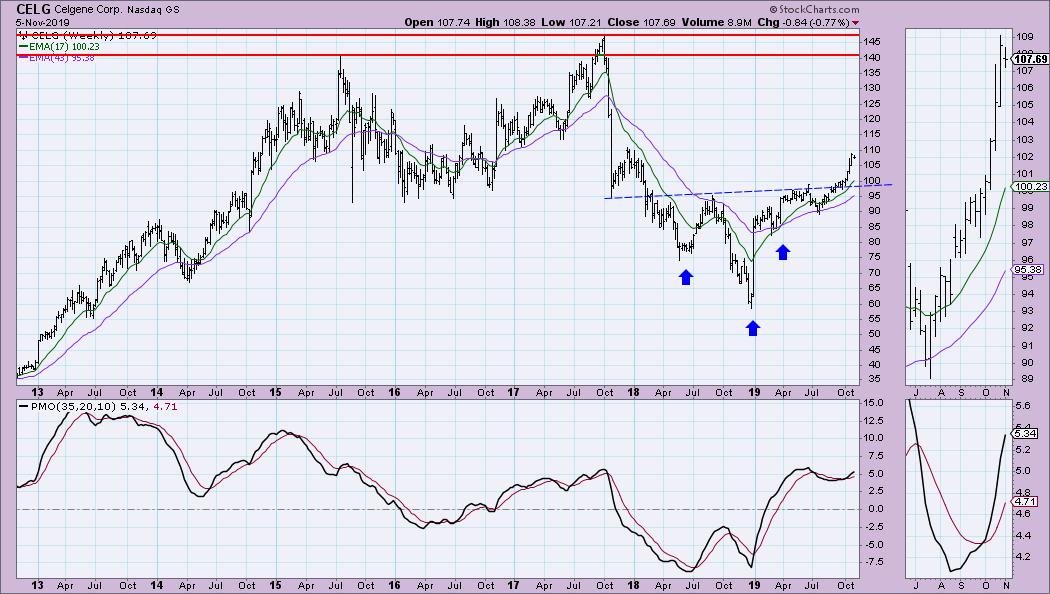
I spy a large reverse head-and-shoulders on CELG that has already executed. The minimum upside target would be right at overhead resistance between $140 and $145. The PMO has reversed and is rising; it has room to move higher in support of a new rally.
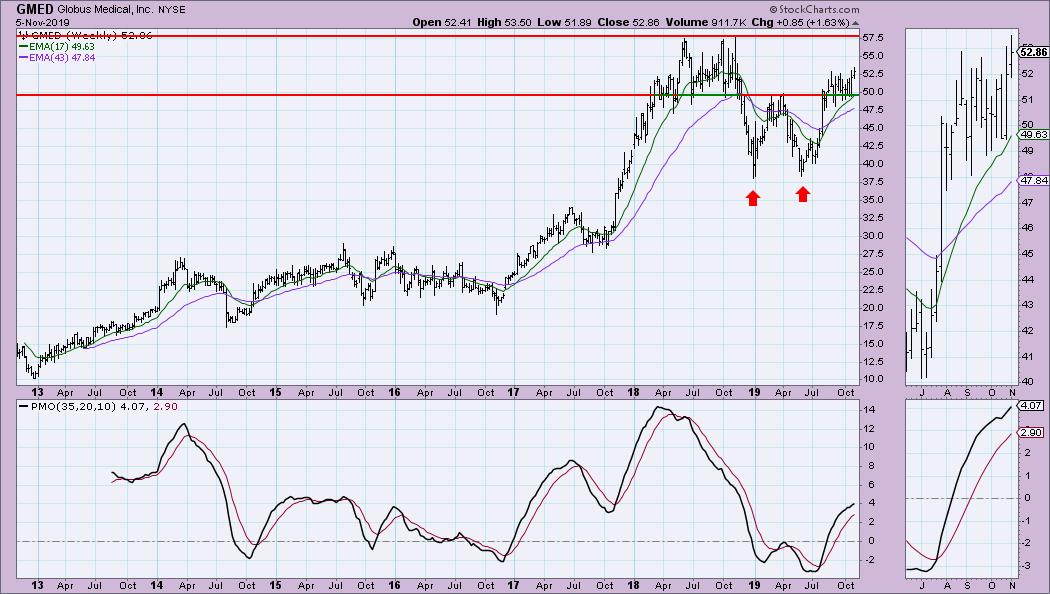
Globus Medical Inc (GMED) - Earnings: 11/6/2019
I always like to see PMO bottoms just above the zero line. This PMO BUY signal has arrived right after a breakout from a symmetrical triangle, and the OBV is moving in line with the current rally. I like that price pulled back slightly today toward the breakout point; that is generally when you want to get in.
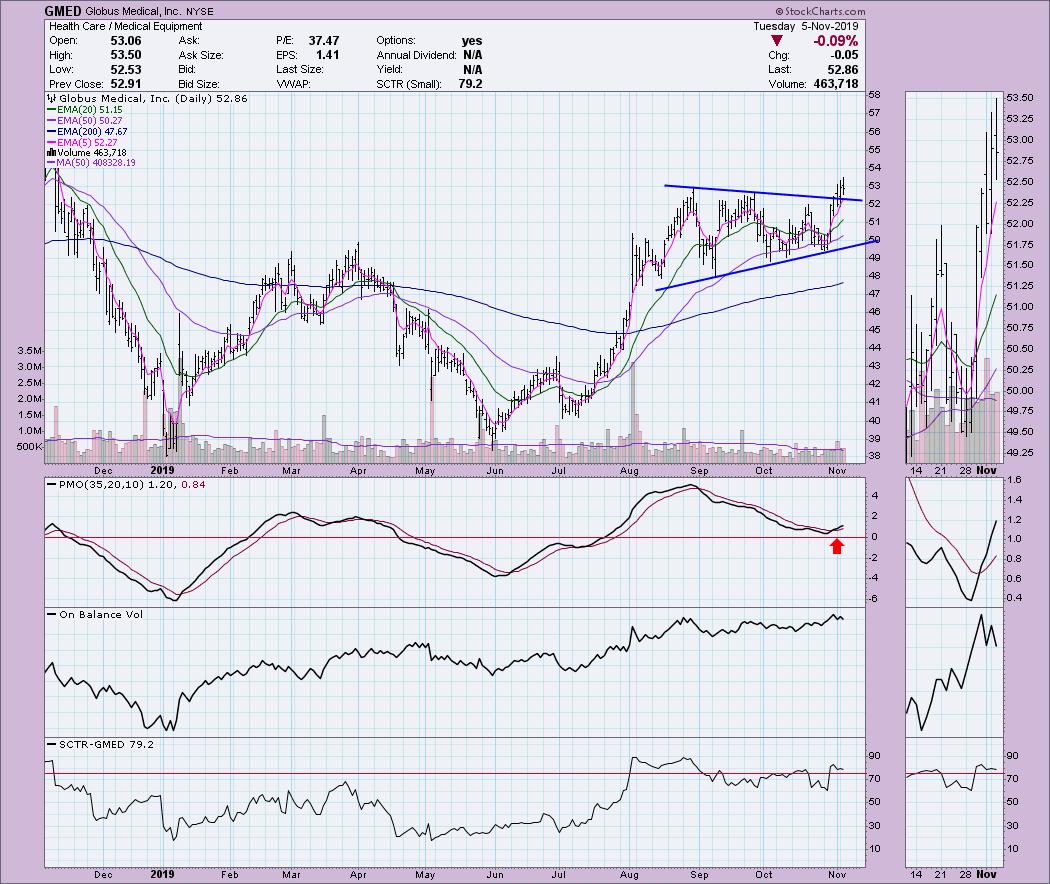
There is a giant double-bottom on the weekly chart that has finally executed. Overhead resistance is at $57.50, but the minimum upside target of the double-bottom pattern suggests a move to around $62. The PMO has accelerated higher and is not overbought.
Hess Corp (HES) - Earnings: 1/28 - 2/3/2020
Here is the energy stock I mentioned in the opening. Price hasn't yet broken above the September high, but the PMO and OBV look very healthy. The PMO managed to avoid a negative crossover and the OBV is moving higher in conjunction with price. Among large-cap stocks, a SCTR rank of 76.2 tells you it has good relative and internal strength.
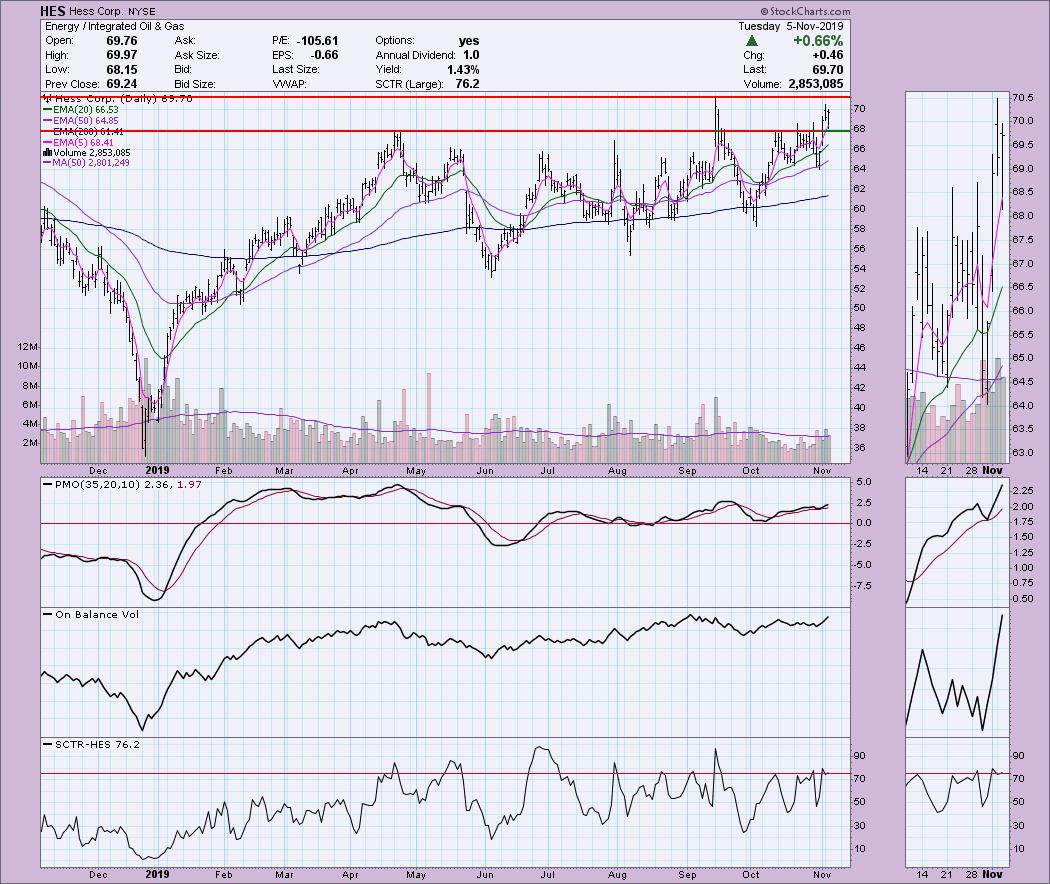
The weekly chart looks promising as the PMO is now shooting skyward. I'm still not thrilled with overhead resistance lying so close, but the PMO suggests to me it will be able to "break on through to the other side."

Full Disclosure: I don't own any of the stocks I've presented today and I don't plan on adding any to my portfolio at this time. The market has been rallying, but I am expecting to see a downturn very soon. I'm currently about 60% in cash.

Erin Swenlin will be presenting at the The MoneyShow Las Vegas May 11-13, 2020! You'll have an opportunity to meet Erin and discuss the latest DecisionPoint news and Diamond Scans. The conference is free to attend or view online!
Watch the latest episode of DecisionPoint with Carl & Erin Swenlin LIVE on Mondays 5:00p EST or on the StockCharts TV YouTube channel here!
Technical Analysis is a windsock, not a crystal ball.
Happy Charting!
- Erin
erinh@stockcharts.com
NOTE: The stocks reported herein are from mechanical trading model scans that are based upon moving average relationships, momentum and volume. DecisionPoint analysis is then applied to get five selections from the scans. The selections given should prompt readers to do a chart review using their own analysis process. This letter is not a call for a specific action to buy, sell or short any of the stocks provided. There are NO sure things or guaranteed returns on the daily selection of "diamonds in the rough."
Helpful DecisionPoint Links:
DecisionPoint Shared ChartList and DecisionPoint Chart Gallery
Price Momentum Oscillator (PMO)
Swenlin Trading Oscillators (STO-B and STO-V)
**Don't miss DecisionPoint Commentary! Add your email below to be notified of new updates"**


