
Today was a mixed bag as far as today's Diamonds were concerned. I ran quite a few scans, but wasn't particularly excited about many of the results. I was persistent, however, and found a handful that do look very interesting. Notably, I have three Energy stocks for you to look at. Energy has been the one sector that has continued to lag the markets, but I'm finding some pockets of strength here. Remember, if you do decide to trade a diamond or any stock/ETF, wait about 30 minutes after the open unless the early action is enticing. It's just a rule of thumb that I have followed with great success. It makes you patient and discriminating with your entry.
I love to get your feedback on DP commentary, so shoot me an email at erinh@stockcharts.com. I read every one of them!
Welcome to "DecisionPoint Daily Diamonds," a newsletter in which I highlight five "diamonds in the rough" taken from the results of one of my DecisionPoint scans. Remember, these are not recommendations to buy or sell, but simply stocks that I found interesting. The objective is to save you the work of the initial, tedious culling process, but you need to apply your own analysis to see if these stocks pique your interest as well. There are no guaranteed winners here!
Current Market Outlook:
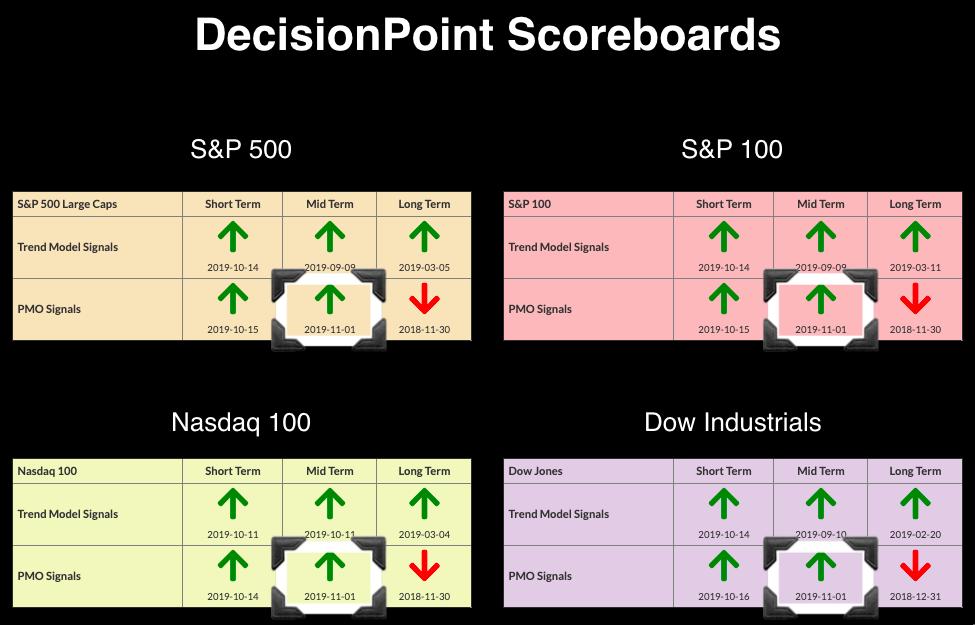
Market Trend: Currently, we have Trend Model BUY signals in all three timeframes on the DP Scoreboard Indexes.
Market Condition: The market is overbought and we have Price Momentum Oscillator (PMO) BUY signals on the DP Scoreboards. Caution is still warranted as volume, breadth and DP indicators are not confirming these new all-time highs. However, we did just see PMO crossover BUY signals on the weekly charts on Friday... might be late in arriving.
Market Environment: It is important to consider the odds for success. Here are the current percentages on the Silver and Golden Cross Indexes:
- Silver Cross Index: 67.4% SPX IT Trend Model Buy Signals (20-EMA > 50-EMA)
- Golden Cross Index: 70.6% SPX LT Trend Model Buy Signals (50-EMA > 200-EMA)
Diamond Index:
- Diamond Scan Results: 1
- Diamond Dog Scan Results: 11
- Diamond Bull/Bear Ratio: 0.09
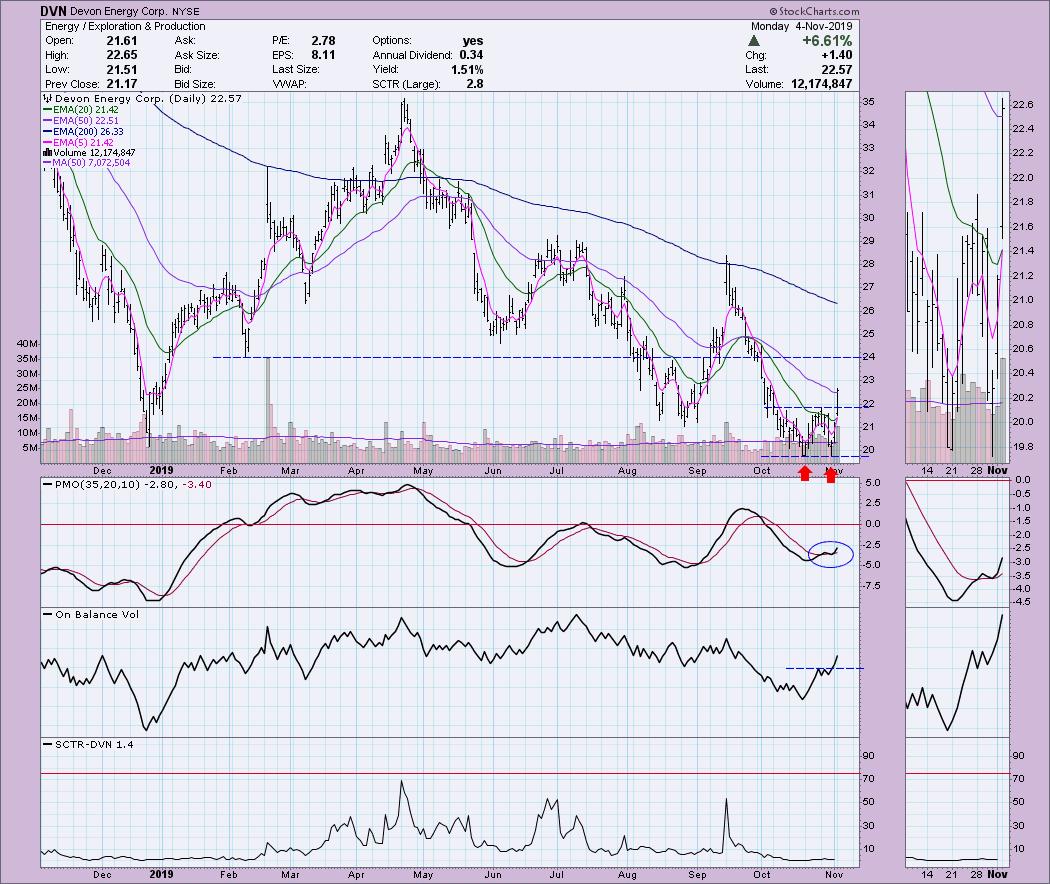
Devon Energy Corp (DVN) - Earnings: 11/5/2019
Huge move to the upside today in what appears to be a pre-earnings pop. A double-bottom formed after the deep decline from the September highs. The PMO is energized. In the thumbnail, notice that the PMO bottoms are rising while corresponding price bottoms did not. That's a positive divergence. Volume certainly came in today. My caveat on this one is that it may require a pullback to the breakout point at $22. I honestly would wait for some sort of pullback before I chose to enter.
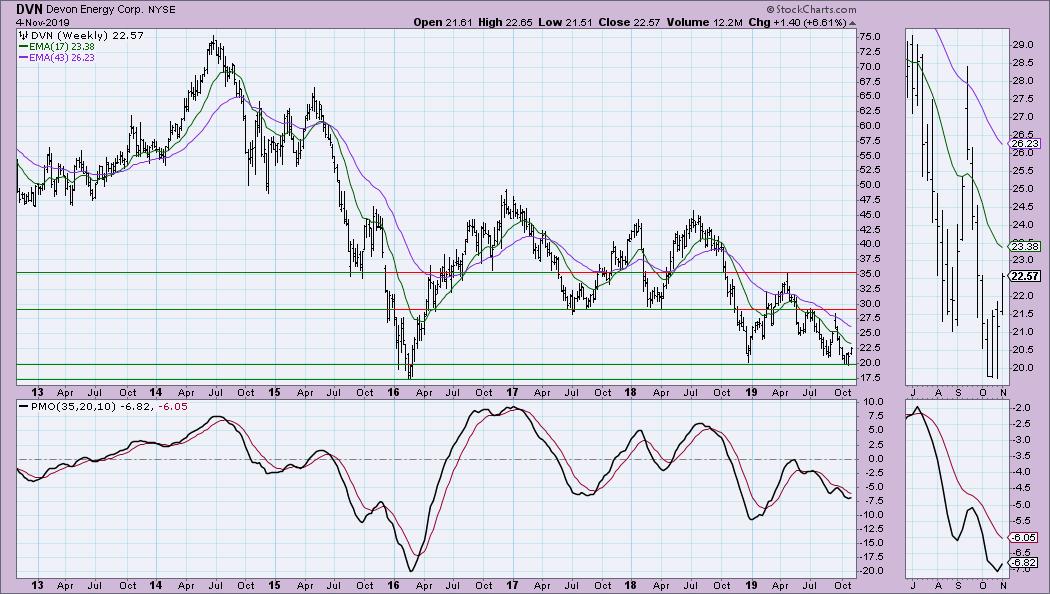
What I was happy to see on this weekly chart was price sitting on intermediate-term support. That said, we did see a low in 2016 at about $17.50. I'm looking for a test of overhead resistance at $30.
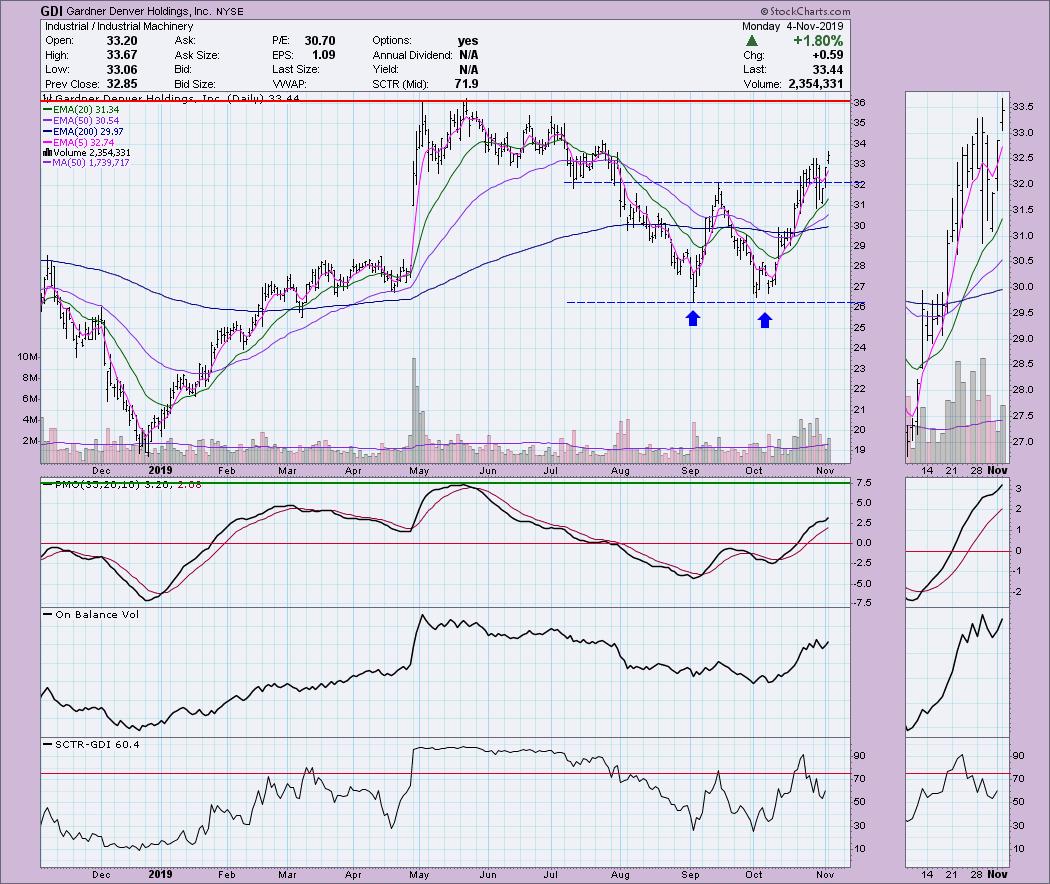
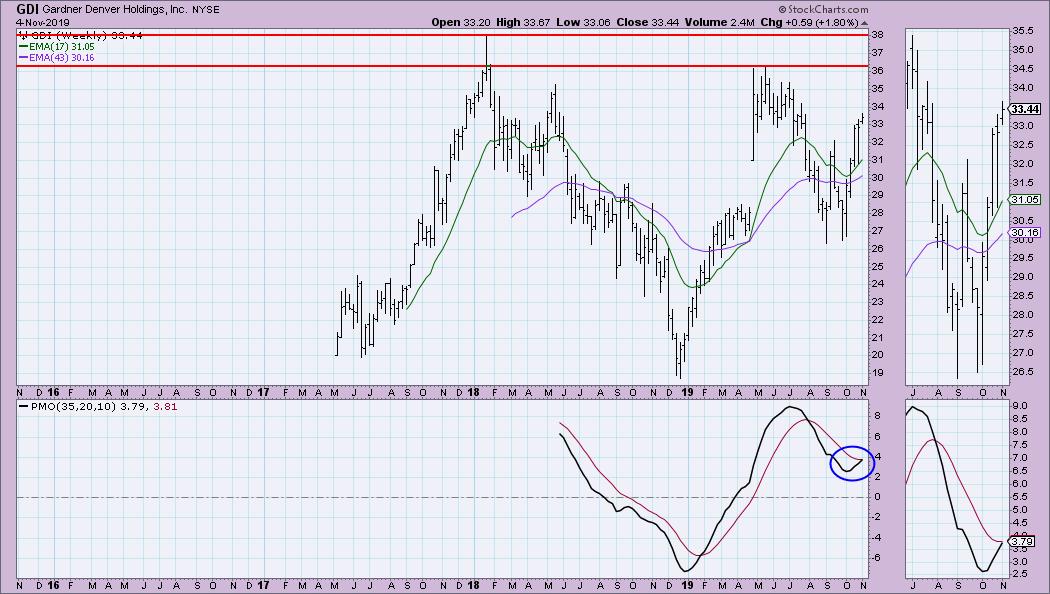
Gardner Denver Holdings Inc (GDI) - Earnings: 10/28/2019
It looked like the double-bottom formation was going to be a bust, but, after price dropped last week and successfully tested the 20-EMA, it is now back in business. The PMO is rising nicely and isn't overbought. On the daily chart, upside target is $36. I am not thrilled with the declining SCTR, but the OBV is confirming this breakout.
The weekly chart looks pretty healthy. Notice that upside potential on the weekly chart moves up from $36 to $38. The weekly PMO is about to generate a crossover BUY signal.
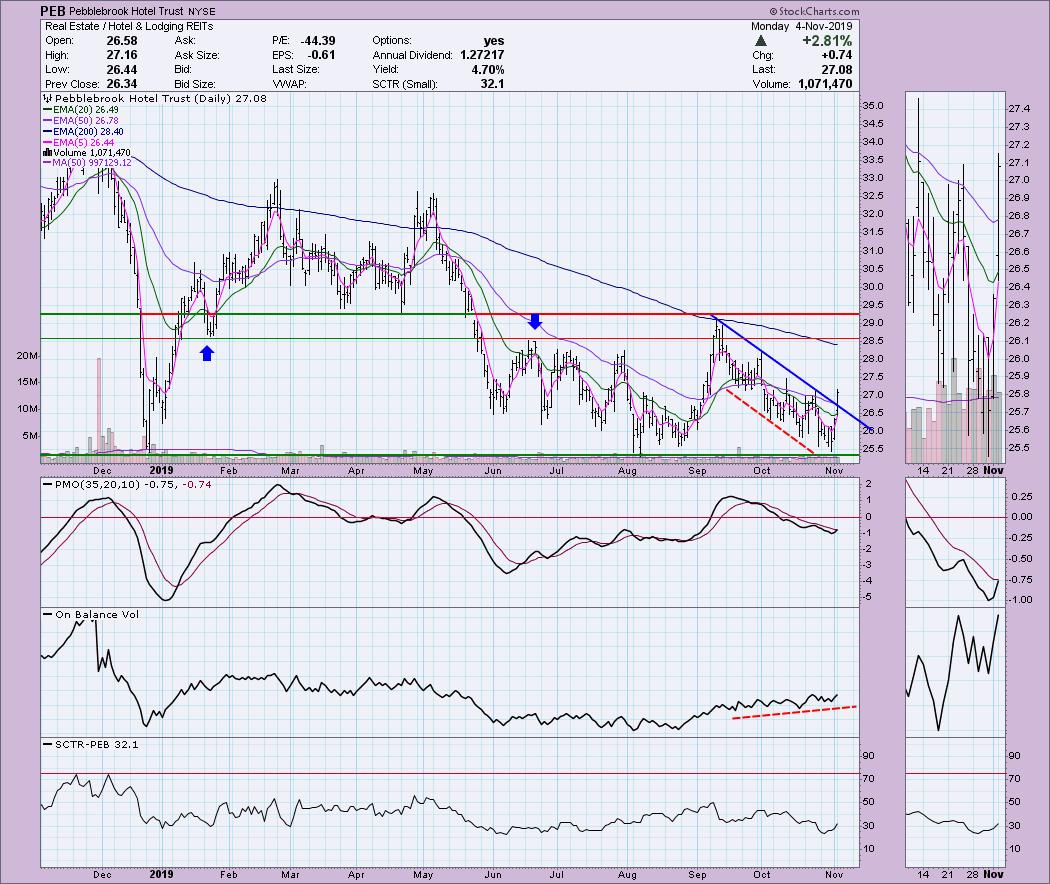
Pebblebrook Hotel Trust (PEB) - Earnings: 10/24/2019
We have a nice breakout from a declining trend and overhead resistance won't be reached soon. I've marked to two areas of overhead resistance. The first one up matches with some previous lows and highs. The upside target, however, is $29.25, where we see the major overhead resistance formed by the lows in March/April and the September top. The OBV has rising bottoms while price has declining lows. This sets up a nice positive divergence.
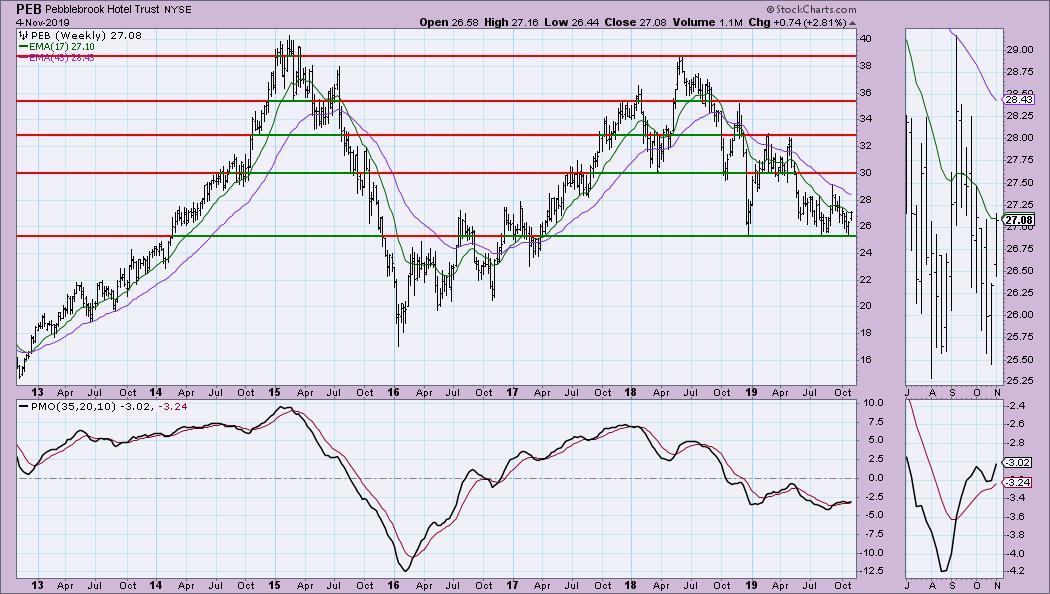
Lots of layers of overhead resistance. I like that support at $25.50 has held in 2019. A weekly PMO bottom above the signal line is especially bullish. My upside target would be $30 and my stop would be tight. I wouldn't want to see that $25.50 support line broken.
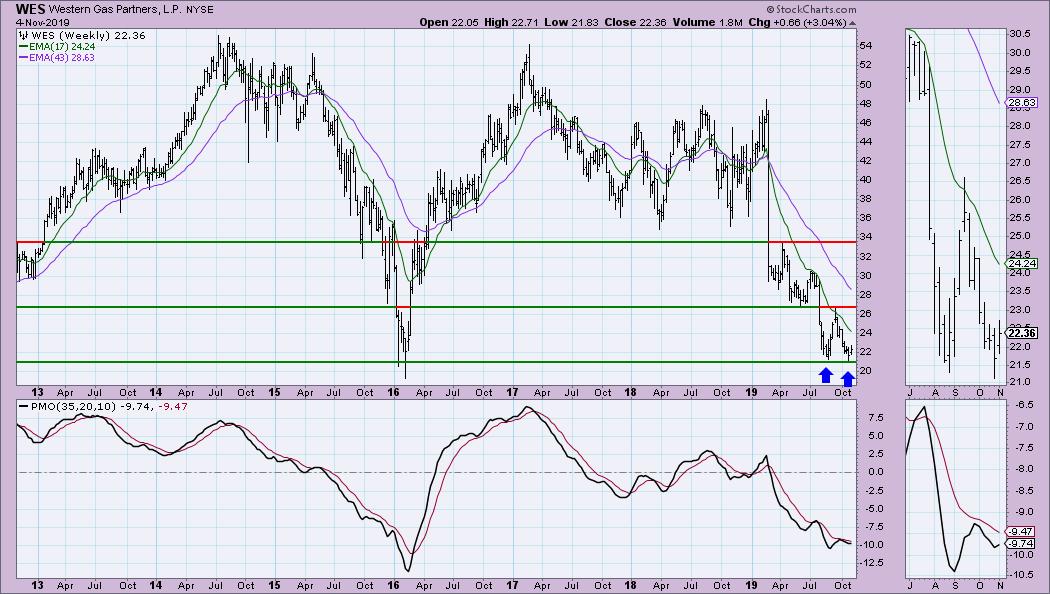
Estern Gas Partners LP (WES) - Earnings: 11/4/2019
After testing support at the August low, price has bounced. Today, it broke out of a longer-term declining trend. The PMO has popped to the upside. You can see in the thumbnail how the OBV declining trend was also broken. A breakout move on earnings will often see a follow-through rally.
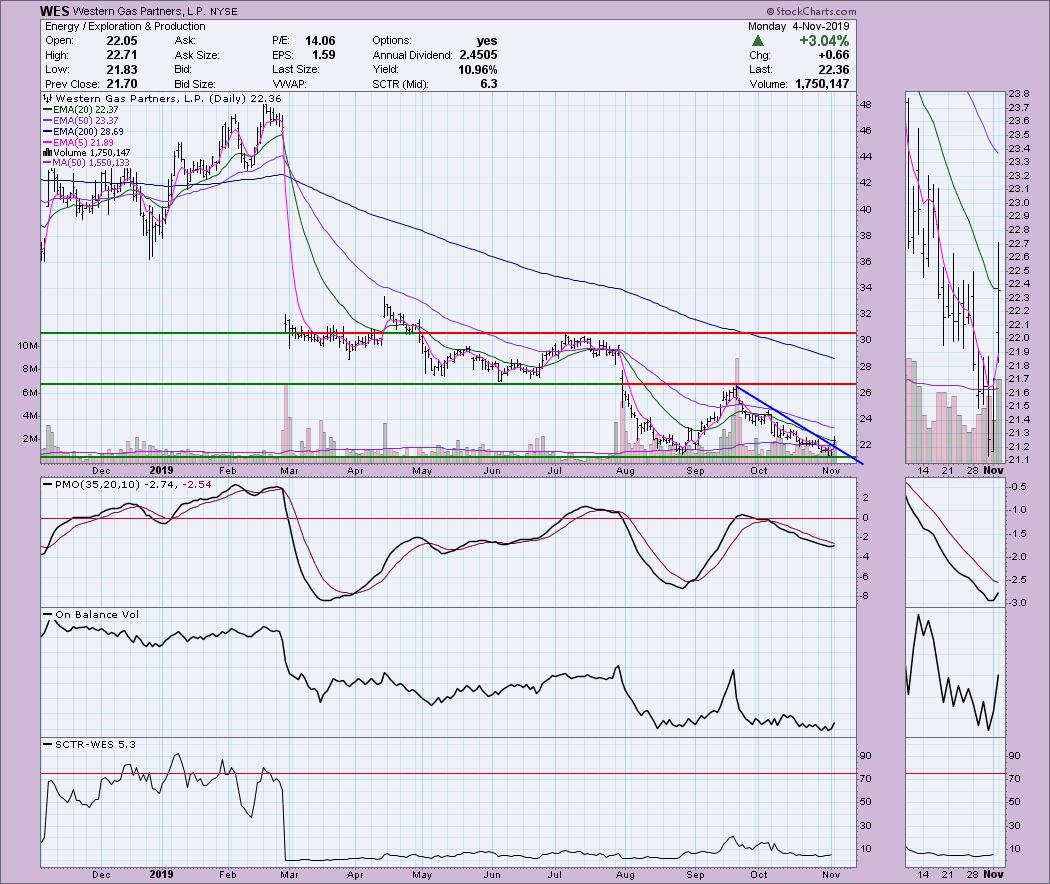
The double-bottom pattern that could (emphasis on "could") be forming would suggest an upside target right at the $34 level, which does coincide with overhead resistance at the 2018 lows. The weekly PMO has been in decline overall, but it has turned up.
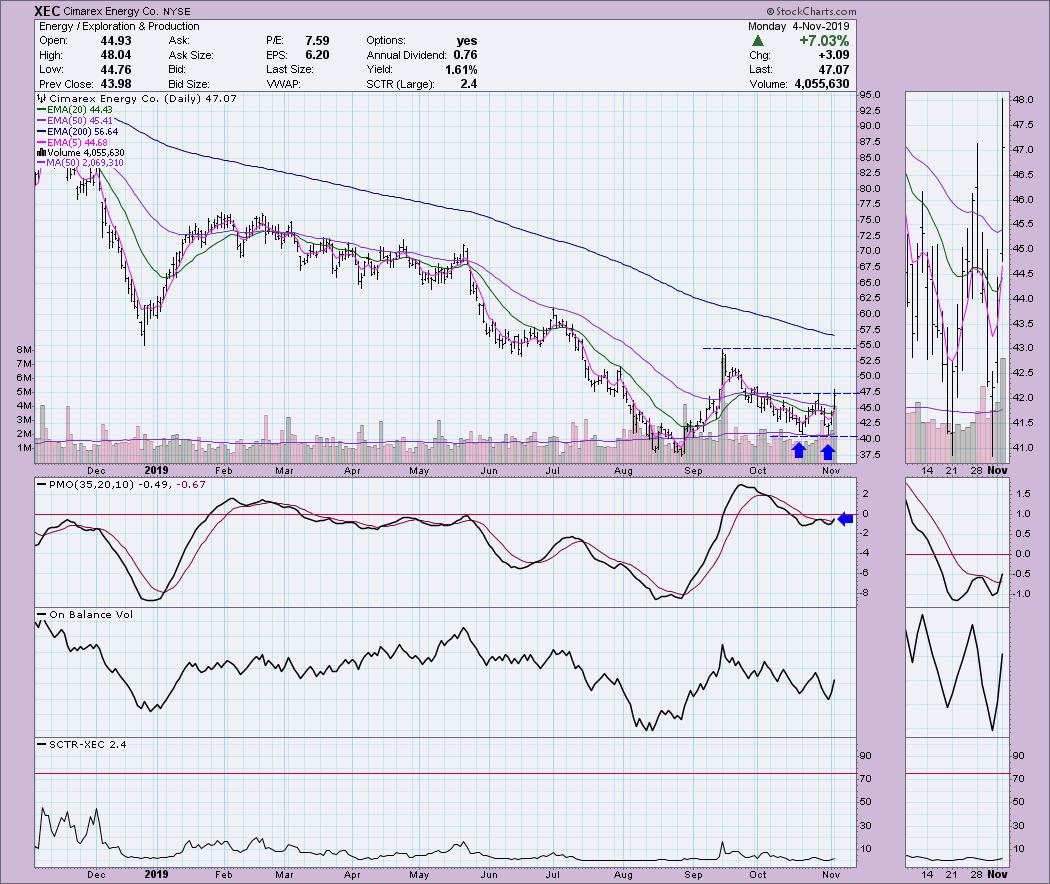
Cimarex Energy Co (XEC) - Earnings: 11/4/2019
Here is another stock that popped on earnings. This was one of the top ten upside movers today in the S&P 500. The double-bottom pattern has formed and nearly executed today. If it does close above $47.50, I'd consider it activated. Interestingly, the minimum upside target would bring price up to the September top. I'm not overly optimistic about this one getting past that September high, given that that area of resistance lines up with the December 2018 low and the lows in June.
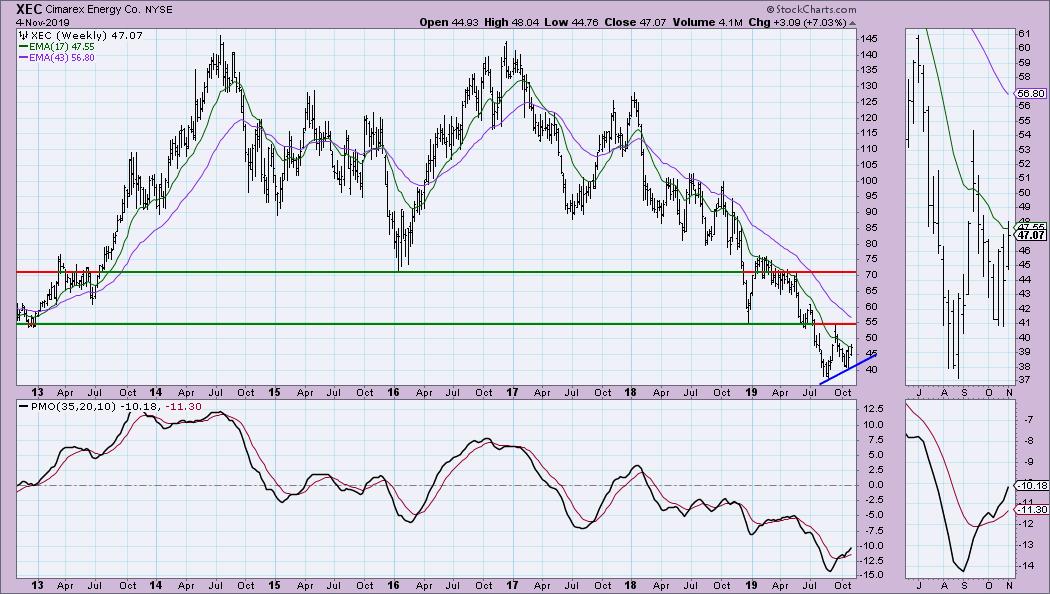
On the weekly chart, there is a larger double-bottom forming. $55 is strong overhead resistance on the weekly chart as well. If it can overcome that level, then the next area of resistance would be around $70.
Full Disclosure: I don't own any of the stocks I've presented today and I don't plan on adding any to my portfolio at this time. I have to trust that the market is in a solid uptrend before I add positions and I'm just not certain (enough) to invest in the markets further. I'm currently about 60% in cash.

Erin Swenlin will be presenting at the The MoneyShow Las Vegas May 11-13, 2020! You'll have an opportunity to meet Erin and discuss the latest DecisionPoint news and Diamond Scans. The conference is free to attend or view online!
Watch the latest episode of DecisionPoint with Carl & Erin Swenlin LIVE on Mondays 5:00p EST or on the StockCharts TV YouTube channel here!
Technical Analysis is a windsock, not a crystal ball.
Happy Charting!
- Erin
erinh@stockcharts.com
NOTE: The stocks reported herein are from mechanical trading model scans that are based upon moving average relationships, momentum and volume. DecisionPoint analysis is then applied to get five selections from the scans. The selections given should prompt readers to do a chart review using their own analysis process. This letter is not a call for a specific action to buy, sell or short any of the stocks provided. There are NO sure things or guaranteed returns on the daily selection of "diamonds in the rough."
Helpful DecisionPoint Links:
DecisionPoint Shared ChartList and DecisionPoint Chart Gallery
Price Momentum Oscillator (PMO)
Swenlin Trading Oscillators (STO-B and STO-V)
**Don't miss DecisionPoint Commentary! Add your email below to be notified of new updates"**


