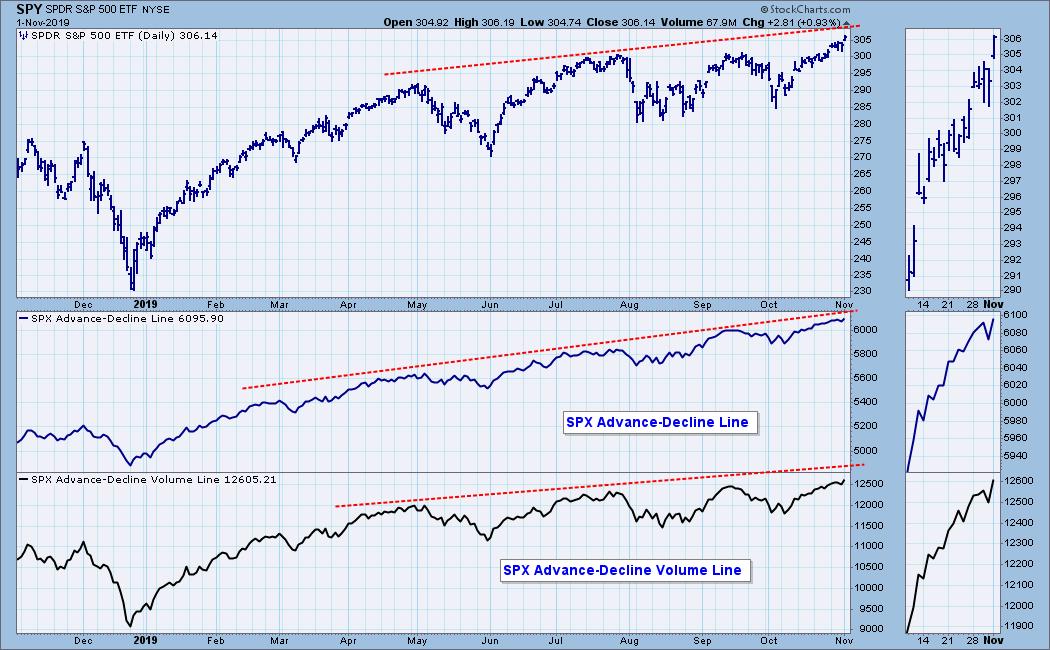
The venerable Advance-Decline and Advance-Decline Volume Lines are confirming the rising price tops over the last ten months, which is reassuring for the bulls. Unfortunately, some other breadth indicators disagree.
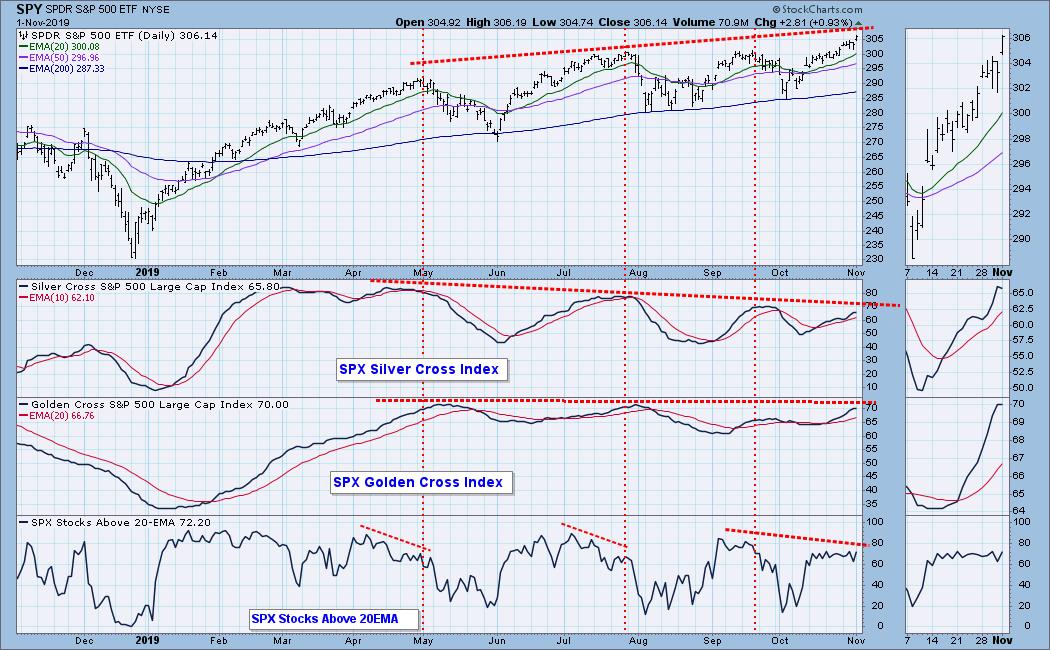
Specifically, neither the SPX Silver Cross Index (percent of SPX stocks with 20EMA higher than 50EMA) or the SPX Golden Cross Index (percent of stocks with 50EMA higher than 200EMA) are confirming the higher price tops. In fact they have negative divergences. Additionally, a short-term indicator, SPX Percent Stocks Above Their 20EMA, also has a negative divergence against the September and October price tops.
It is fairly easy to resolve this disagreement. The A-D Lines do not take into account the magnitude of the advance or decline. For example, if price moved up one point for each of three days, and then down six points on one day, the net A-D Line would be +2, even though the net price change for the four days would be -3.
There is much less ambiguity with the indicators on the second chart. The relative position of EMAs, or the position of price versus its EMA is very specific, and much more reliable than the raw Advance-Decline data or the indicators derived from that data.
The DecisionPoint Weekly Wrap presents an end-of-week assessment of the trend and condition of the stock market (S&P 500), the U.S. Dollar, Gold, Crude Oil, and Bonds.
Watch the latest episode of DecisionPoint on StockCharts TV's YouTube channel here!
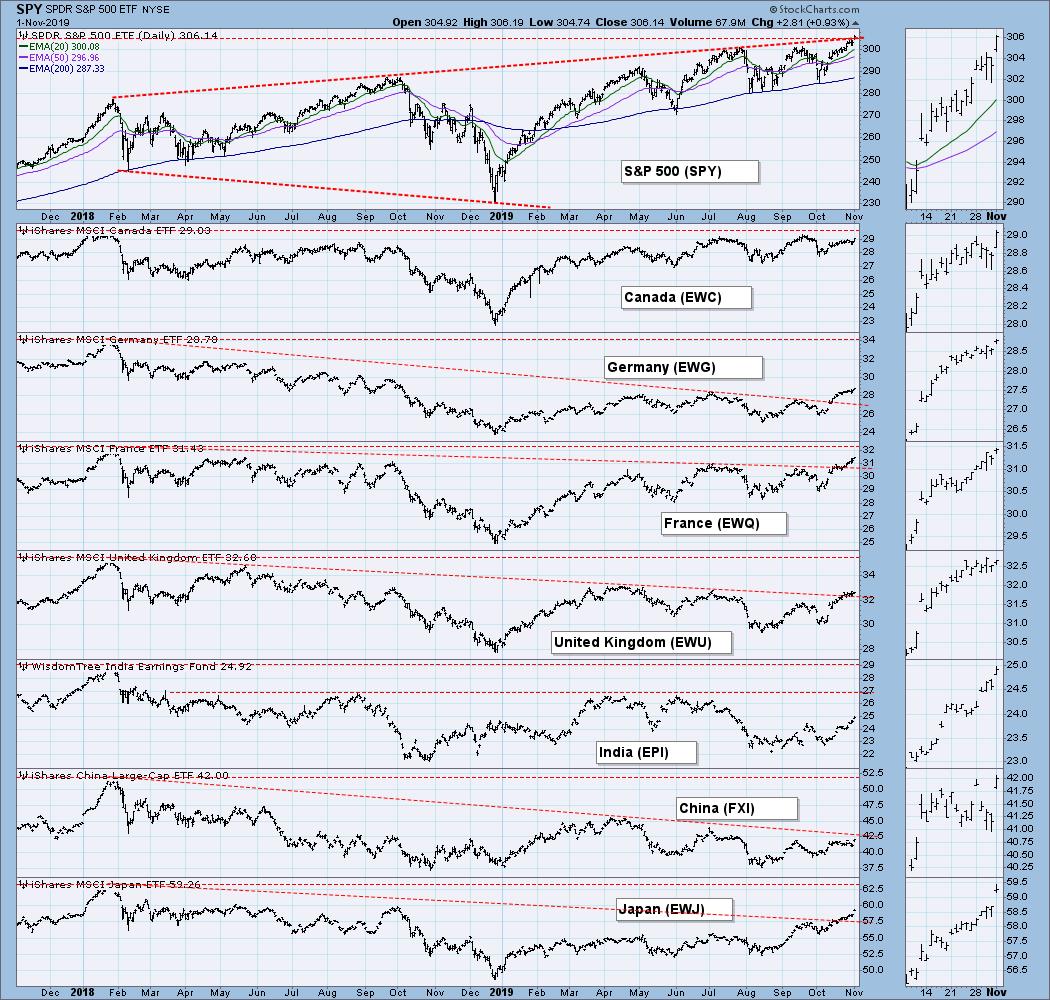
GLOBAL MARKETS
Global markets have not recovered from the bear decline from their 2018 high, the S&P 500 being the exception.
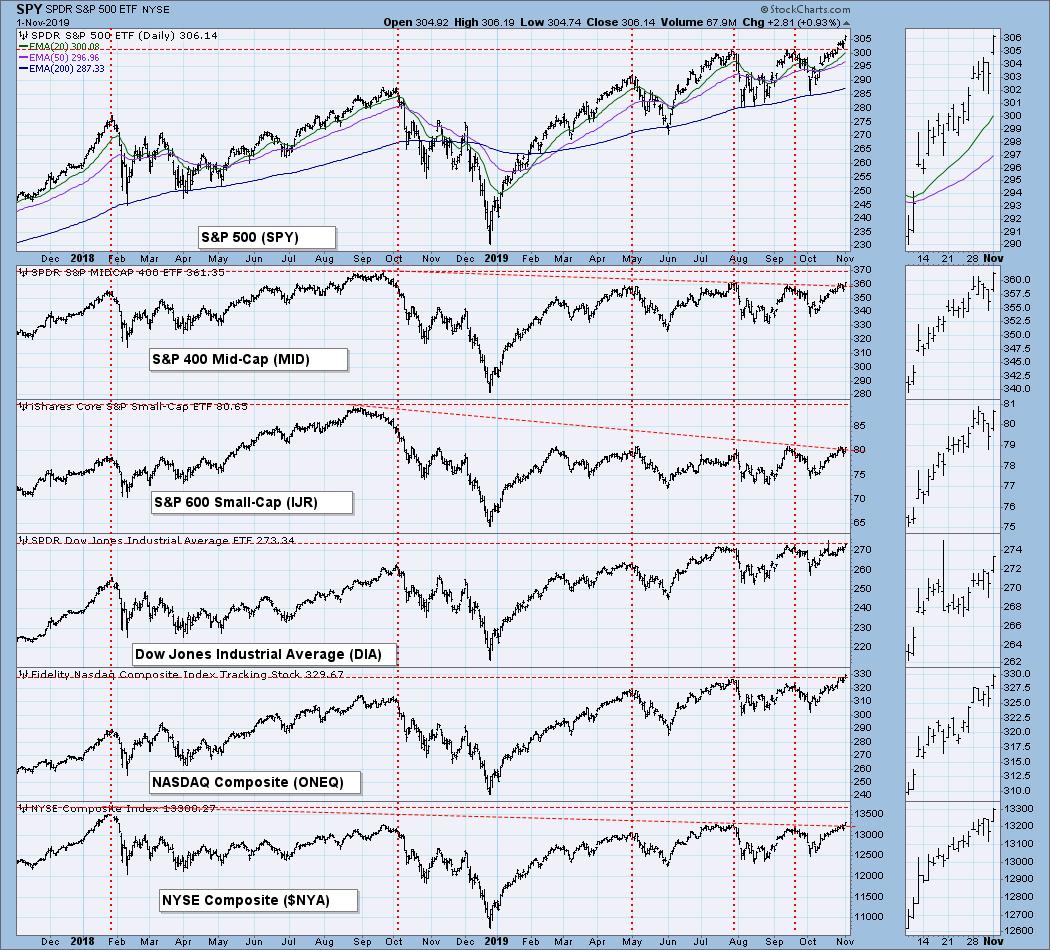
BROAD MARKET INDEXES
Small- and mid-cap indexes, as well as the NYSE Composite, are lagging the other major indexes.
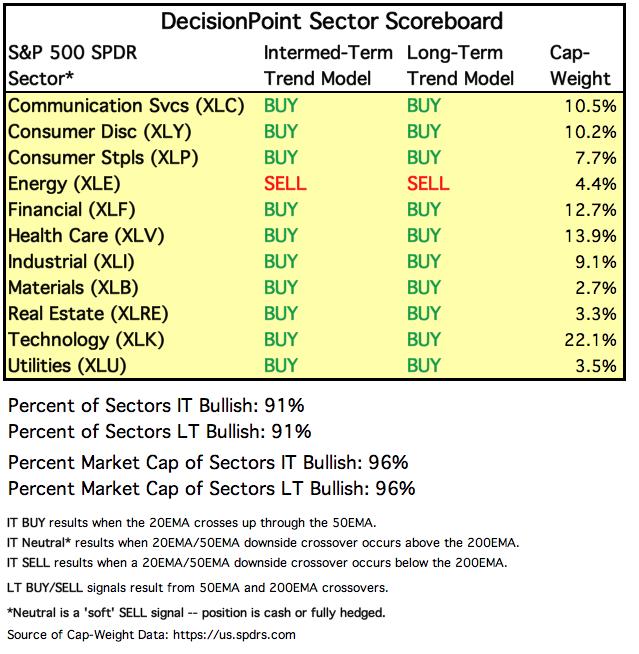
SECTORS
Each S&P 500 Index component stock is assigned to one, and only one, of 11 major sectors. This is a snapshot of the Intermediate-Term and Long-Term Trend Model signal status for those sectors.
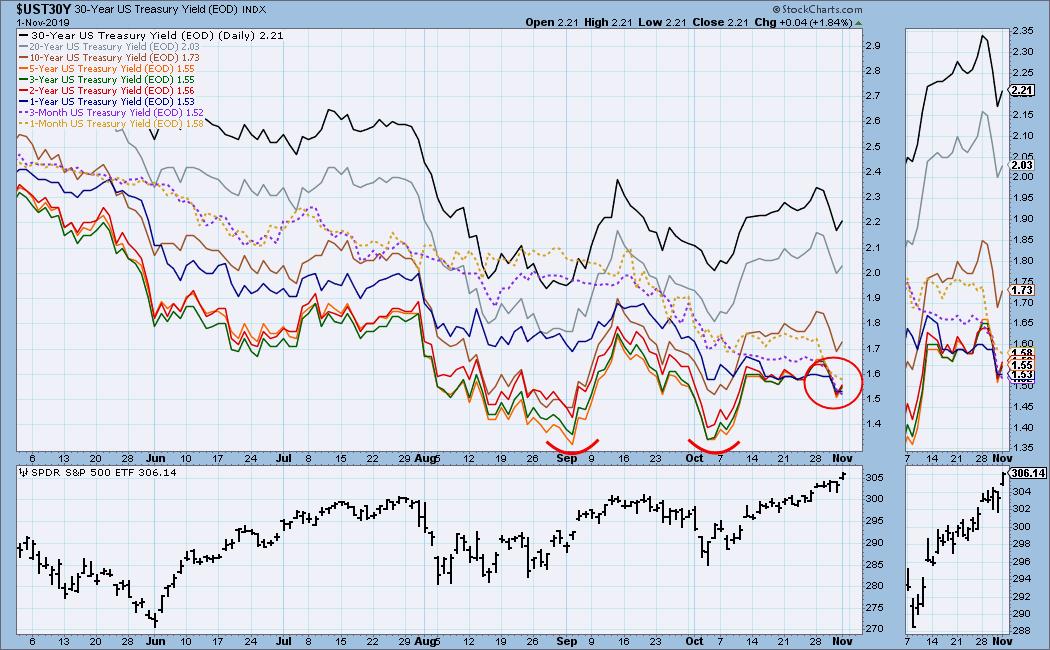
INTEREST RATES
With this chart we can monitor rate inversions. In normal circumstances the longer money is borrowed the higher the interest rate that must be paid. When rates are inverted, the reverse is true. On the chart below, notice that the one-month and three month T-Bills (dotted lines) pay a higher interest rate than some longer durations.
STOCKS
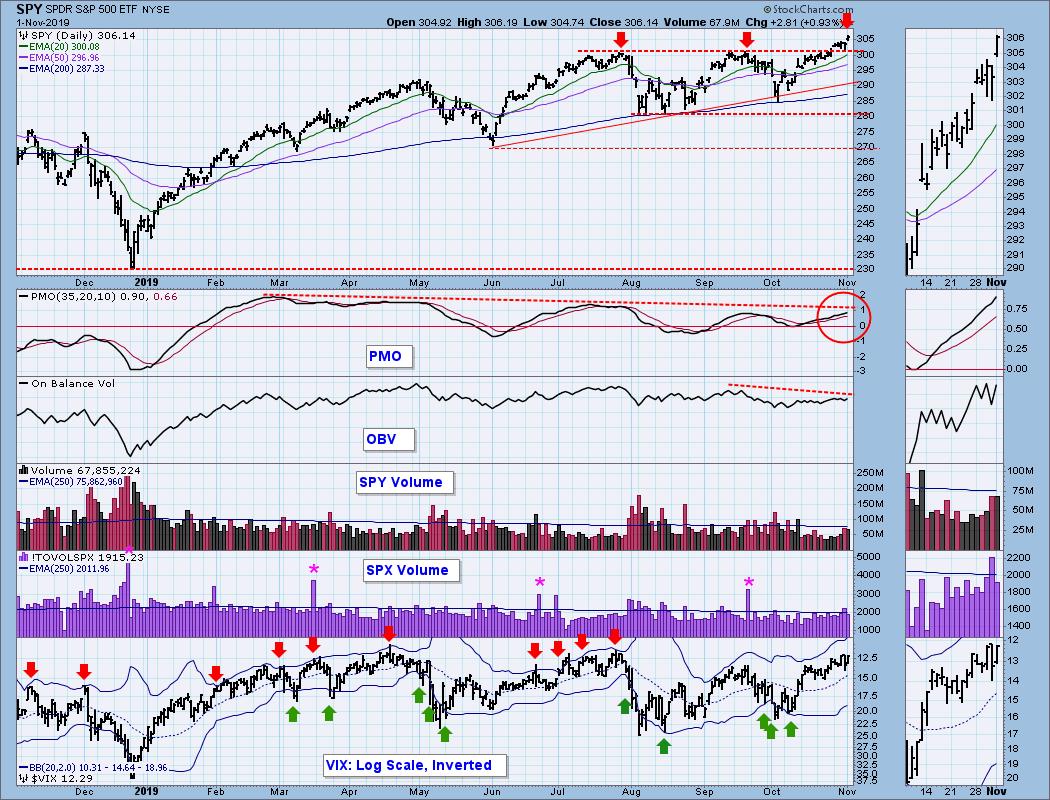
IT Trend Model: BUY as of 9/6/2019
LT Trend Model: BUY as of 2/26/2019
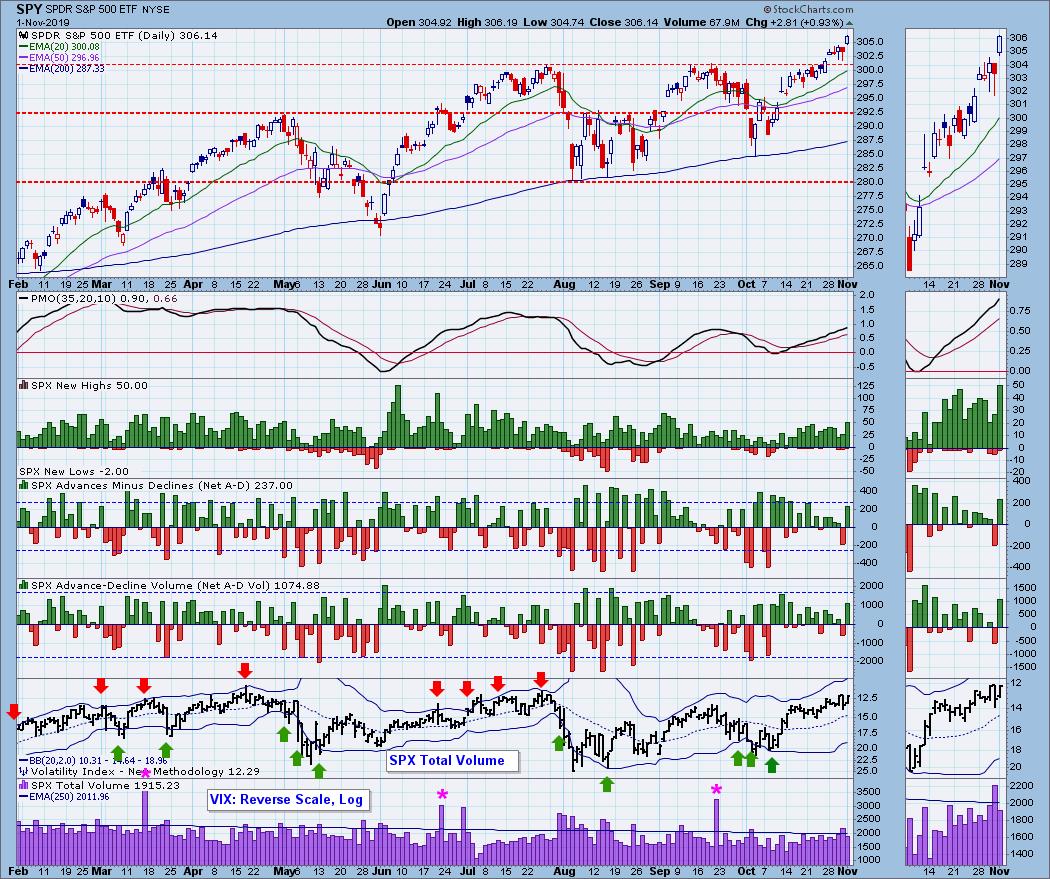
SPY Daily Chart: While the market made all-time highs on Friday, as well as closing near the session highs, volume was again disappointing. There are also PMO and OBV negative divergences, and the VIX is overbought.
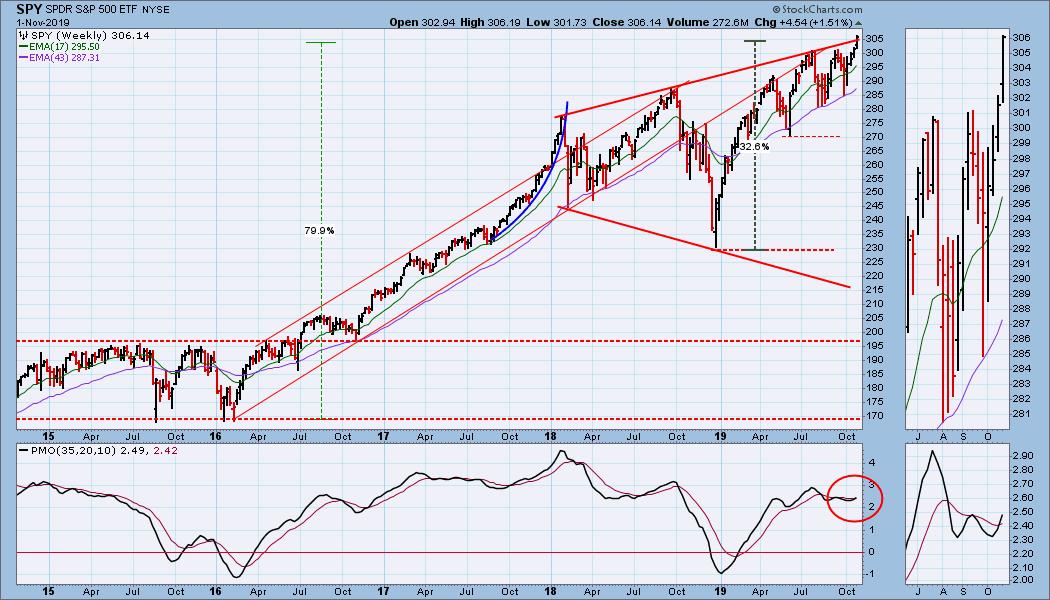
SPY Weekly Chart: Other than the broadening top, this chart looks bullish with the breakout above the rising tops line, and a very positive weekly PMO.
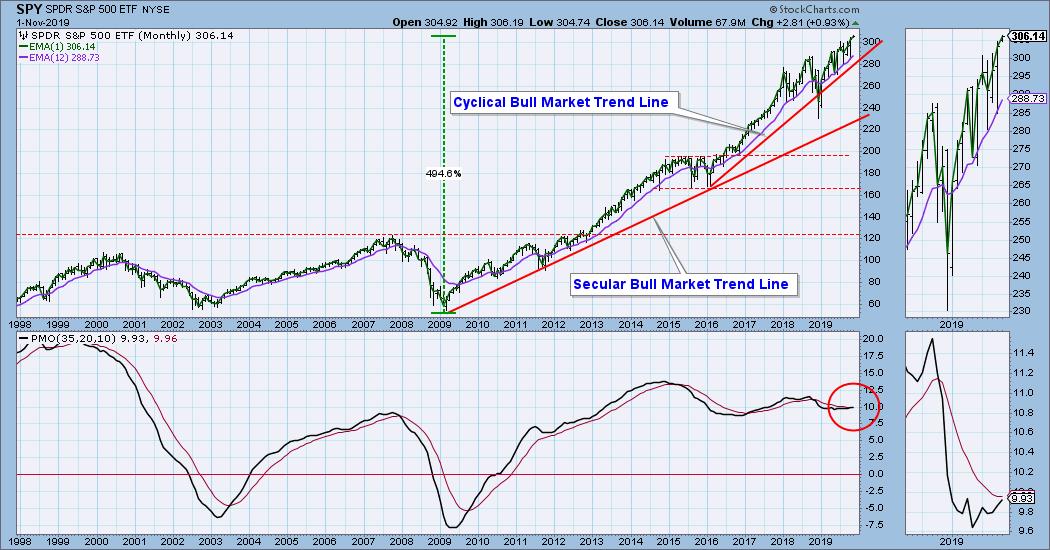
SPY Monthly Chart: The monthly PMO has been positive for nine years, and price recaptured the cyclical bull market rising trend line.
Climactic Market Indicators: On Friday we got modestly climactic readings on most indicators, except SPX Total Volume. Since price has been rising, we should consider that it could be an exhaustion climax.
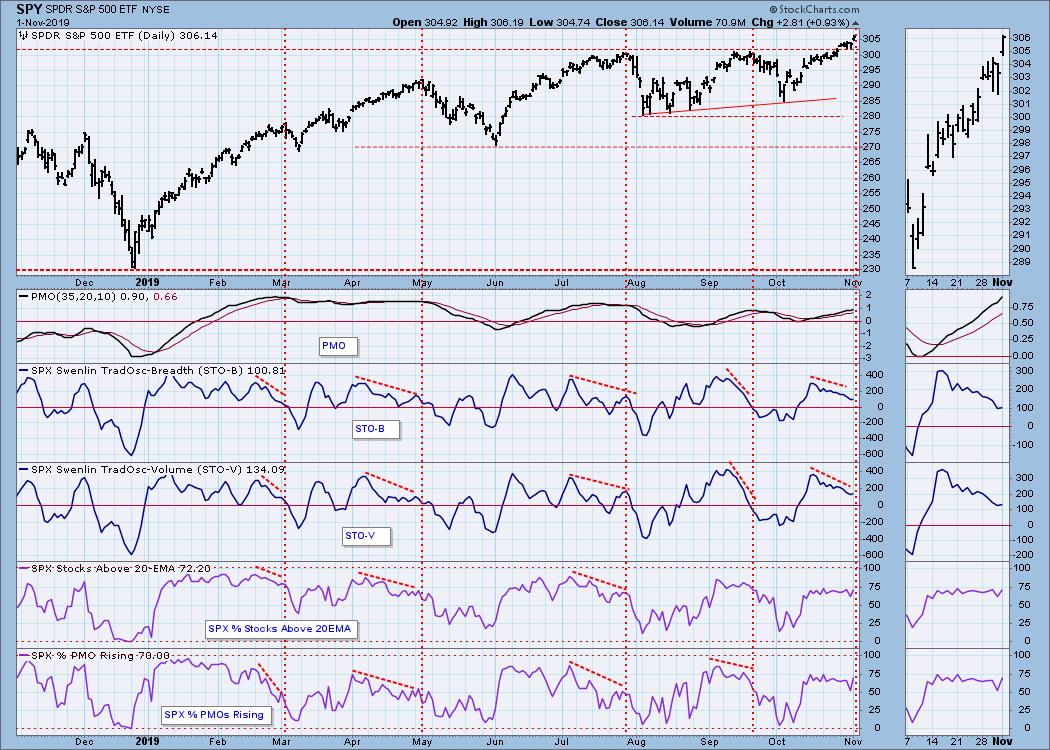
Short-Term Market Indicators: The STO-B and STO-V have negative divergences against the three-week rally.
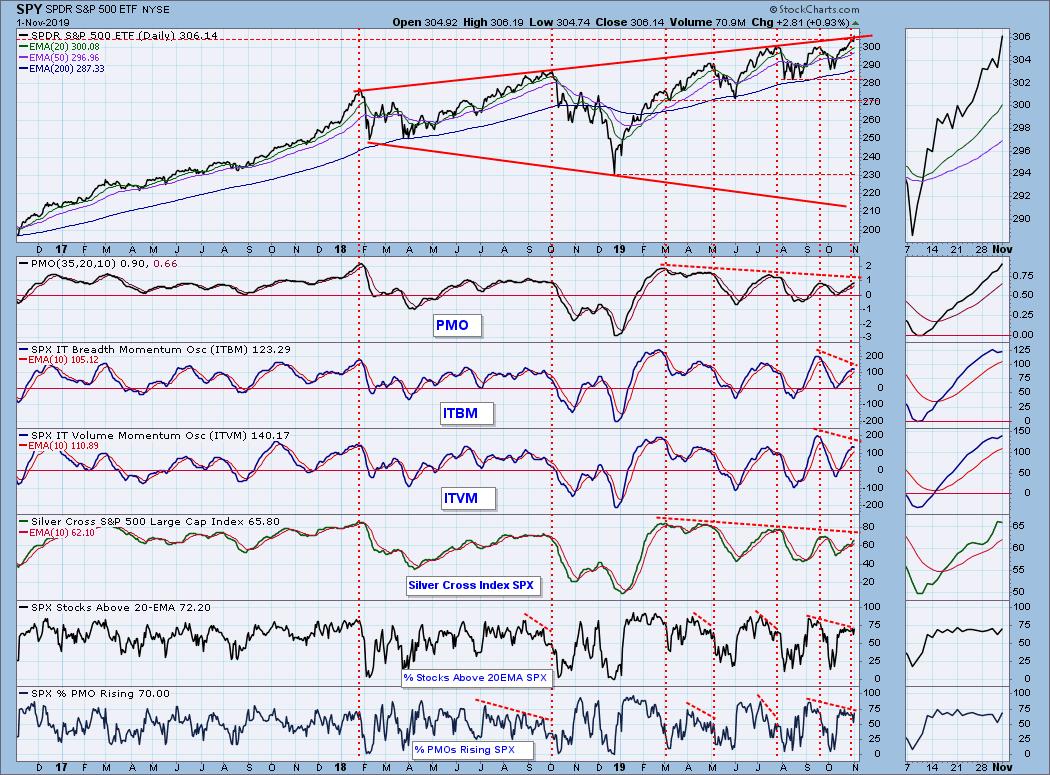
Intermediate-Term Market Indicators: The Silver Cross Index shows that 66% of SPX stocks are contributing to price making Friday's all-time high, compared to about 80% back in April. And there are negative divergences on other indicators shown on this chart.
CONCLUSION: The IT Trend Model is on a BUY, the trend is up, and, of course, the market (SPY) is at record highs, so what's not to like? I don't like all the negative divergences, and I don't like that the Silver Cross Index is at a significantly lower level that it was at the the May, July, and September price tops. That is a significant drop in the number of stocks participating in the advance. Obviously, it is a sufficient number of stocks to do the job, but the persistent internal contraction can't lead anywhere good.
Note: As of today, we have entered a six-month period of favorable seasonality.
DOLLAR (UUP)
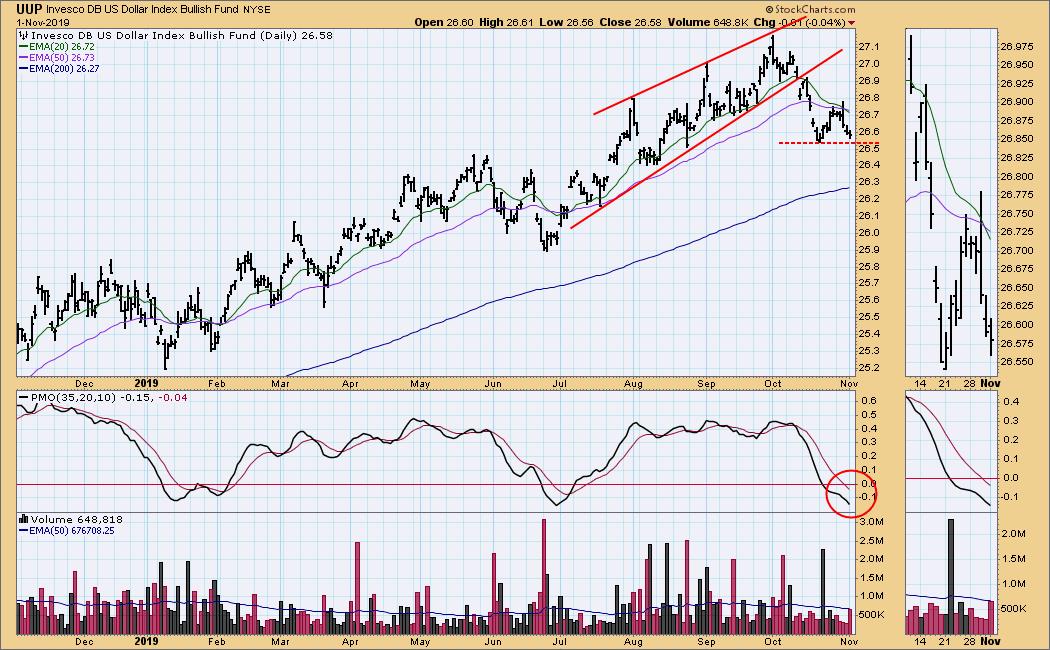
IT Trend Model: NEUTRAL as of 10/31/2019
LT Trend Model: BUY as of 5/25/2018
UUP Daily Chart: Nearly all of last week's advance was taken back this week. The daily PMO is falling, but it has reached a level that has proven to be oversold earlier this year.
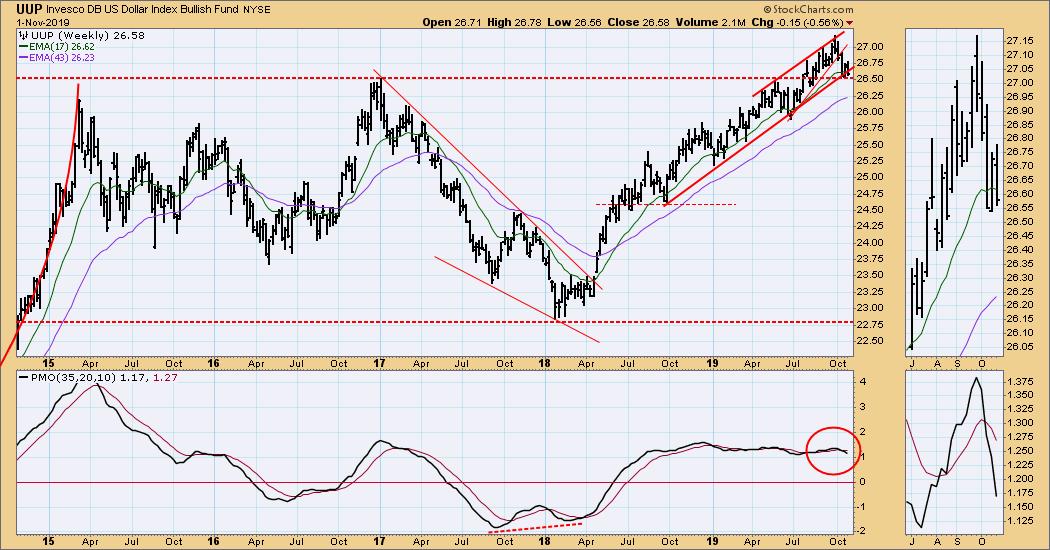
UUP Weekly Chart: Price has settled back onto a long-term horizontal support line, and the rising trend line remains intact.
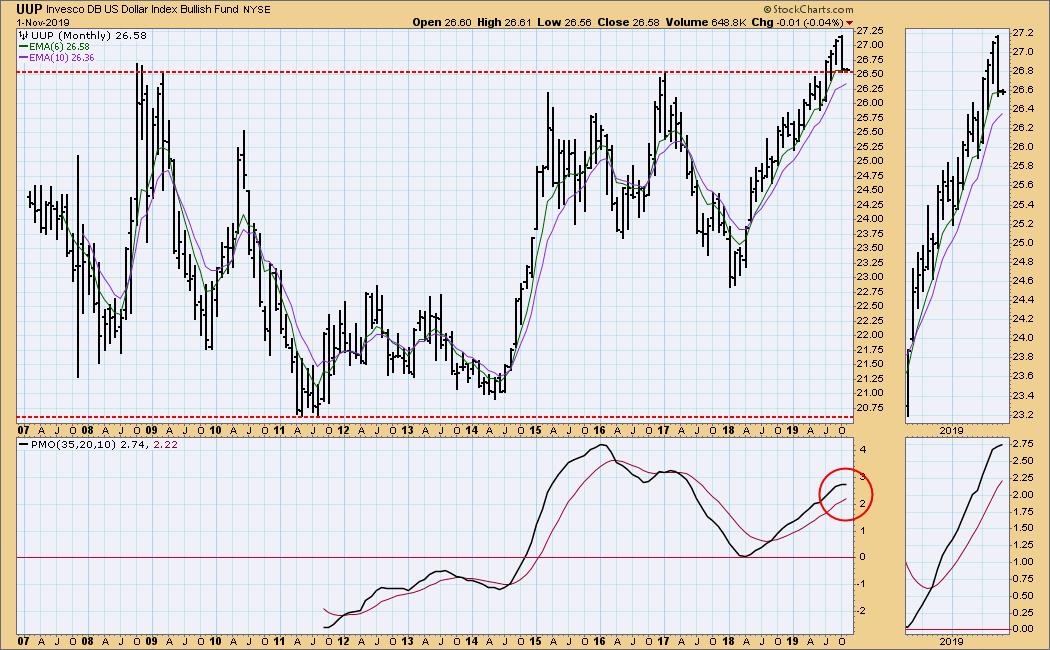
UUP Monthly Chart: The long-term support seen on the weekly chart is reinforced in this time frame, seeing that it goes all the way back to 2008.
GOLD
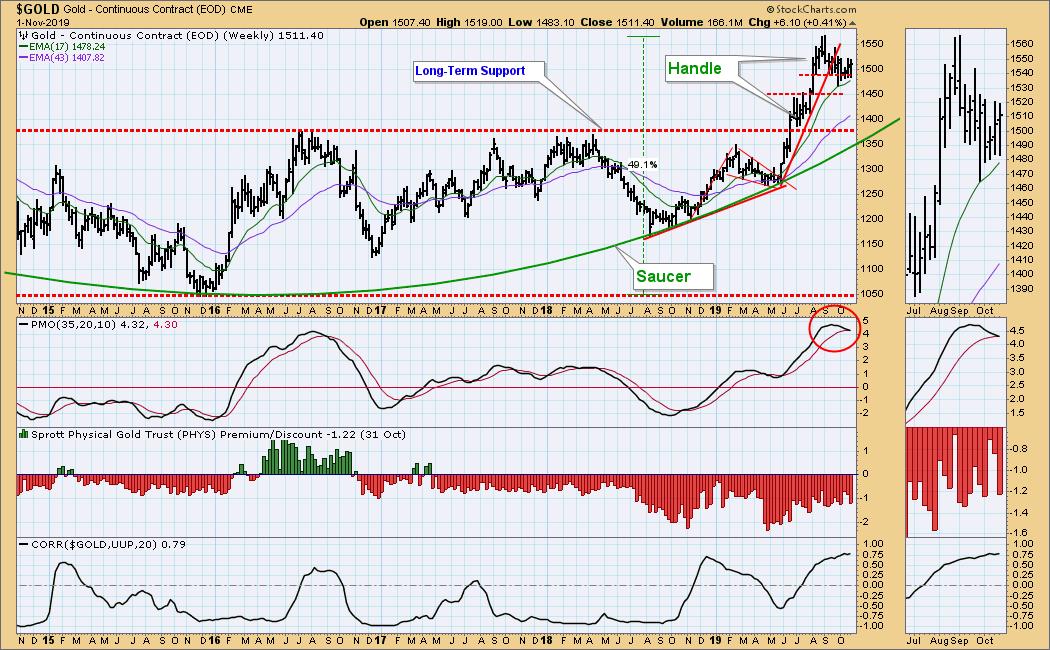
IT Trend Model: BUY as of 6/3/2019
LT Trend Model: BUY as of 1/8/2019
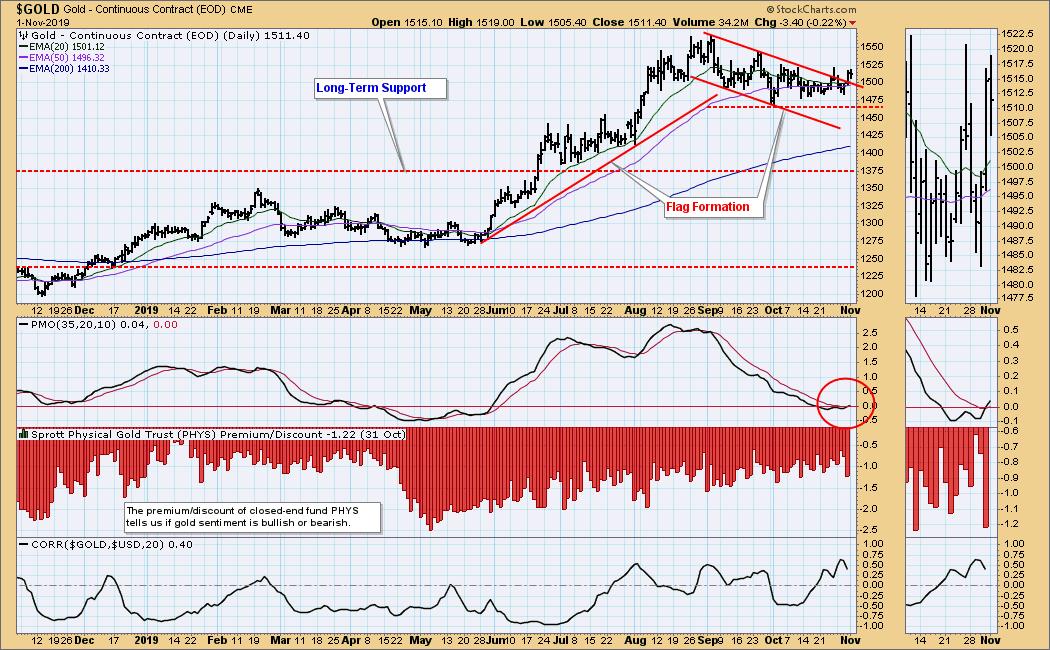
GOLD Daily Chart: Gold has been behaving well, and it has broken out of the falling trend channel, and the daily PMO has bottomed and crossed up through the signal line.
GOLD Weekly Chart: We can see the rally up through significant long-term resistance, which is now support. I'm thinking that sometime during the current pullback would be a good time to buy. My only hesitation is inspired by the heavy net short position held by the commercials.
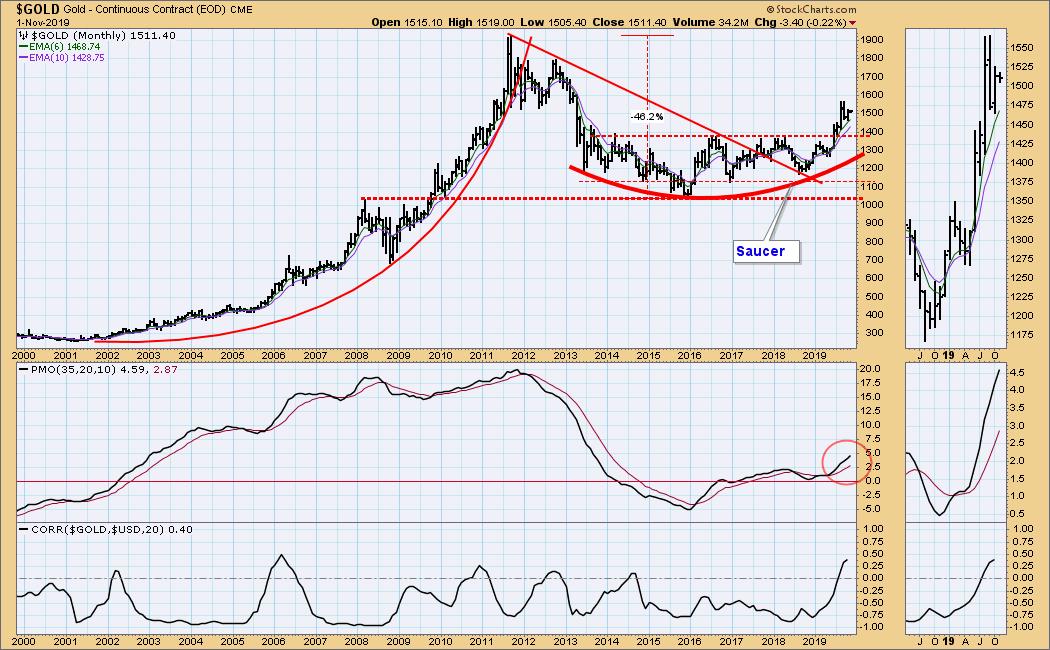
GOLD Monthly Chart: The complete bullish saucer with handle concept is visible in this time frame.
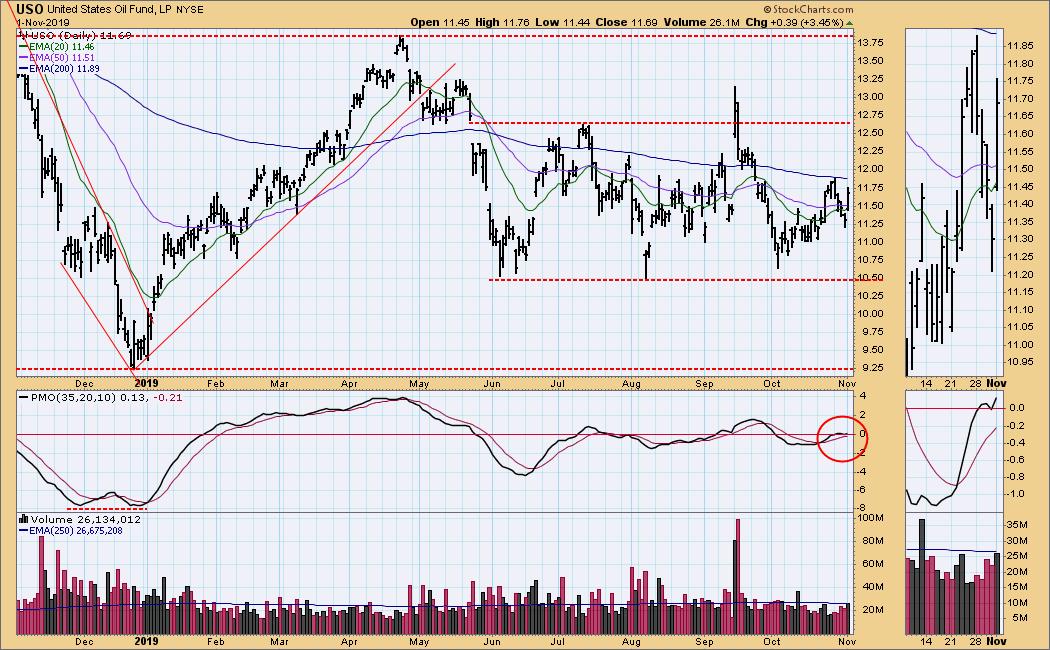
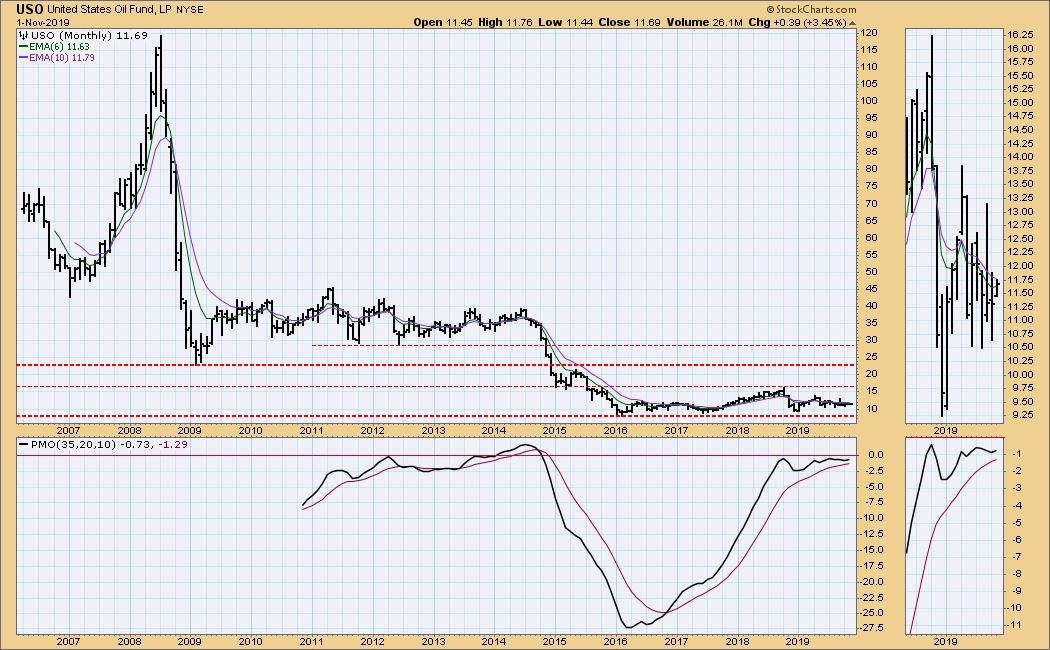
CRUDE OIL (USO)
IT Trend Model: SELL as of 10/2/2019
LT Trend Model: SELL as of 6/4/2019
USO Daily Chart: Crude remains within a five-month trading range.
USO Weekly Chart: I expect the WTIC trading range of 42 to 76 to hold indefinitely.
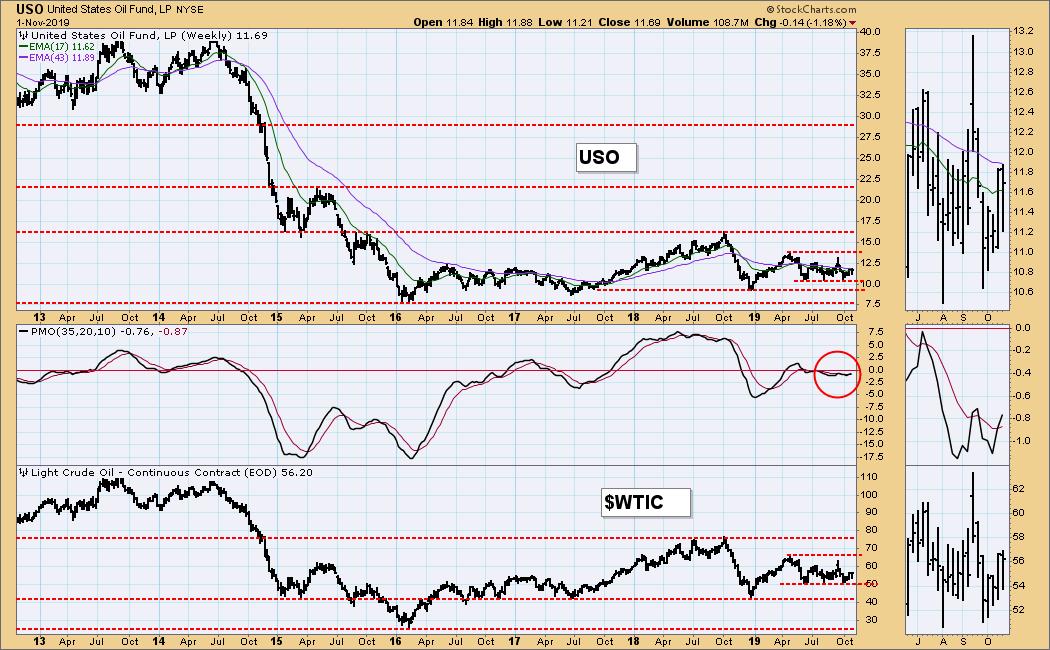
USO Monthly Chart: USO has been in a basing pattern for five years, and I think it will stay there indefinitely pending major news, the nature of which is unknown.
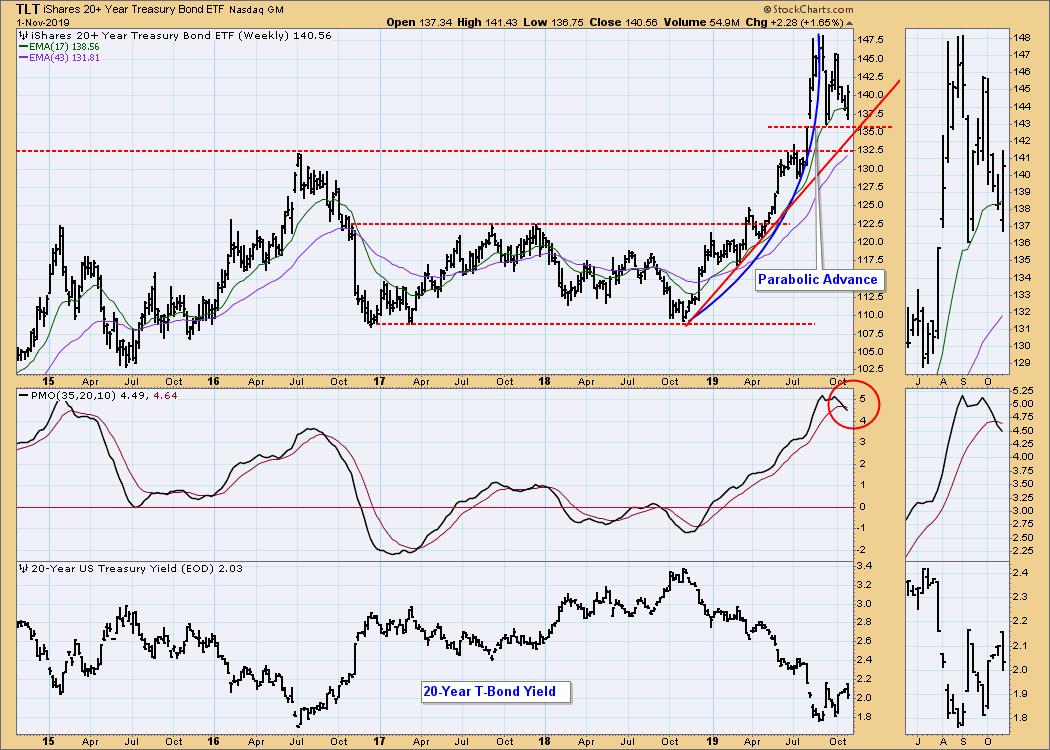
BONDS (TLT)
IT Trend Model: NEUTRAL as of 10/28/2019
LT Trend Model: BUY as of 1/2/2019
TLT Daily Chart: We got a modest bounce after the Fed announcement this week.
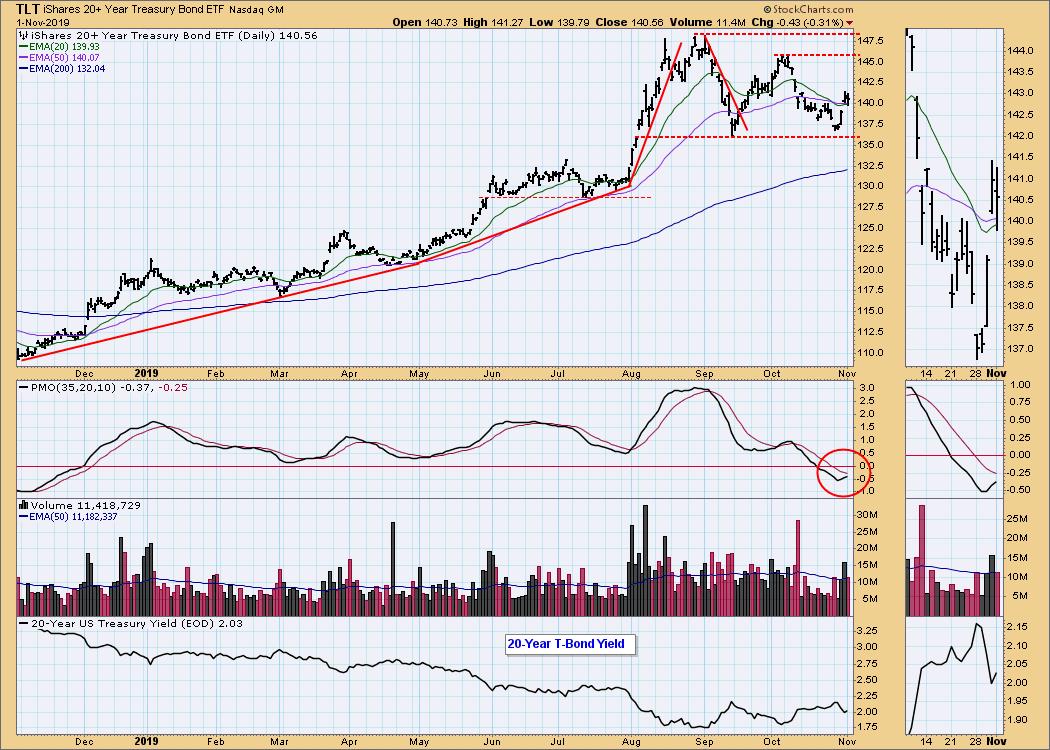
TLT Weekly Chart: The next support is at 136. The weekly PMO is overbought and has crossed down through the signal line.
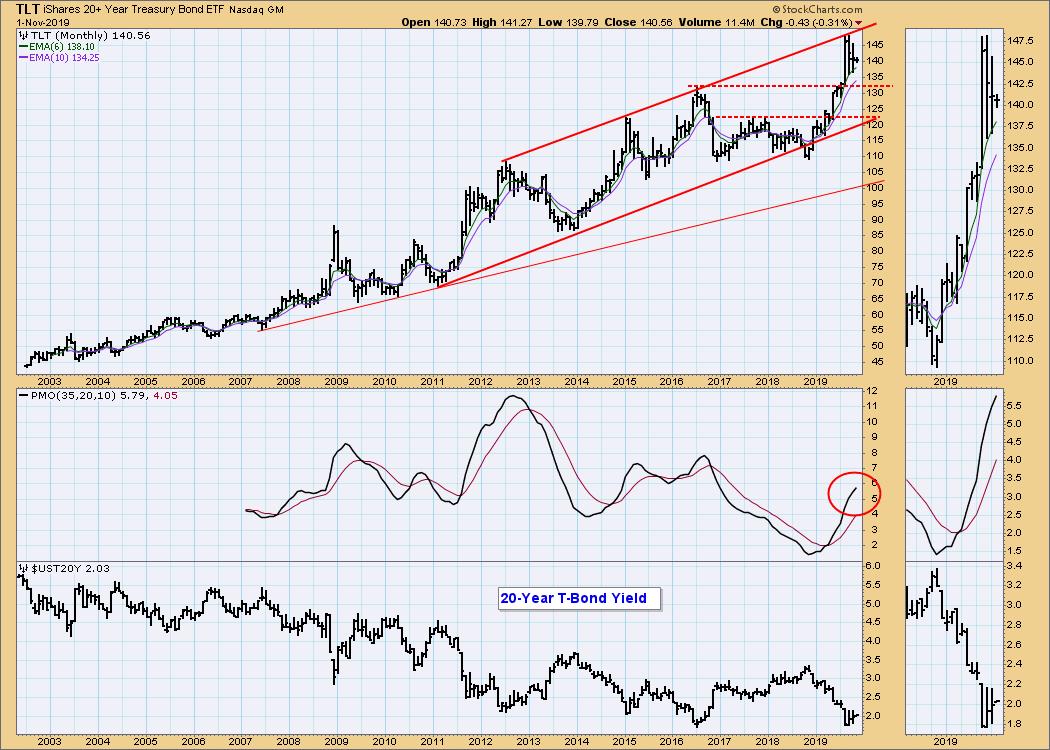
TLT Monthly Chart: Price is at the top of a nine-year rising trend channel. With the Fed going into hold status after this week's rate hike, I anticipate that TLT will move sideways for a while, staying above the support drawn from the 2016 top.
**Don't miss any of the DecisionPoint commentaries! Go to the "Notify Me" box toward the end of this blog page to be notified as soon as they are published.**
Technical Analysis is a windsock, not a crystal ball.
Happy Charting! - Carl
NOTE: The signal status reported herein is based upon mechanical trading model signals, specifically, the DecisionPoint Trend Model. They define the implied bias of the price index based upon moving average relationships, but they do not necessarily call for a specific action. They are information flags that should prompt chart review. Further, they do not call for continuous buying or selling during the life of the signal. For example, a BUY signal will probably (but not necessarily) return the best results if action is taken soon after the signal is generated. Additional opportunities for buying may be found as price zigzags higher, but the trader must look for optimum entry points. Conversely, exit points to preserve gains (or minimize losses) may be evident before the model mechanically closes the signal.
Helpful DecisionPoint Links:
DecisionPoint Shared ChartList and DecisionPoint Chart Gallery
Price Momentum Oscillator (PMO)
Swenlin Trading Oscillators (STO-B and STO-V)


