Late last year I wrote about Apple (AAPL) when it had broken down from a parabolic advance, a break which ultimately resulted in a total decline of about -40%. To see it on a chart just boggles my mind. I mean, here is a company with over $200 billion in cash being discounted by that huge amount, but if you look at the chart, you can see that this is a regular thing with AAPL. In fact, three of the crashes took place after the iPhone was introduced. More important, AAPL has already begun another vertical ascent, which history tells us will most likely end in tears for those get in near the next top.
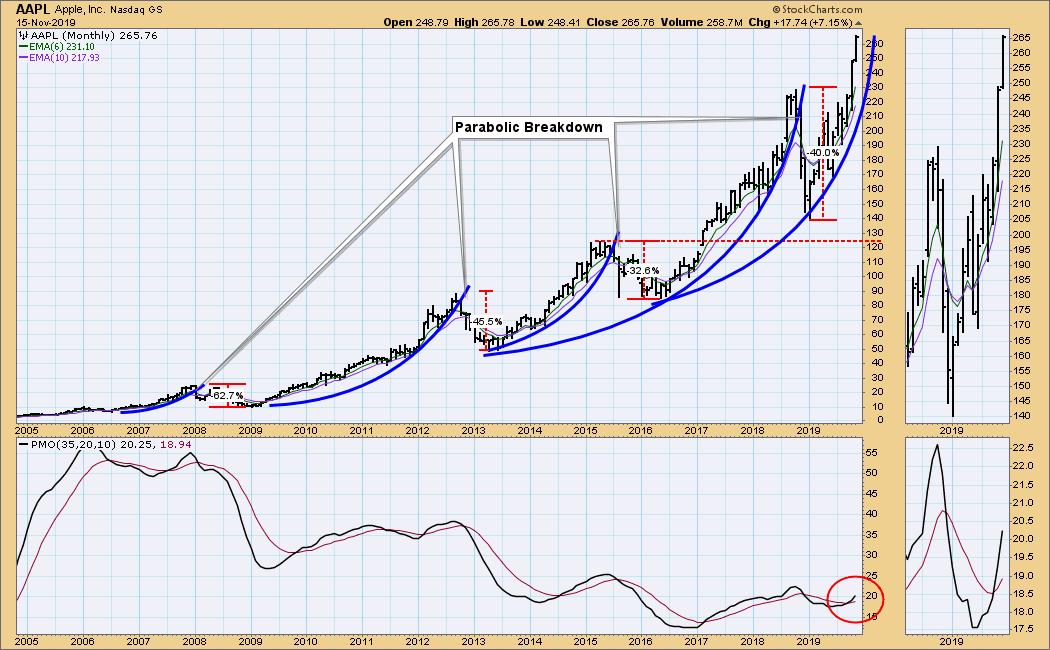
Parabolic advances are usually buying frenzies that curve steadily upward and ultimately end in a blowoff. When they break down, things can really get ugly, as you can clearly see. Many failures are caused by the serious flaws in the fundamental makeup of the company, and they can end in the stock falling back to historical lows. Of course, this is not the case with AAPL, which just tends to get too far ahead of itself and suffers from profit taking. Currently, I am concerned that AAPL has entered the vertical phase of the advance much sooner than previous examples shown, and my guess is that the top will come within months, not years.
There is no way that I know of to guess how far a parabolic will advance before it hits its apogee, but if you're taking one of those rides, be aware of the probable outcome and plan accordingly.
The DecisionPoint Weekly Wrap presents an end-of-week assessment of the trend and condition of the stock market (S&P 500), the U.S. Dollar, Gold, Crude Oil, and Bonds.
Watch the latest episode of DecisionPoint on StockCharts TV's YouTube channel here!
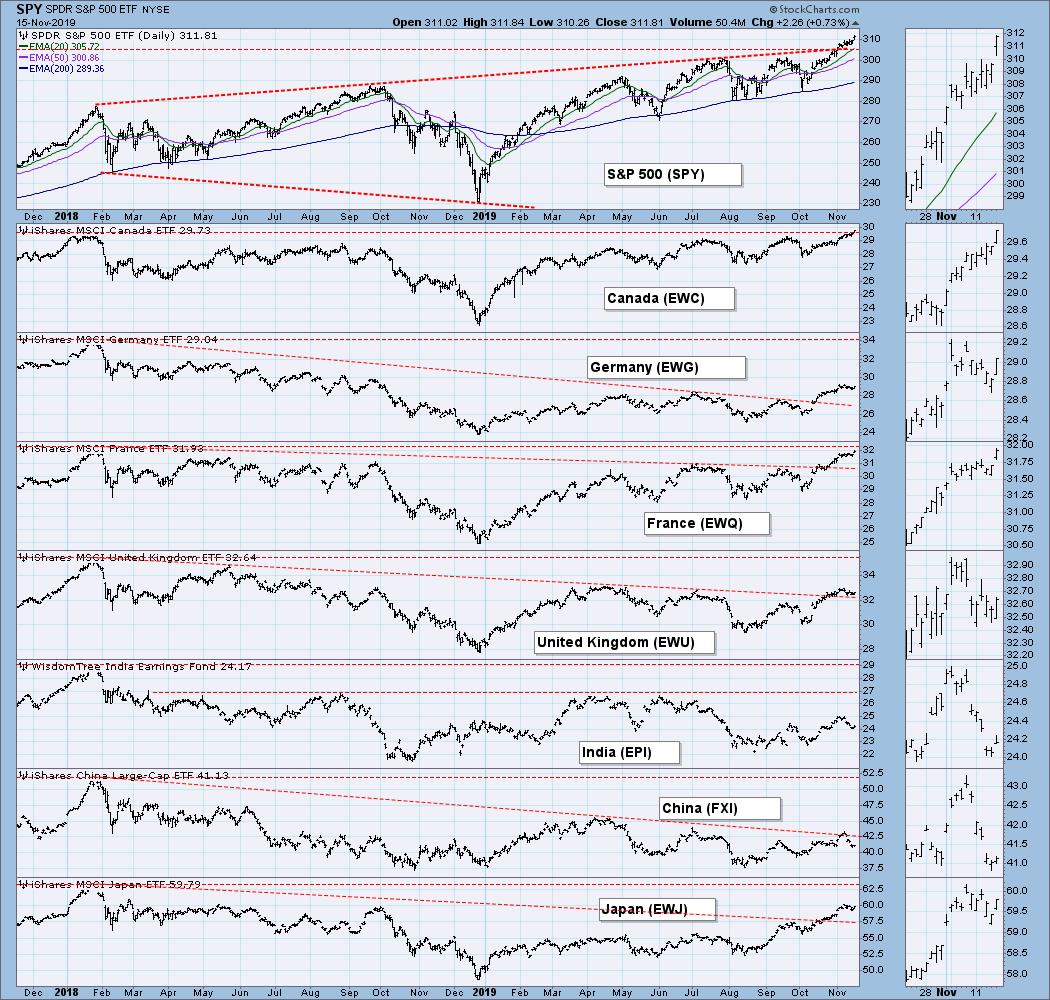
GLOBAL MARKETS
Canada has finally exceeded the 2018 high, and France is not far behind, but the U.S. is way ahead.
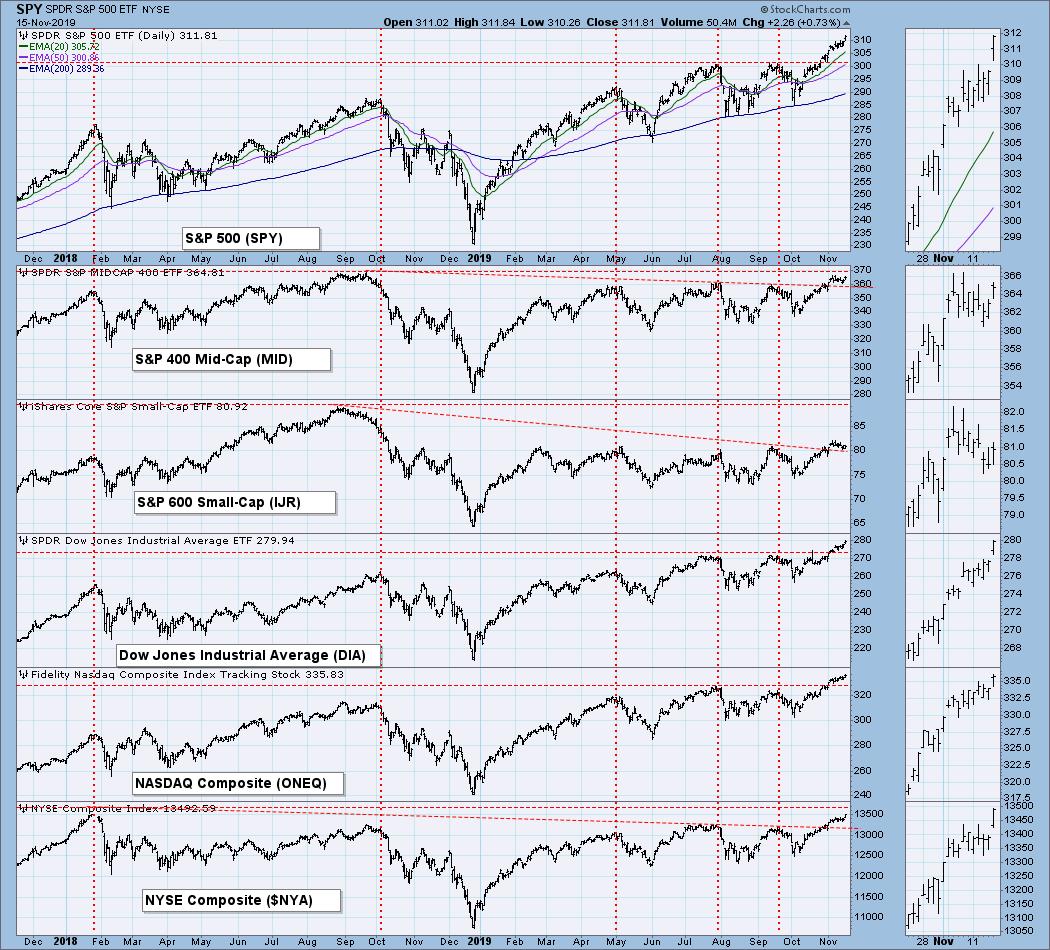
BROAD MARKET INDEXES
Large-cap indexes still lead.
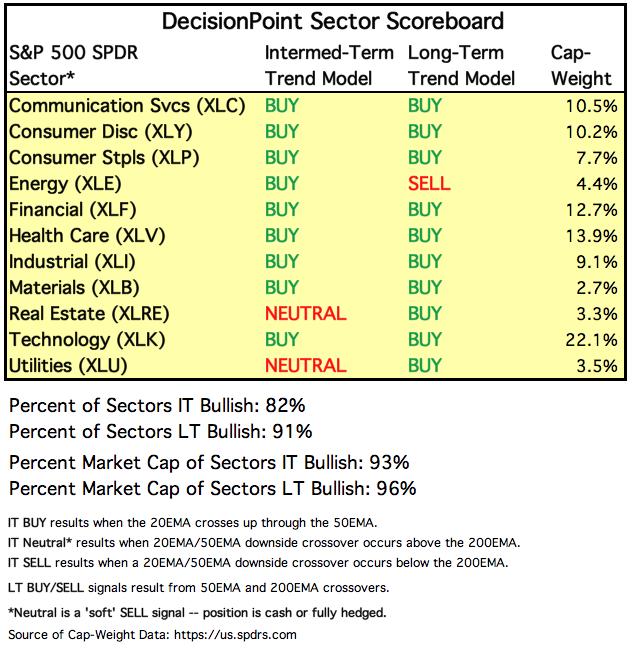
SECTORS
Each S&P 500 Index component stock is assigned to one, and only one, of 11 major sectors. This is a snapshot of the Intermediate-Term and Long-Term Trend Model signal status for those sectors.
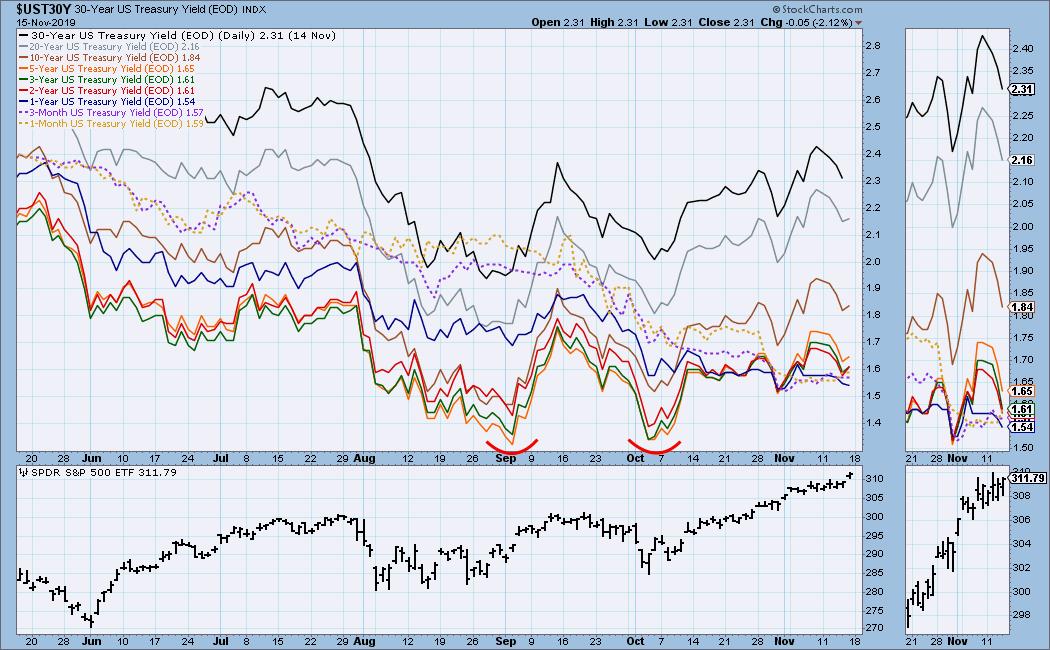
INTEREST RATES
This chart is included so we can monitor rate inversions. In normal circumstances the longer money is borrowed the higher the interest rate that must be paid. When rates are inverted, the reverse is true. We continue to see minor inversions, but the greater problem is yield compression.
STOCKS
IT Trend Model: BUY as of 9/6/2019
LT Trend Model: BUY as of 2/26/2019
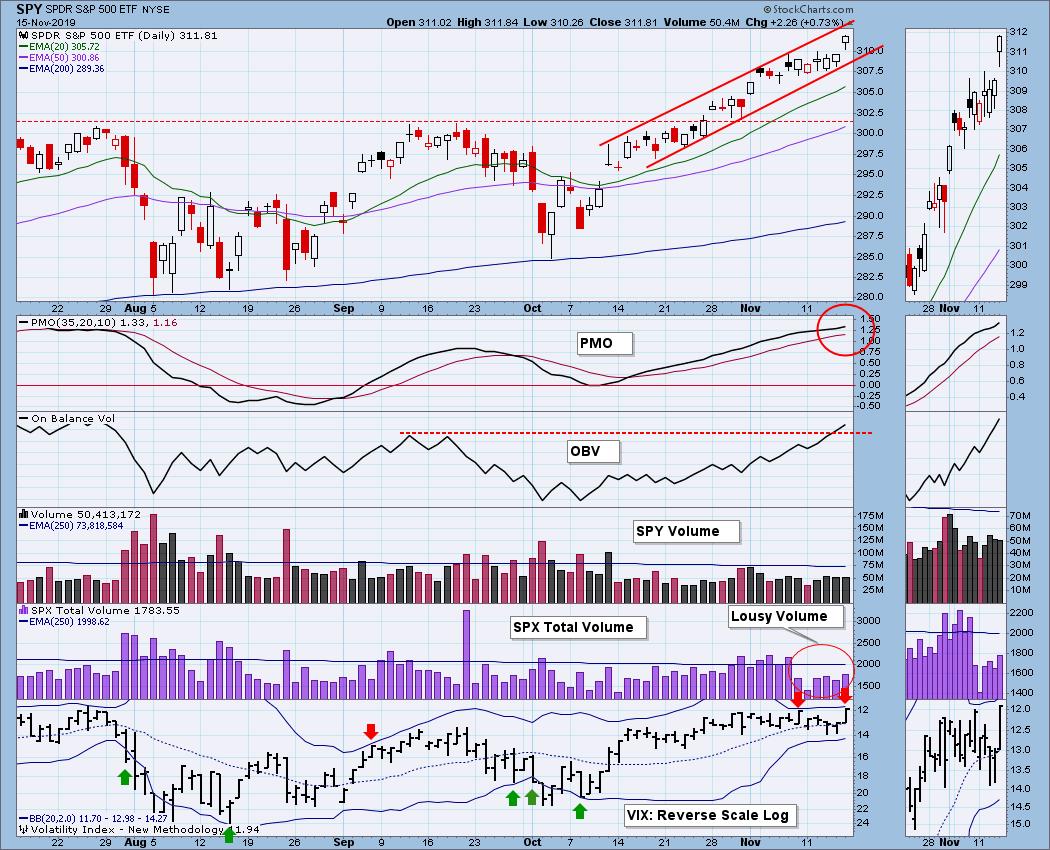
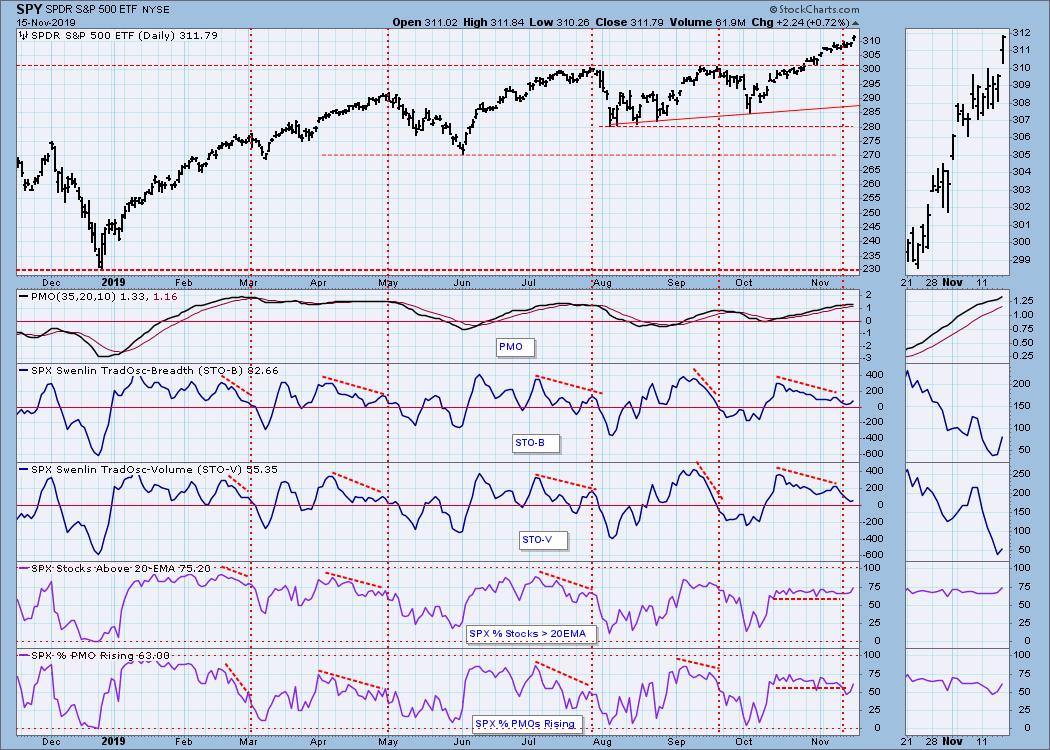
SPY Daily Chart: The VIX hit the upper Bollinger Band last week, signalling a short-term overbought condition, and alerting us to start looking for a price top. Sometimes the top comes quickly, but it looks as if the VIX is trying for another band touch. The feature that causes me most concern is that SPX Total Volume has been relatively light, especially on Friday, when options expiration should have given it a little extra goose. Skinny volume means that there is not a lot of confidence in the price advance.
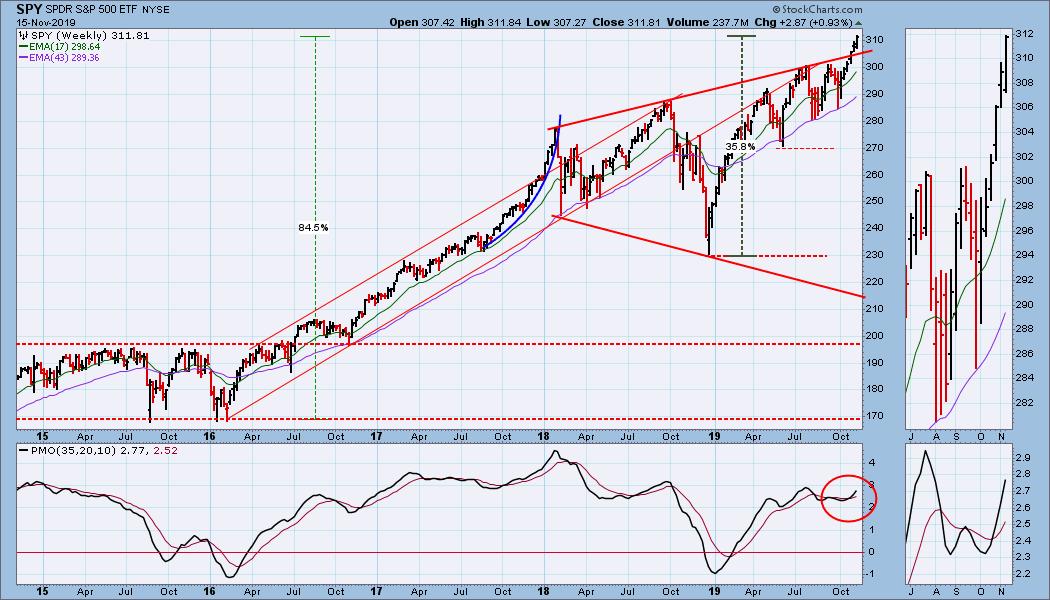
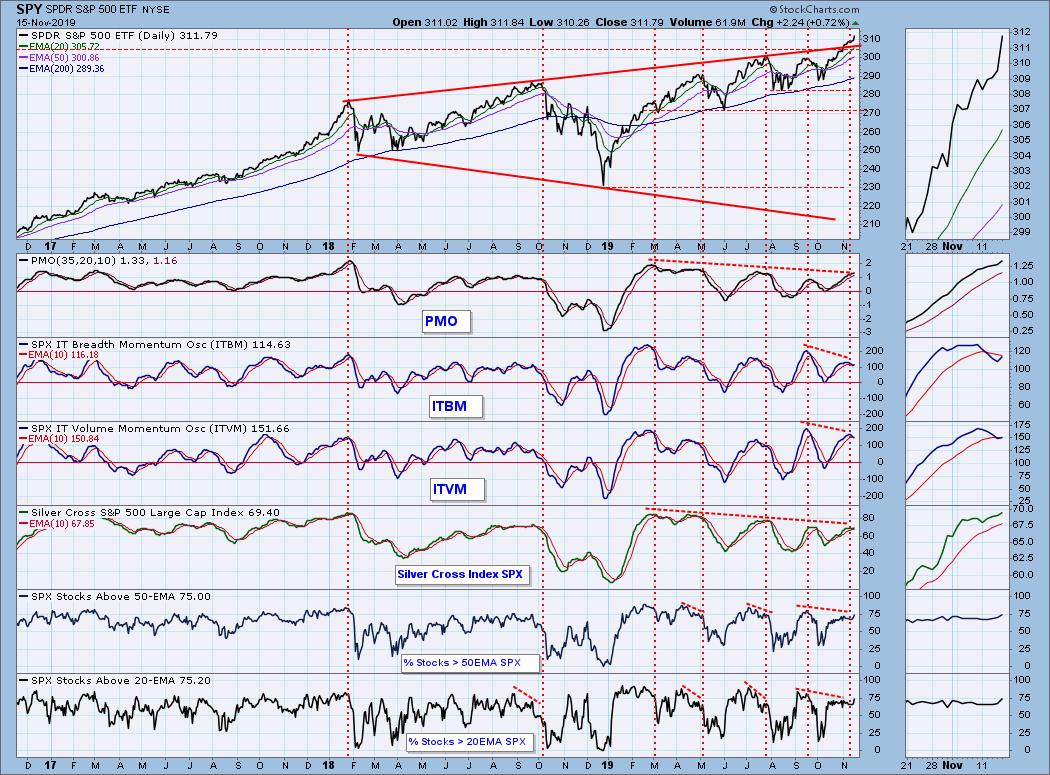
SPY Weekly Chart: The advance from the July lows has been very steep, and to me, that is problematic.
Climactic Market Indicators: We had modestly climactic readings on Friday, except SPX Total Volume, about which I have ranted elsewhere in this missive.
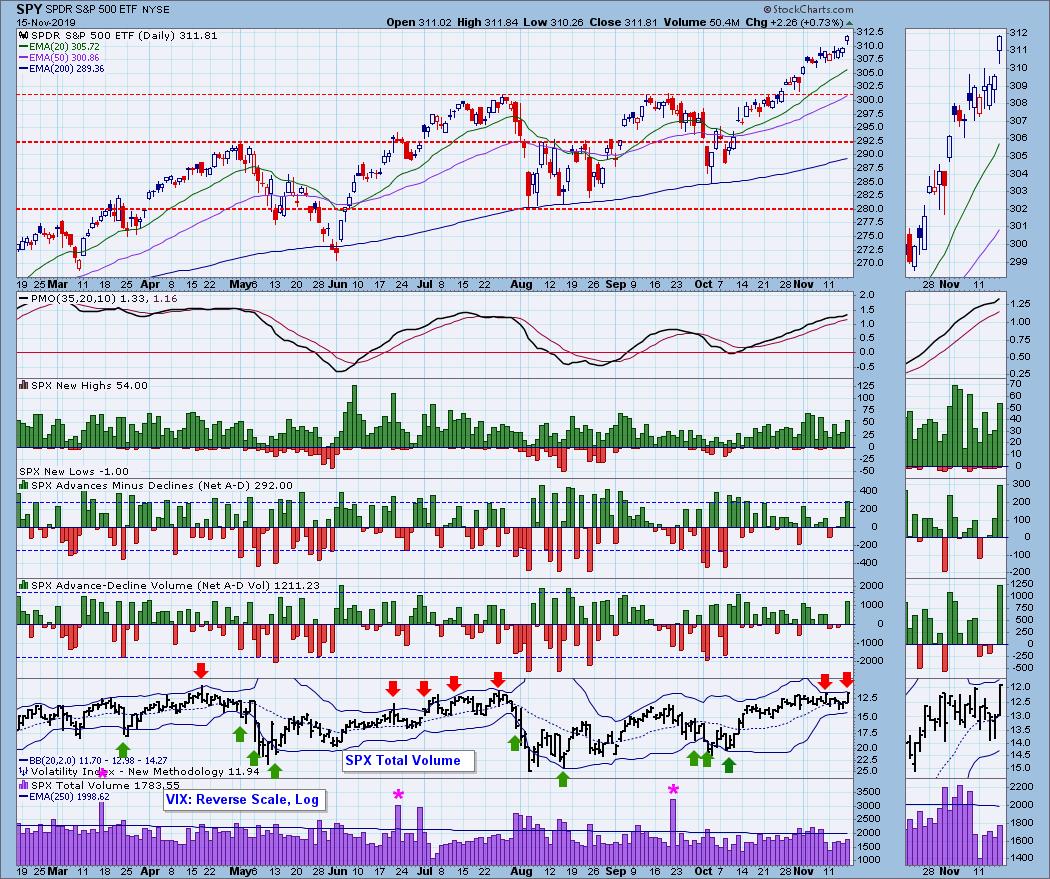
Short-Term Market Indicators: The STO's are showing a negative divergence, which means that internals are weakening in this time frame. The Percent PMOs Rising has also taken a dip. But Stocks Above 20EMA has held steady, an important show of strength.
Intermediate-Term Market Indicators: A solid array of negative divergences tell us there will probably be some problems in this time frame.
CONCLUSION: For most of the week the market (SPY) was making new, all-time highs, but the relatively light SPX Total Volume simply did not express total comittment to the moves. Of course, we make money on the price gains, not volume, but the thin volume could be undermining those gains. Intermediate-term indicators are overbought and are displaying negative divergences. Bottom line, the trend of the market is up, but the condition is overbought. We should expect a pullback soon.
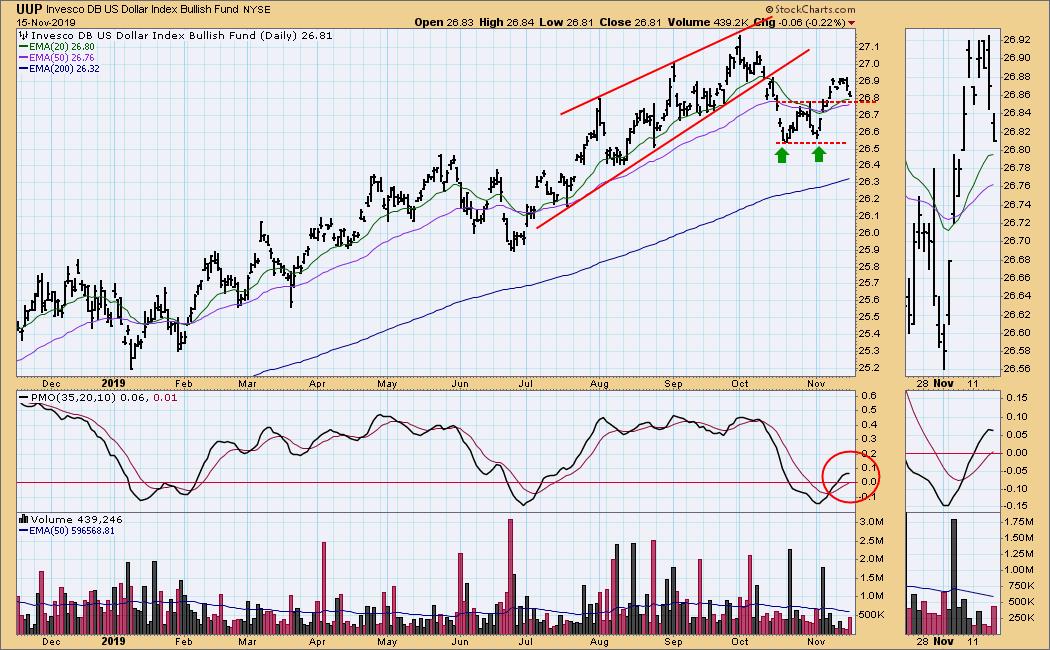
DOLLAR (UUP)
IT Trend Model: BUY as of 11/7/2019
LT Trend Model: BUY as of 5/25/2018
UUP Daily Chart: UUP broke above the double bottom confirmation line last week. This week it pulled back to the line, a technical expectation.
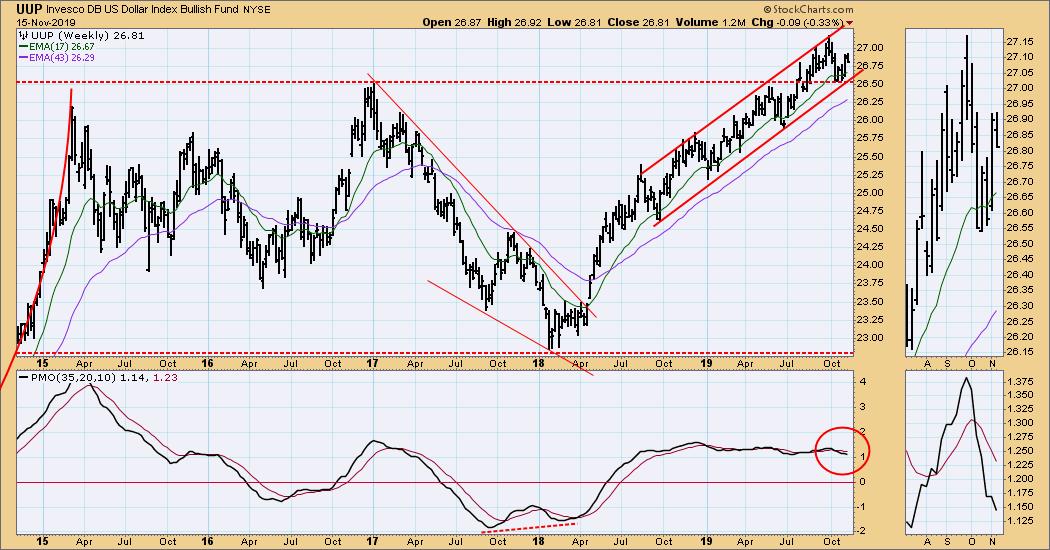
UUP Weekly Chart: Price is about midway a rising trend channel, and still looking bullish.
GOLD
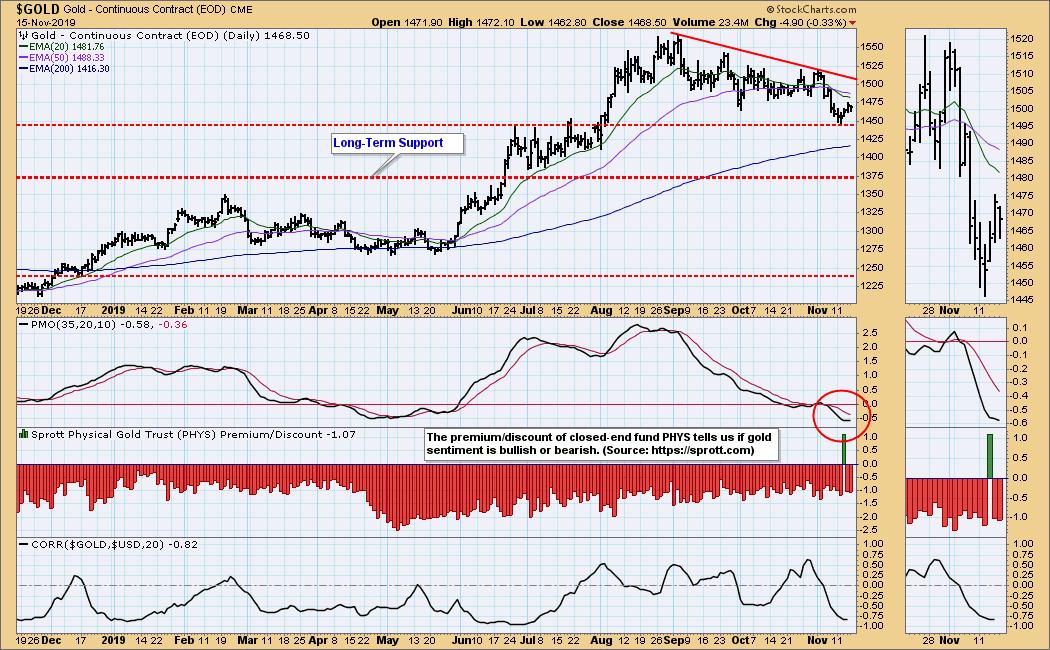
IT Trend Model: NEUTRAL as of 11/8/2019
LT Trend Model: BUY as of 1/8/2019
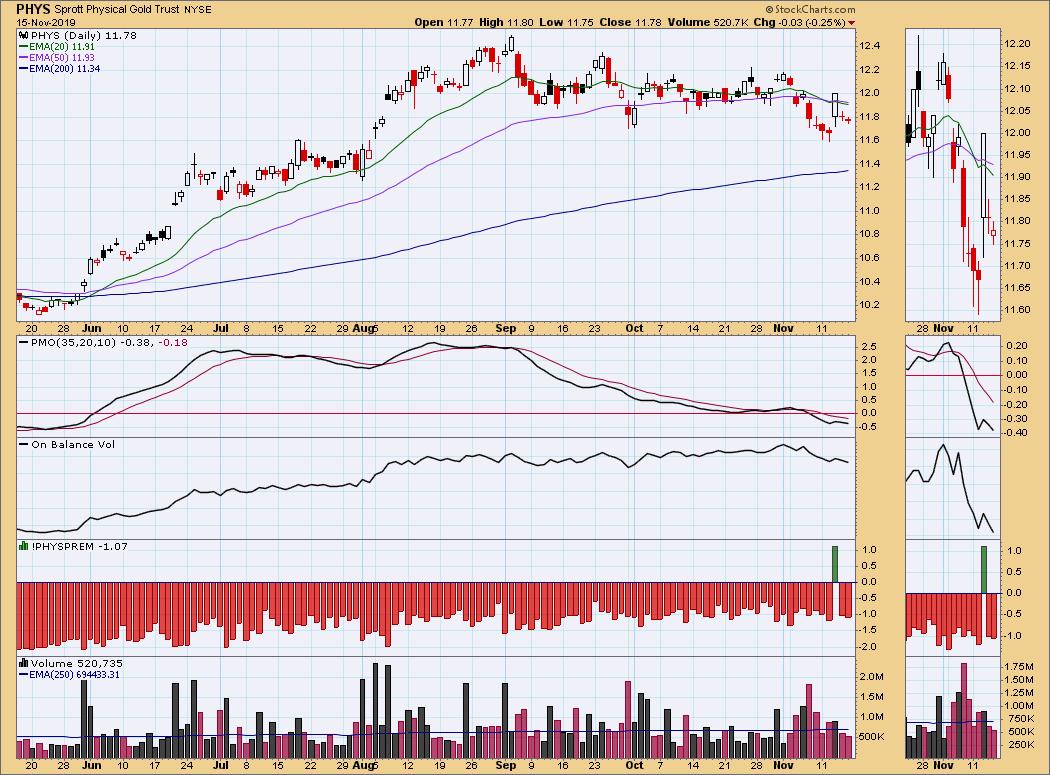
PHYS Daily Chart: I have included this chart of Sprott Physical Gold Fund (PHYS) to point out an anomaly that occurred this week. We track this closed-end fund's premium/discount as an indication of gold sentiment. PHYS has been selling at a discount since early-2017, which means sentiment has been bearish. On Wednesday gold was up +0.66%, but PHYS was up +2.83%, resulting in PHYS being sold at a premium. I can only guess that there was some extraordinary demand for PHYS on that day, but we need more than that to conclude that there has been a permanent shift in sentiment -- it was back to selling at a discount the rest of the week.
GOLD Daily Chart: Gold found support at the top of the June/July area of congestion.
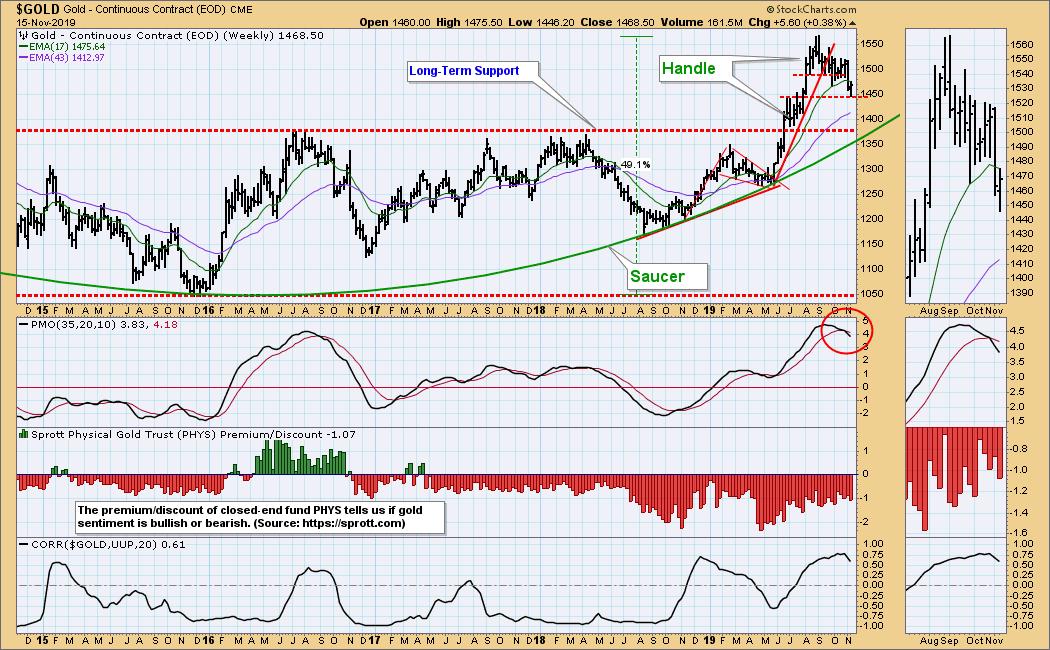
GOLD Weekly Chart: Gold is still putting a handle on the saucer in this time frame.
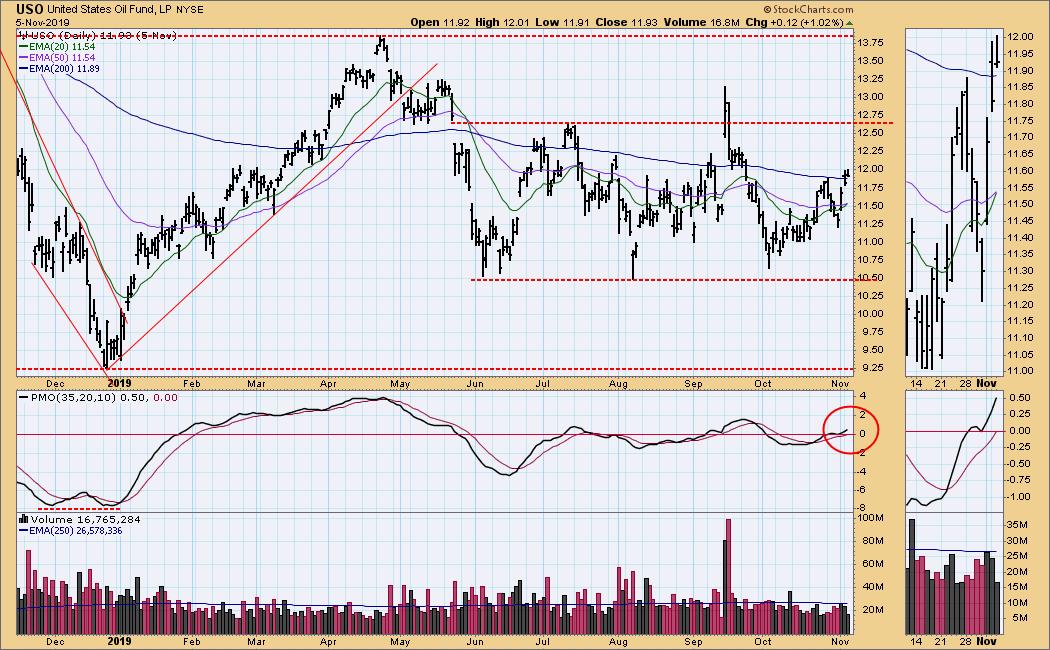
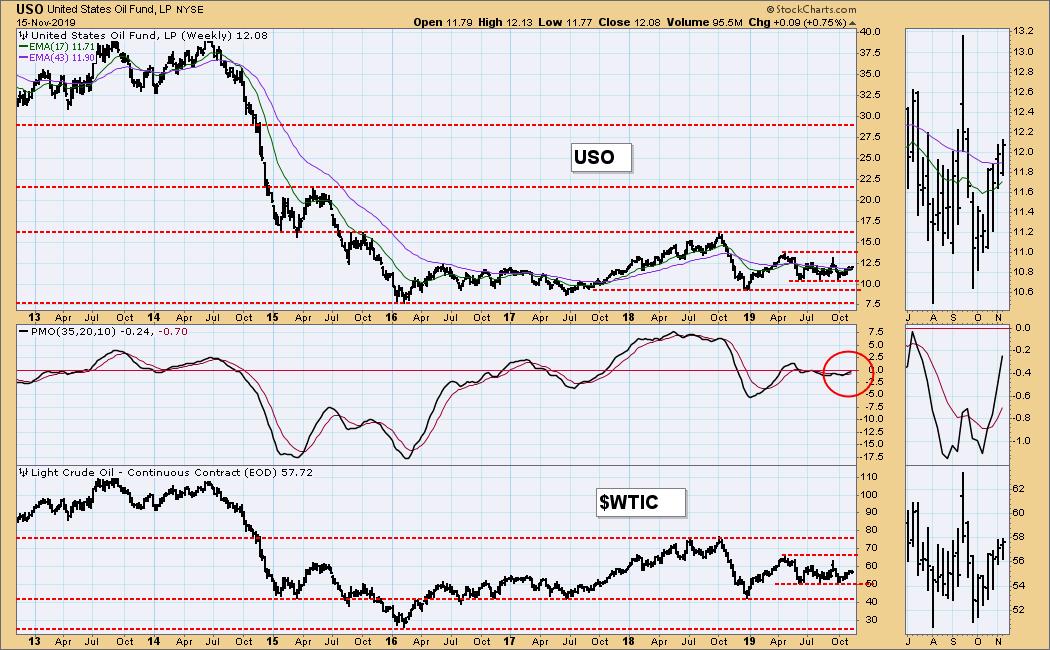
CRUDE OIL (USO)
IT Trend Model: BUY as of 11/5/2019
LT Trend Model: SELL as of 6/4/2019
USO Daily Chart: [[comments]]
USO Weekly Chart: Price remains about midway in a narrow trading range.
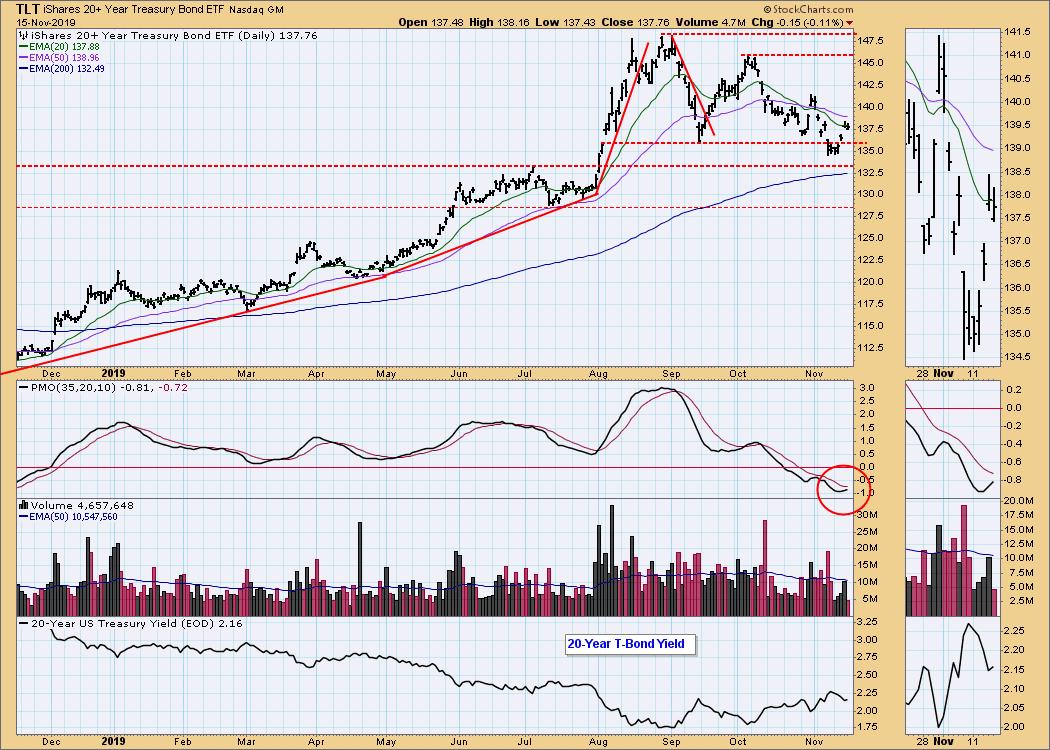
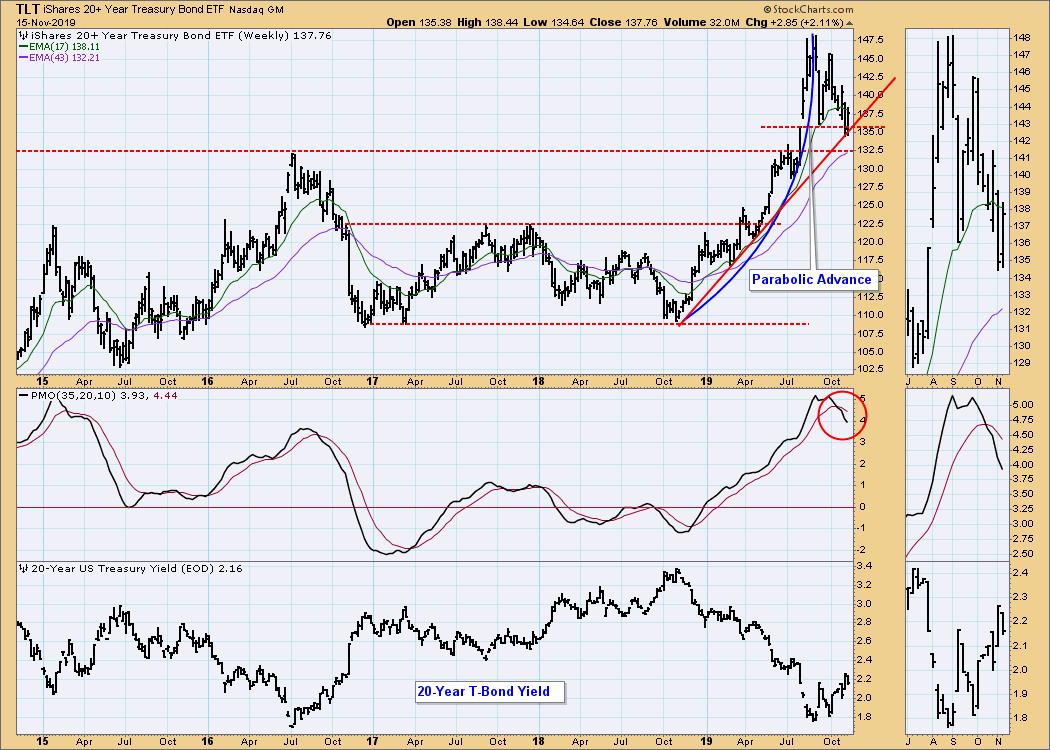
BONDS (TLT)
IT Trend Model: NEUTRAL as of 10/28/2019
LT Trend Model: BUY as of 1/2/2019
TLT Daily Chart: Until the Fed acts again, I think TLT will remain above last week's low and August's high.
TLT Weekly Chart: It appears as if the rising trend line will prevail.
**Don't miss any of the DecisionPoint commentaries! Go to the "Notify Me" box toward the end of this blog page to be notified as soon as they are published.**
Technical Analysis is a windsock, not a crystal ball.
Happy Charting! - Carl
NOTE: The signal status reported herein is based upon mechanical trading model signals, specifically, the DecisionPoint Trend Model. They define the implied bias of the price index based upon moving average relationships, but they do not necessarily call for a specific action. They are information flags that should prompt chart review. Further, they do not call for continuous buying or selling during the life of the signal. For example, a BUY signal will probably (but not necessarily) return the best results if action is taken soon after the signal is generated. Additional opportunities for buying may be found as price zigzags higher, but the trader must look for optimum entry points. Conversely, exit points to preserve gains (or minimize losses) may be evident before the model mechanically closes the signal.
Helpful DecisionPoint Links:
DecisionPoint Shared ChartList and DecisionPoint Chart Gallery
Price Momentum Oscillator (PMO)
Swenlin Trading Oscillators (STO-B and STO-V)


