
Forgive the pun today, but I found it quite funny when the only two results on my Diamond PMO Scan were "CASH" and "SAFE"! I have included both today as I did find them very interesting. From there, I ran a different scan and a number of Home Builders came up; I decided I'd add three stocks from this industry group, given the bullish price activity and positive momentum that seems to be building there (no pun intended).
I love to get your feedback on DP commentary, so shoot me an email at erinh@stockcharts.com. I read every one of them and try to answer them all! Your insight helps me to tailor my commentary to what my readers and viewers want to hear about.
Welcome to "DecisionPoint Daily Diamonds," a newsletter in which I highlight five "diamonds in the rough" taken from the results of one of my DecisionPoint scans. Remember, these are not recommendations to buy or sell, but simply stocks that I found interesting. The objective is to save you the work of the initial, tedious culling process, but you need to apply your own analysis to see if these stocks pique your interest as well. There are no guaranteed winners here!
Current Market Outlook:
Market Trend: Currently, we have Trend Model BUY signals in all three timeframes on the DP Scoreboard Indexes.
Market Condition: The market is overbought, with Price Momentum Oscillator (PMO) BUY signals on the DP Scoreboards. Remember, overbought conditions can persist in a bull market.
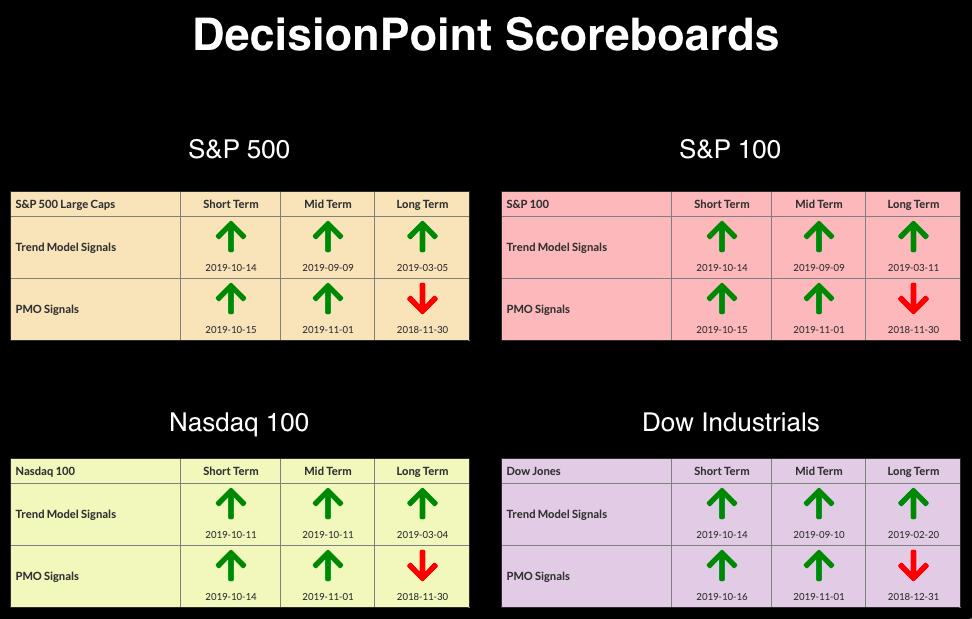
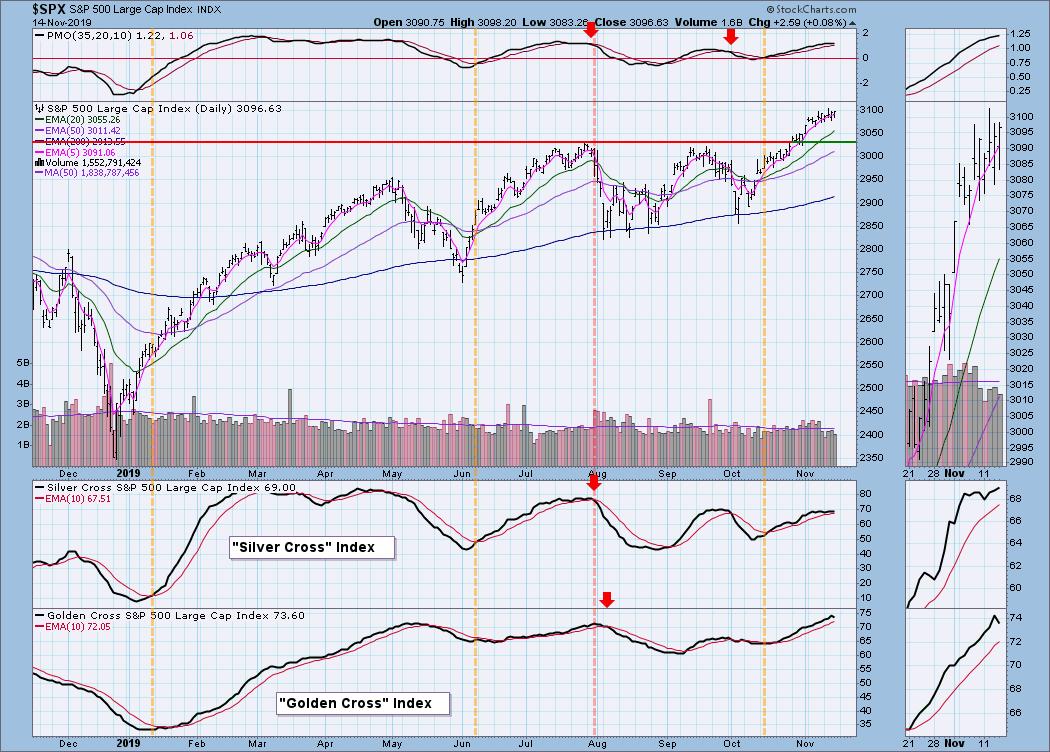
Market Environment: It is important to consider the odds for success. The Silver Cross Index measures the percentage of stocks on IT Trend Model BUY signals (20-EMA > 50-EMA), the Golden Cross Index measures the percentage of stocks on LT Trend Model BUY signals (50-EMA > 200-EMA). Here are the current percentages on the Silver and Golden Cross Indexes:
Diamond Index:
- Diamond Scan Results: 2
- Diamond Dog Scan Results: 38
- Diamond Bull/Bear Ratio: 0.05
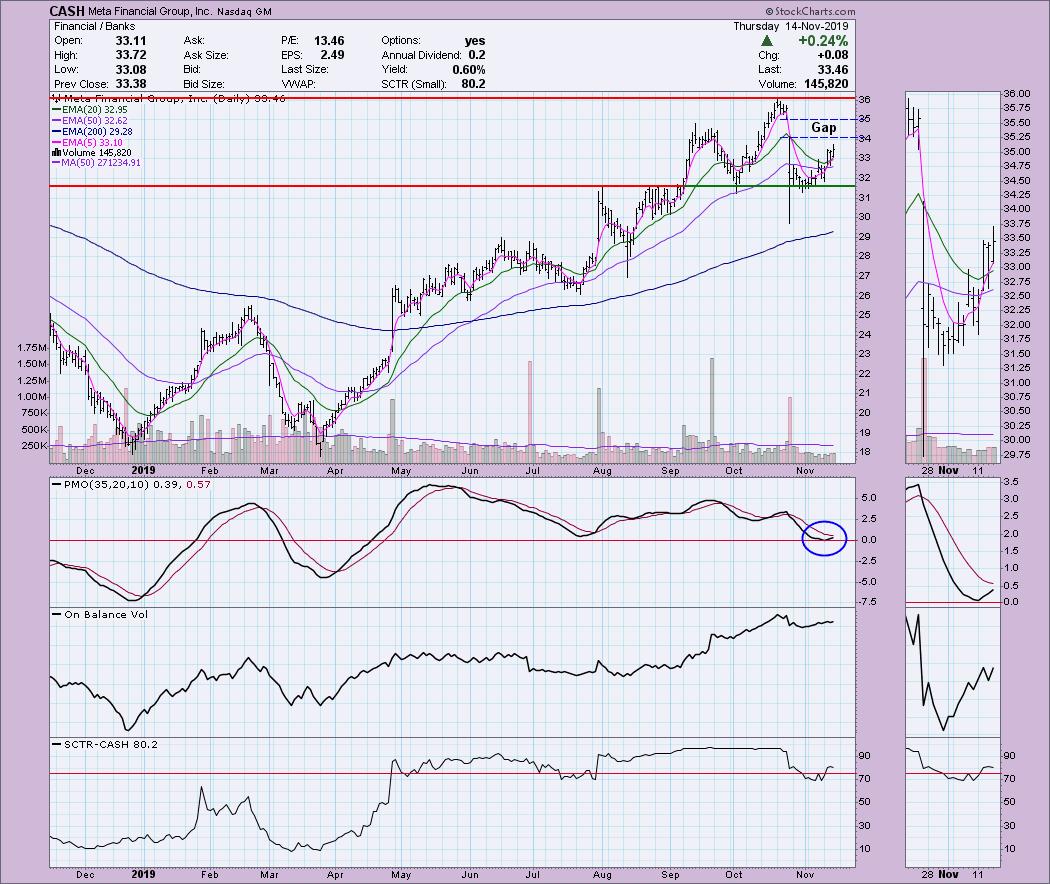
Meta Financial Group Inc (CASH) - Earnings: 10/24/2019
CASH's PMO turned up above the zero line and is going in for a crossover BUY signal. Right now, price is getting close to "gap resistance." A gap is formed between an intraday low and the following day's intraday high where there is no trading; typically, price will find resistance in this area. Looking at the PMO and the rising OBV, I would look for price to overcome this resistance and make its way back to the October top.
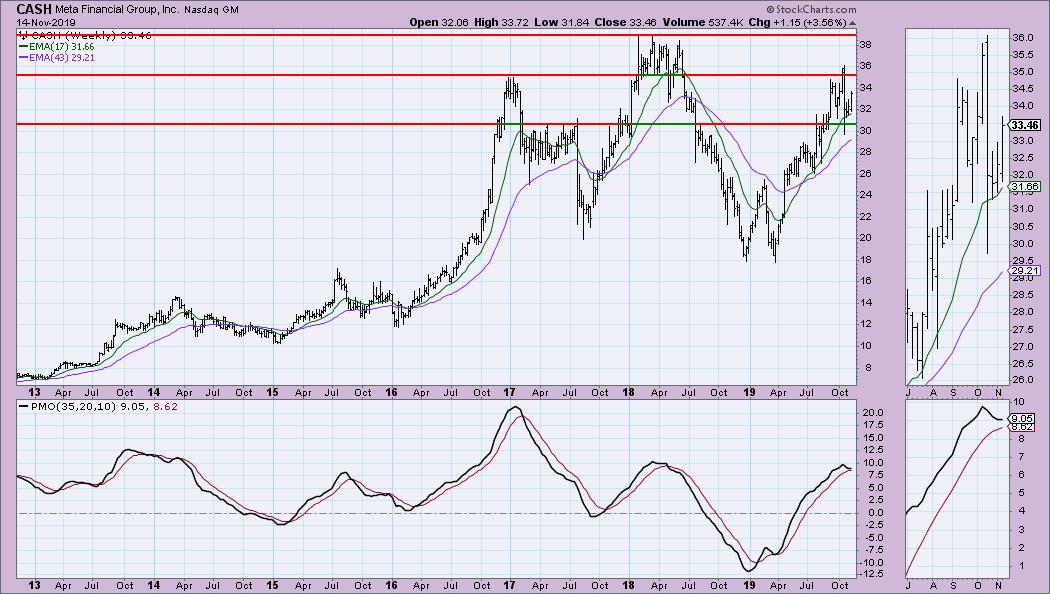
At first glance, you may say "yikes" to this weekly chart based on the PMO. However, if you look in the thumbnail magnification, you can see that the PMO is turning up above the signal line. We've seen readings much higher than this on the PMO, so I would say that it isn't overbought.
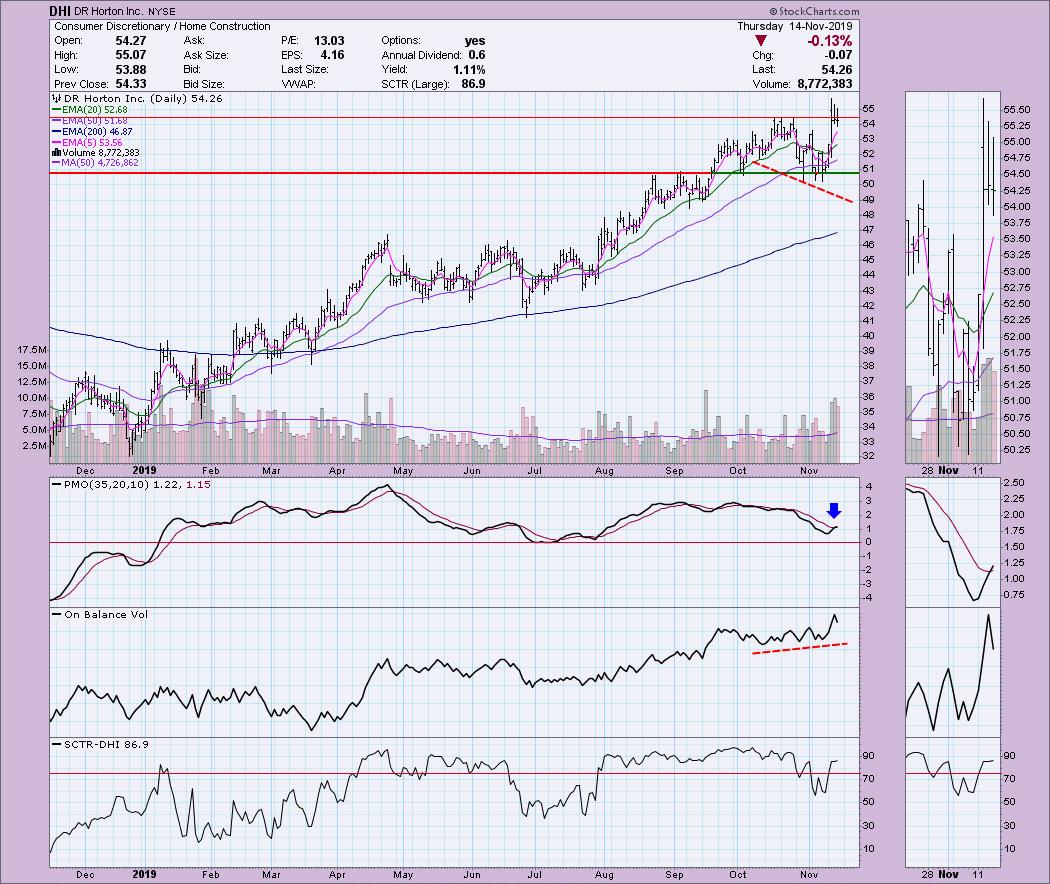
DR Horton Inc (DHI) - Earnings: 1/23 - 1/27/2020
The PMO just had a crossover BUY signal today. Price broke out on Tuesday and has managed to hold on somewhat to support at the October highs. I look at this as a breakout followed by a pullback, which is when I like to get in. The OBV was telegraphing a great upside move during October, when there was a beautiful positive divergence between price lows and OBV lows.
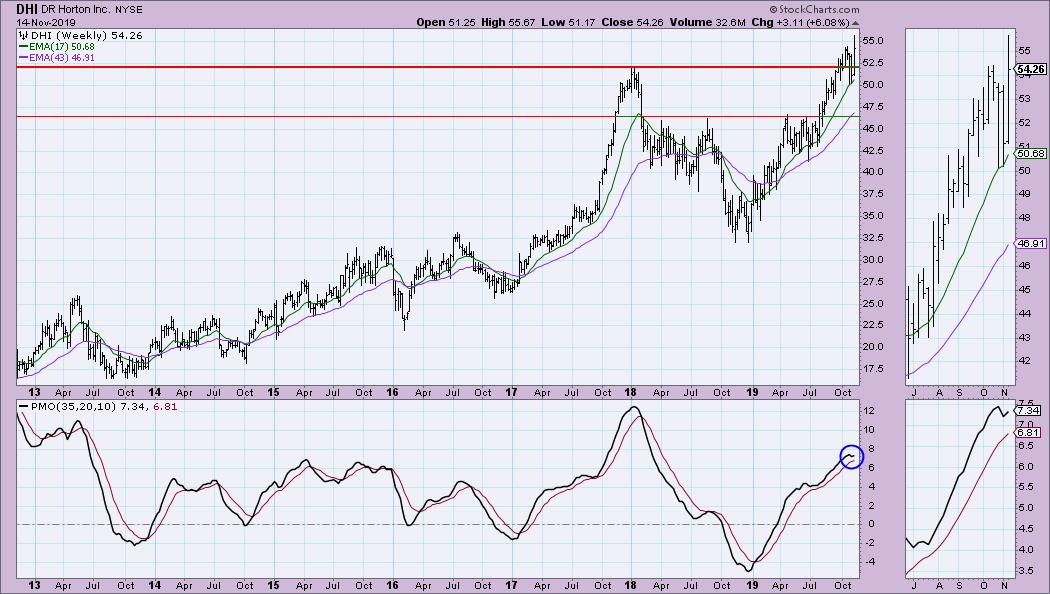
The weekly chart shows the PMO turning up above its signal line. It is somewhat overbought, but could certainly find headroom if the rally continues as expected.
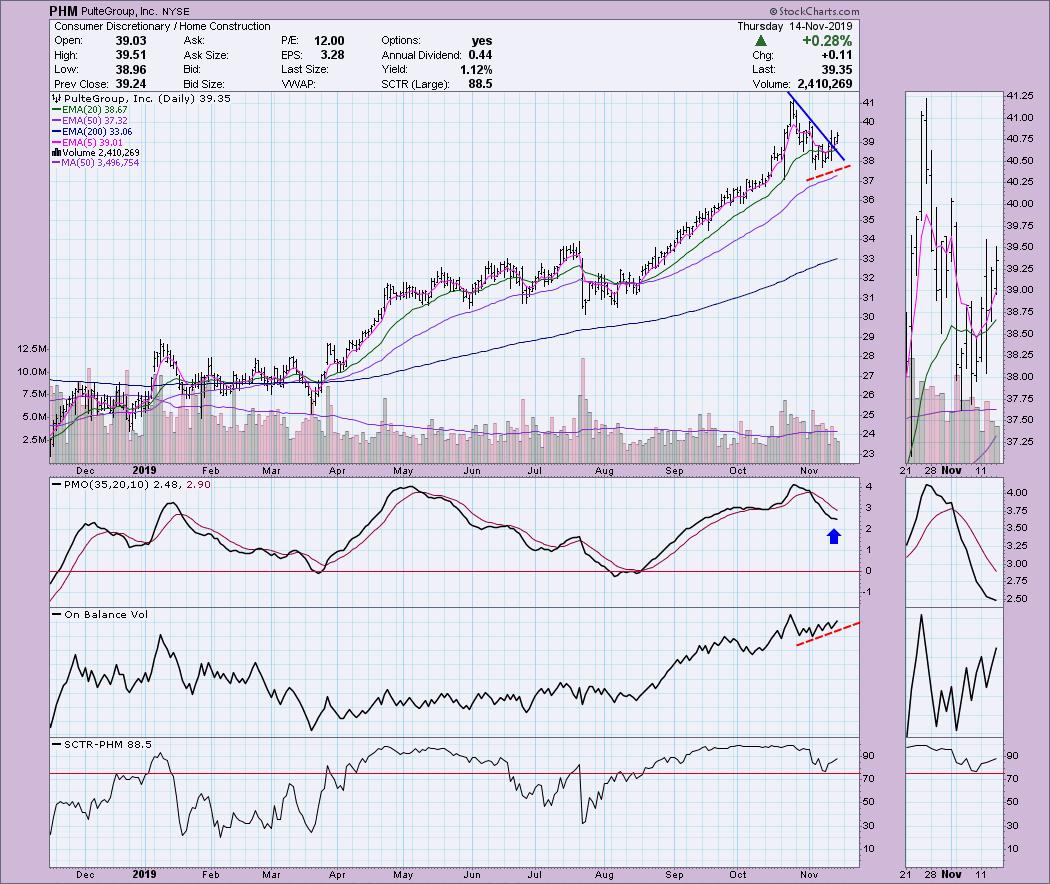
PulteGroup Inc (PHM) - Earnings: 1/27 - 1/31/2020
A steep declining trend has broken. The PMO hasn't quite turned back up yet, but it certainly looks ready to do so. The OBV is confirming the currently rally and breakout. A strong SCTR ranking since mid-August is encouraging as well.
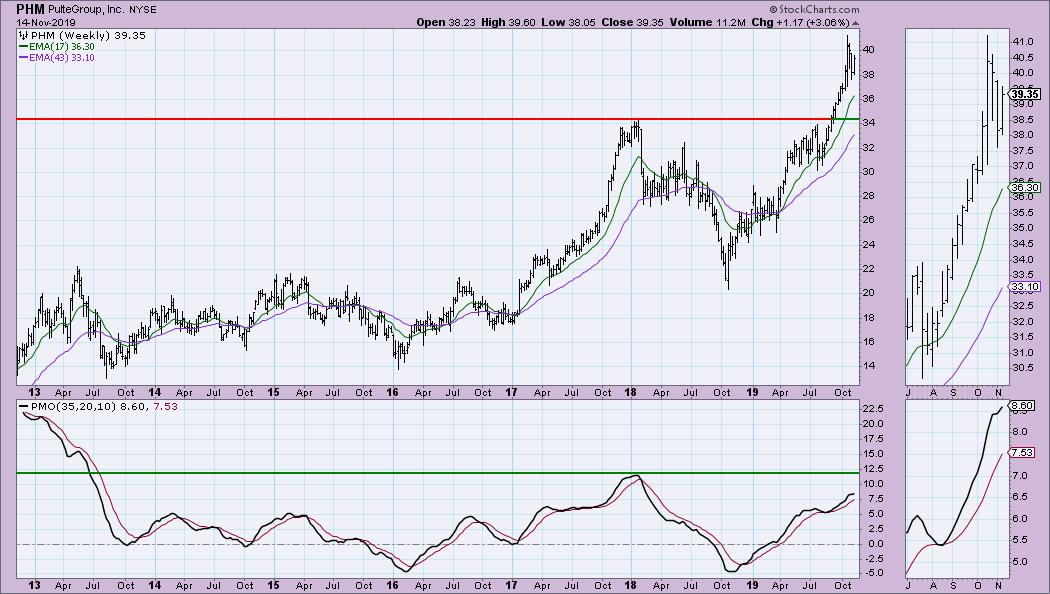
The PMO still has room to move higher. It started to turn down last week, but has reversed given the >3% move for the week.
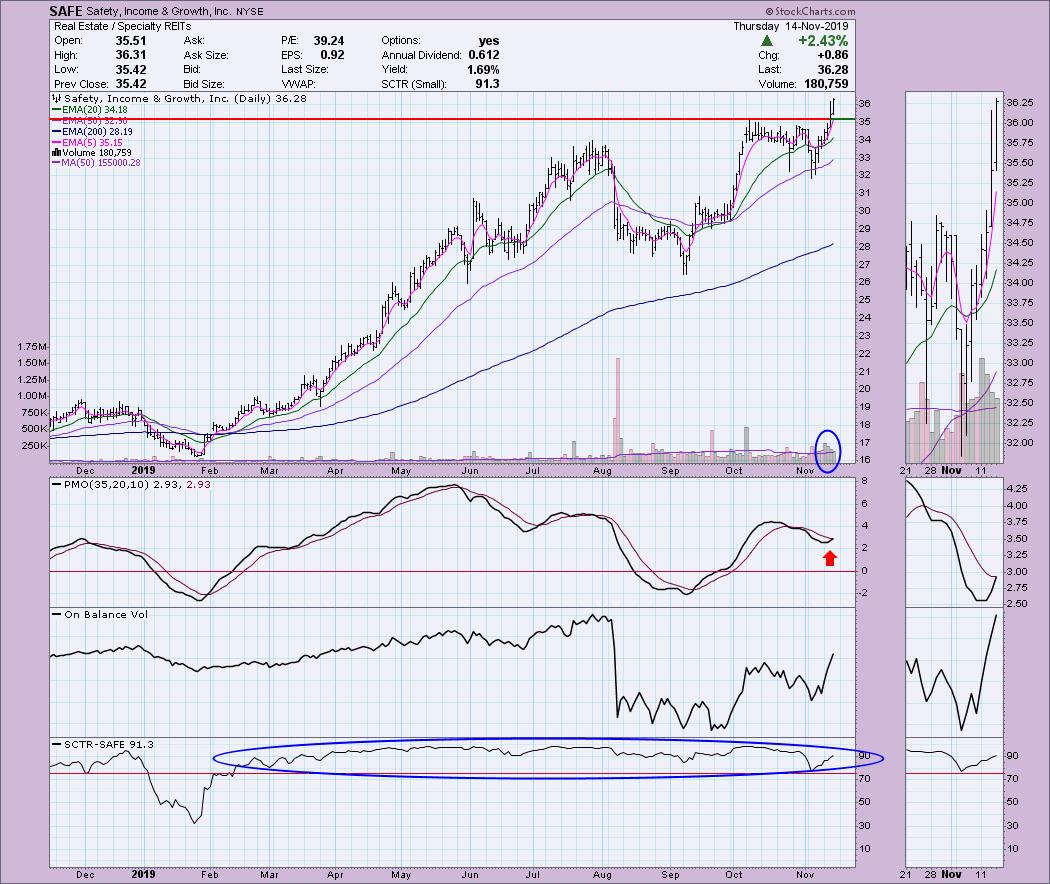
Safety, Income & Growth Inc (SAFE) - Earnings: 2/12 - 2/17/2020
This one came from the Diamond PMO Scan. A beautiful breakout on volume is displayed, and the OBV is confirming the breakout with a breakout of its own. The SCTR has been in the hot zone above 75 most of this year. This tells us that it has internal and relative strength in the intermediate term.
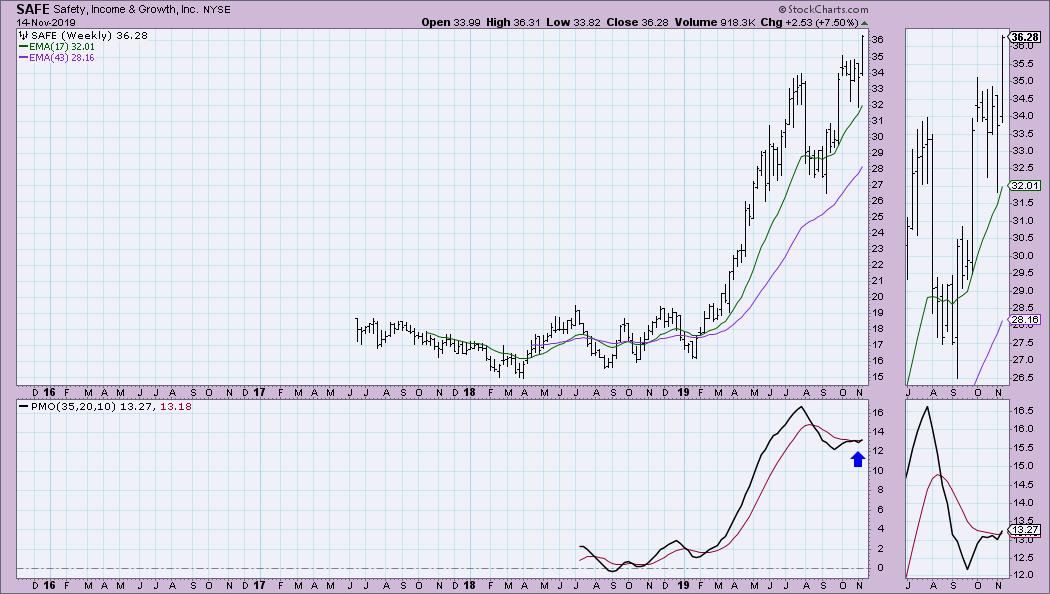
The PMO is triggering a BUY signal this week on the breakout to new all-time highs.
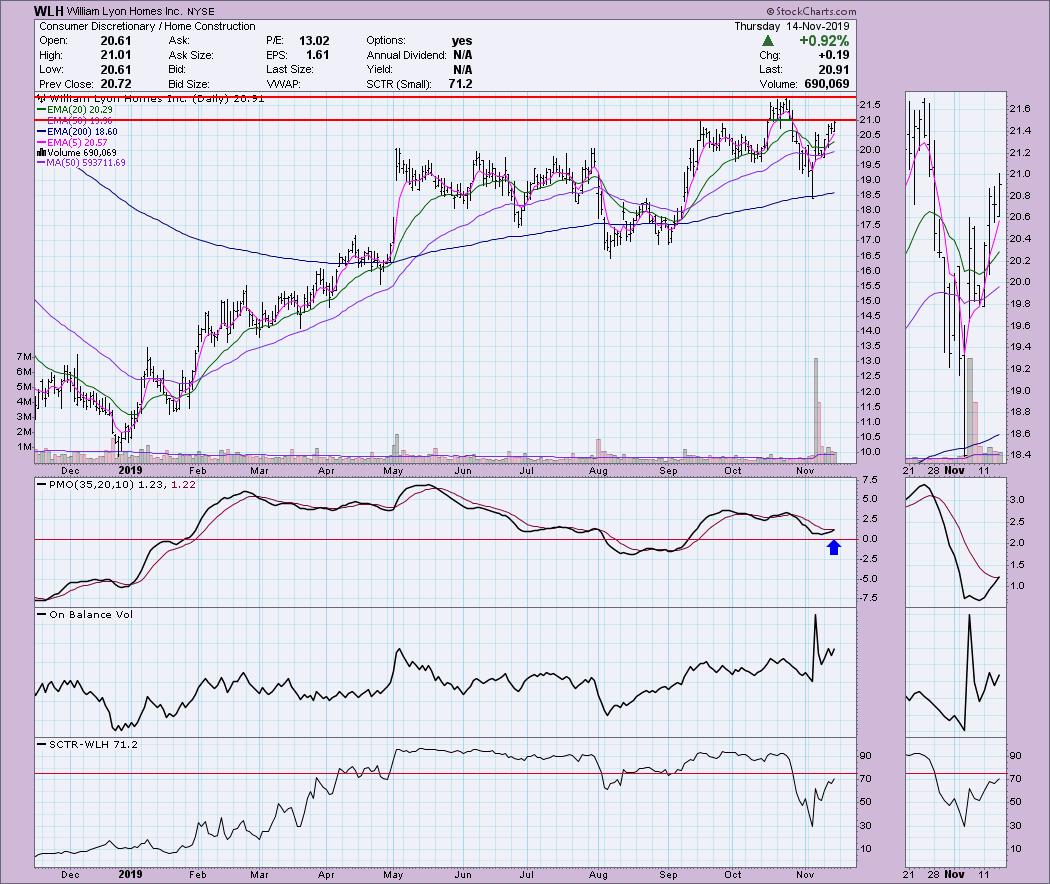
William Lyon Homes Inc (WLH) - Earnings: 2/12 - 2/17/2020
Currently, price is butted up against interim overhead resistance, with the strong overhead resistance lying at the October high. The PMO triggered a BUY signal today. This month's OBV reading looks like a heartbeat spike. The spike occurred on the high volume up day; the OBV is calculated by adding that day's volume to the running total on a positive close and subtracting the day's volume on a down day. Lots of volume came in, but the OBV hasn't lost the rising bottoms.
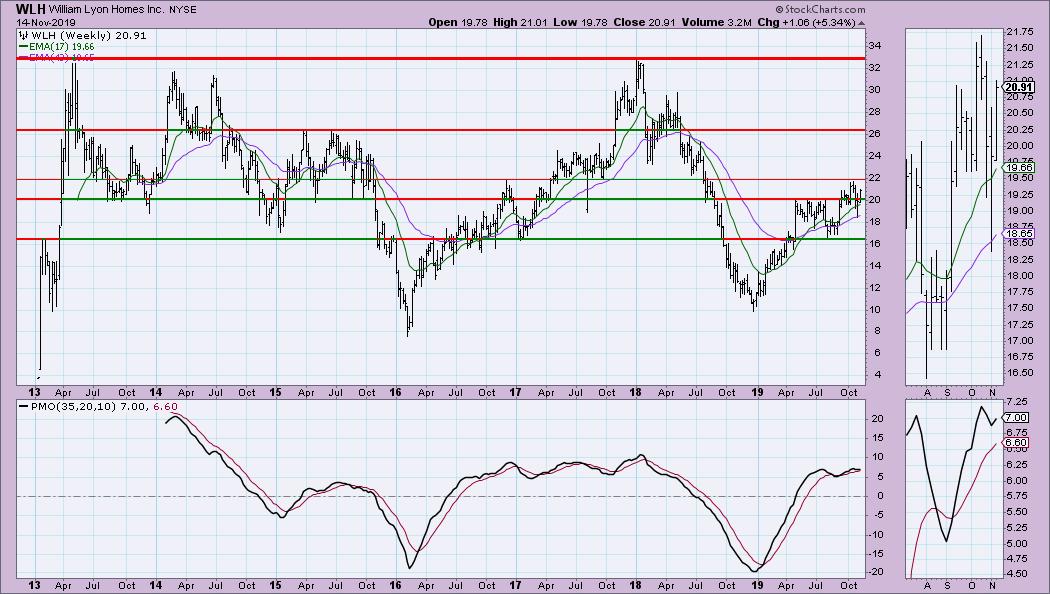
I've annotated various areas of support and resistance on the weekly chart, as I see many. Supports at $16 and $20 are holding. The next level of overhead resistance is the October top. Past that, I see $26 as the next level, which matches up with the 2015 highs. After that, the 2018 high is my target for the investment.
Full Disclosure: I do not own any of the stocks above and I'm not planning on adding any at this time. While I can't guarantee that I won't add any, I can say that 99% of my investments come from my scans, so I am showing you my actual candidates. I'm currently about 80% in cash.

Erin Swenlin will be presenting at the The MoneyShow Las Vegas May 11-13, 2020! You'll have an opportunity to meet Erin and discuss the latest DecisionPoint news and Diamond Scans. The conference is free to attend or view online!
Watch the latest episode of DecisionPoint with Carl & Erin Swenlin LIVE on Mondays 5:00p EST or on the StockCharts TV YouTube channel here!
Technical Analysis is a windsock, not a crystal ball.
Happy Charting!
- Erin
erinh@stockcharts.com
NOTE: The stocks reported herein are from mechanical trading model scans that are based upon moving average relationships, momentum and volume. DecisionPoint analysis is then applied to get five selections from the scans. The selections given should prompt readers to do a chart review using their own analysis process. This letter is not a call for a specific action to buy, sell or short any of the stocks provided. There are NO sure things or guaranteed returns on the daily selection of "diamonds in the rough."
Helpful DecisionPoint Links:
DecisionPoint Shared ChartList and DecisionPoint Chart Gallery
Price Momentum Oscillator (PMO)
Swenlin Trading Oscillators (STO-B and STO-V)
**Don't miss DecisionPoint Commentary! Add your email below to be notified of new updates"**


