

Since I had zero results on the Diamond Price Momentum Oscillator (PMO) Scan, I decided to look at the results from my "Diamond Dog Scan", which is basically the mathematical reverse of the Diamond scan. When shorting, I always think "short-term;" at least in my experience, you need to babysit shorts. Tom Bowley used to say on the MarketWatchers LIVE show that, when you buy equities, the upside potential is mathematically limitless, whereas gains on a short have a basement. I personally don't short often and I am not planning on changing that right now. See what you think about the possibilities on these shorts.
I love to get your feedback on DP commentary, so shoot me an email at erinh@stockcharts.com. I read every one of them and try to answer them all! Your insight helps me to tailor my commentary to what my readers and viewers want to hear about.
Welcome to DecisionPoint Daily Diamonds, wherein I highlight five "diamonds in the rough." These are selected from the results of my DecisionPoint scans, which search for stocks that could benefit from the trend and condition of the market. Remember, these are not recommendations to buy or sell, but are the most interesting of the stocks that surfaced in my scans. My objective is to save you the work of the initial, tedious culling process, but you need to apply your own analysis to see if these stocks pique your interest as well. There are no guaranteed winners here!
Current Market Outlook:
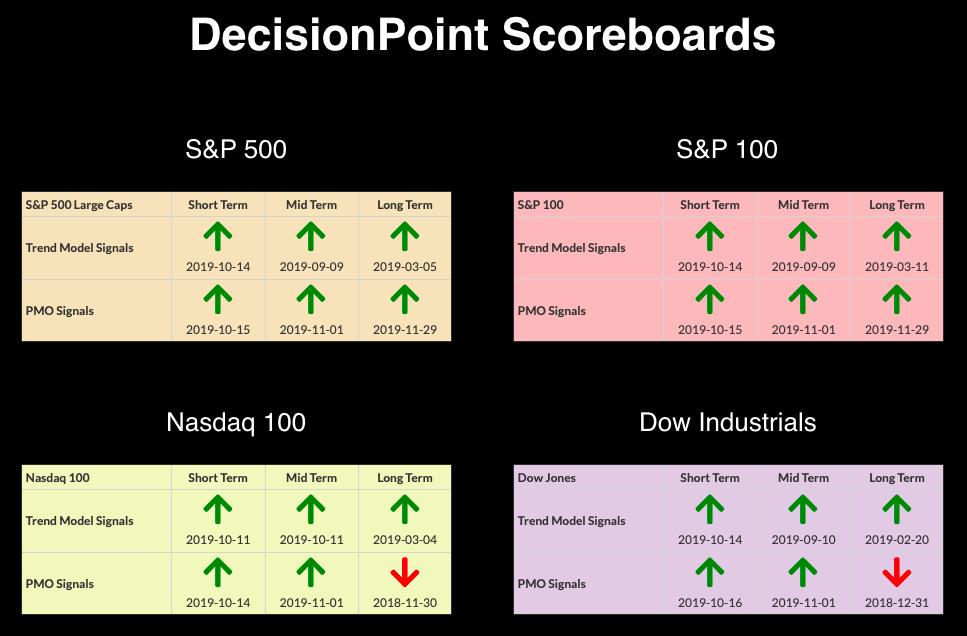
Market Trend: Currently, we have Trend Model BUY signals in all three timeframes on the DP Scoreboard Indexes.
Market Condition: The market is overbought, with Price Momentum Oscillator (PMO) BUY signals on the DP Scoreboards. The SPX and OEX triggered new LT PMO BUY signals, so a bear market move is looking less likely. I believe a pullback is happening right now. Remember, overbought conditions can persist in a bull market.
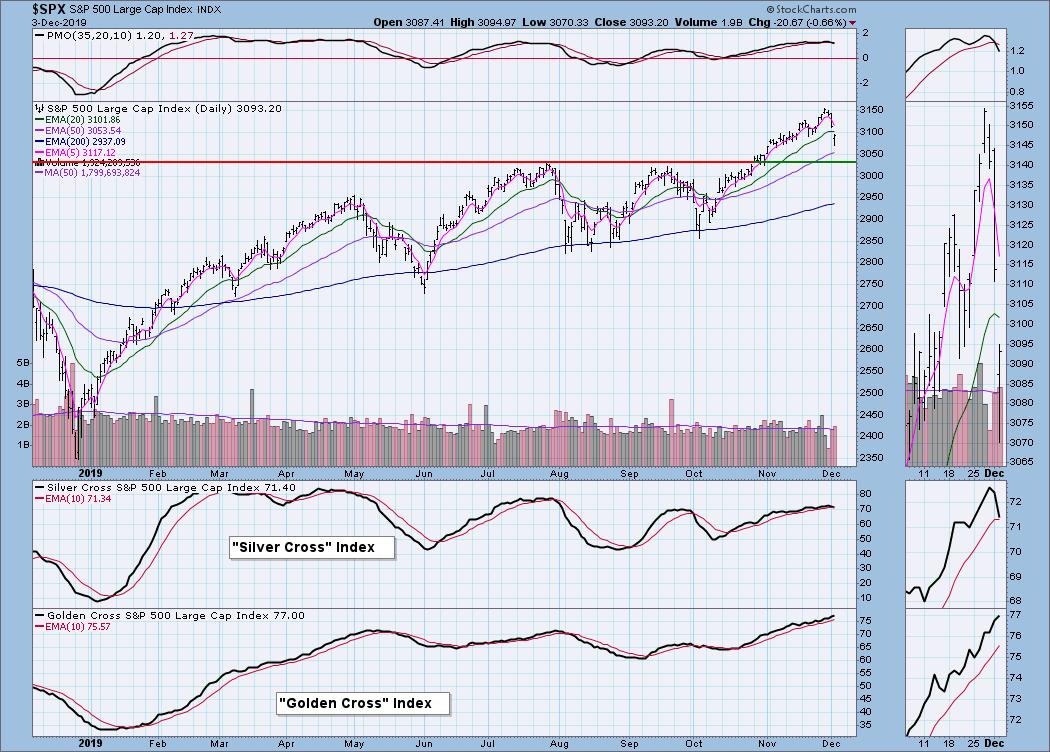
Market Environment: It is important to consider the odds for success. The Silver Cross Index measures the percentage of stocks on IT Trend Model BUY signals (20-EMA > 50-EMA), while the Golden Cross Index measures the percentage of stocks on LT Trend Model BUY signals (50-EMA > 200-EMA). Here are the current percentages on the Silver and Golden Cross Indexes:
Diamond Index:
- Diamond Scan Results: 0
- Diamond Dog Scan Results: 22
- Diamond Bull/Bear Ratio: 0
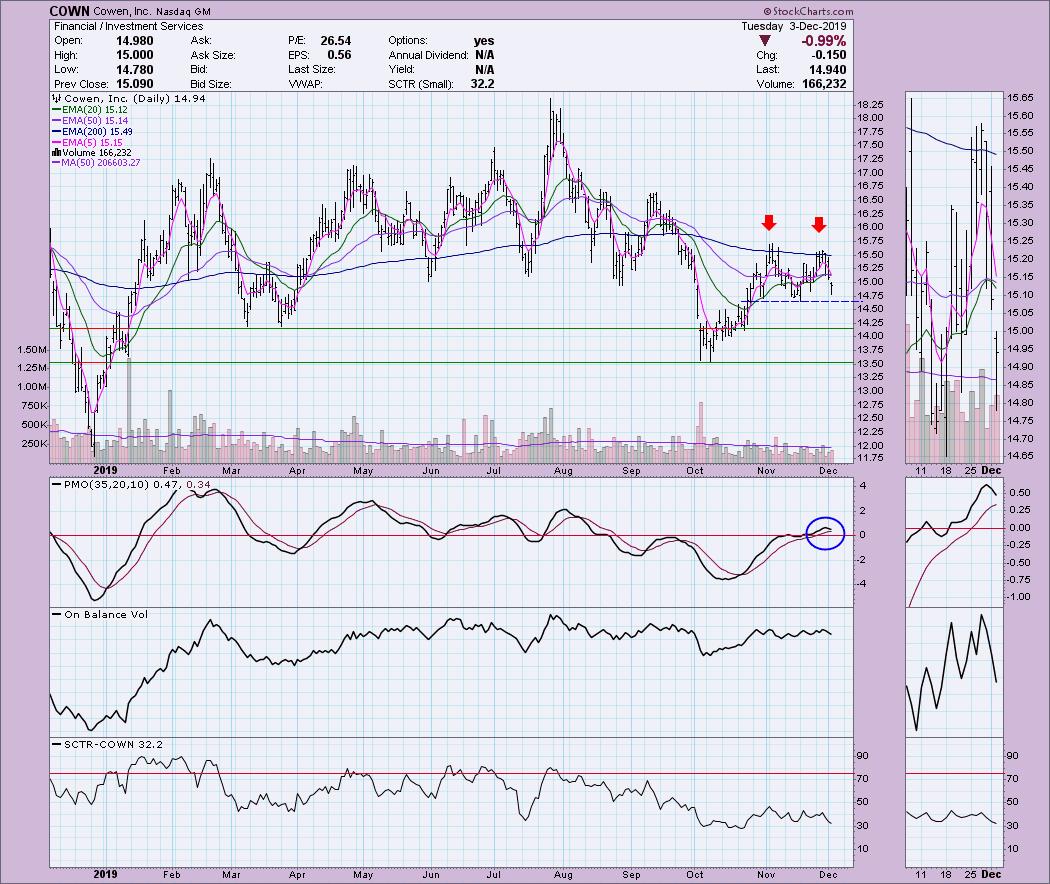
Cowen Inc (COWN) - Earnings: 2/12 - 2/17/2020
Remember, today we are looking at shorting opportunities. What I like to look for is support being as far away from the current price as possible. This is a lower-priced stock, so it doesn't take much effort for it to move 1% or more a day; be careful. Support doesn't hit until about $14.20 (coinciding with the March lows). I spotted a double-top formation coming off a nice October rally. If it executes with a drop below the confirmation line, the minimum downside target is just above support at the October lows. The PMO has topped and is headed toward zero.
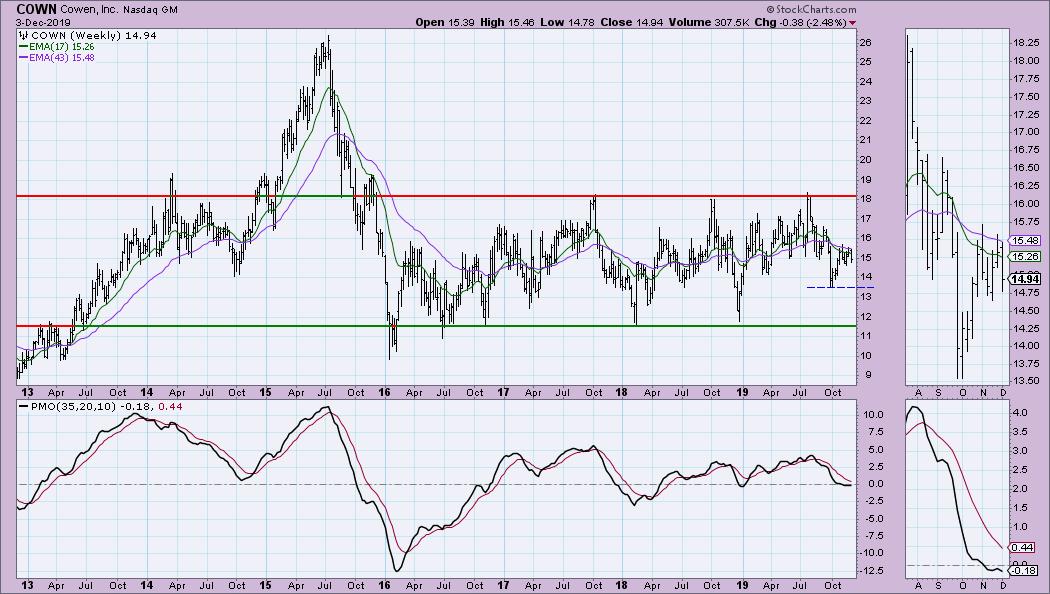
COWN has been in a very wide trading range since 2016/2017. Price is currently right in the middle, so the risk is whether it will test the top of the range or move to the bottom. At this point, $13.50 looks like a reliable bottom. The PMO has now topped below its signal line and is currently in negative territory.
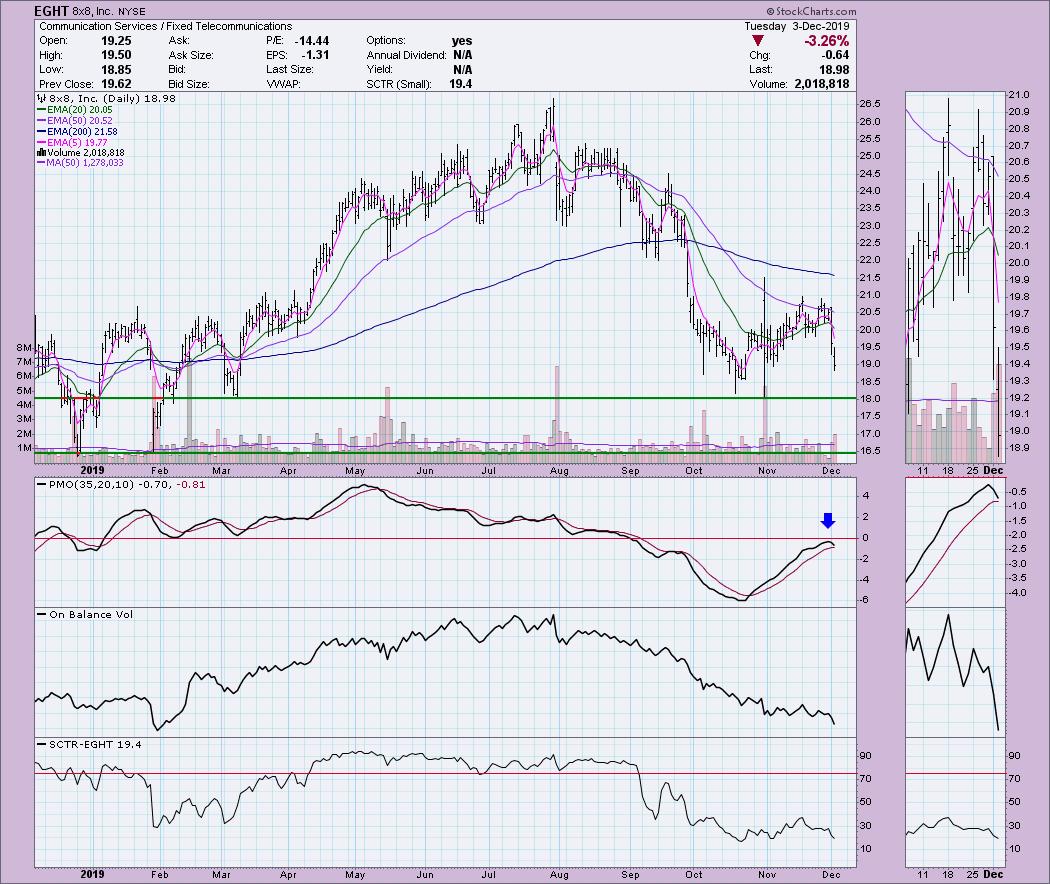
8x8 Inc (EGHT) - Earnings: 1/27 - 1/31/2020
Support is closer than I like, but, again, we have a low-priced stock, so I don't need much more of a drop to have a winning position. The PMO topped below the zero line; notice that the OBV is about to move to the lowest reading of the year. Note that there is stronger support at the December 2018 lows. If price can take out the near-term support, I would look for a move to test those previous price lows.
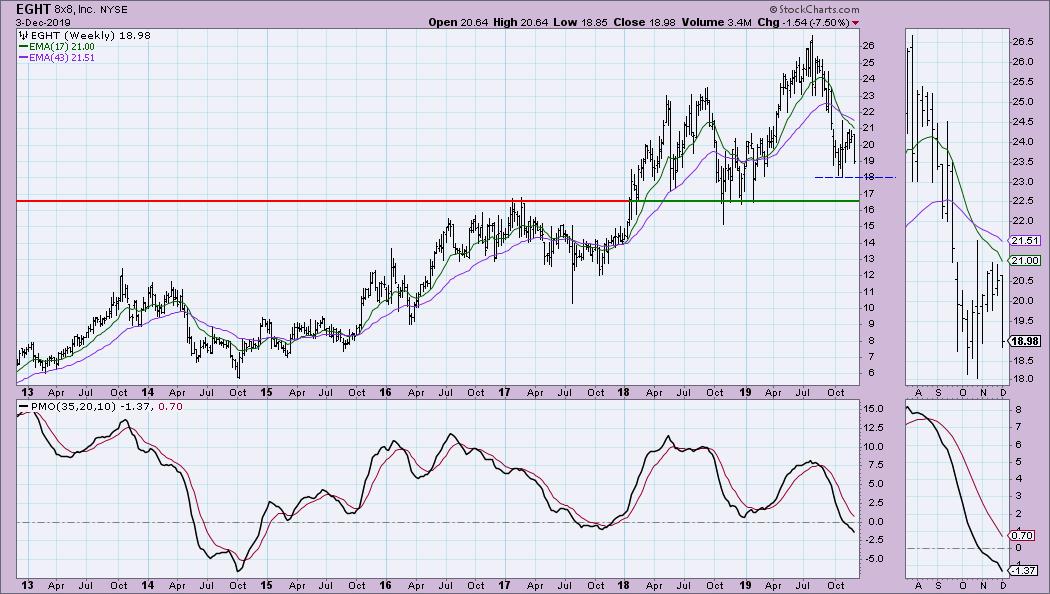
The weekly chart makes clear that $16 support is very strong and that $18 support is somewhat weak in comparison. The weekly PMO just accelerated downward.
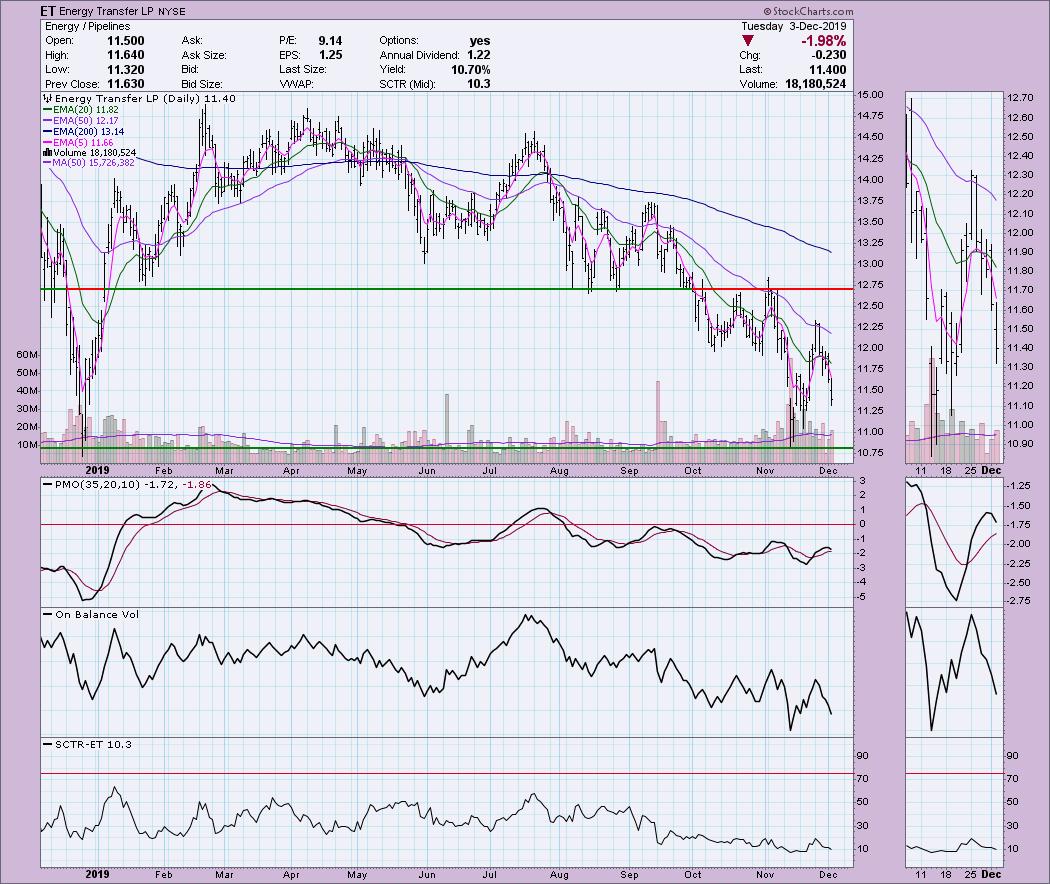
Energy Transfer LP (ET) - Earnings: 2/18 - 2/24/2020
ET went into a dive last week and hasn't recovered. The PMO has turned down below the zero line for a second time and the EMAs are configured very negatively, giving us Trend Model SELL signals in all three timeframes. I'm watching for a decline to about $10.75 or further.
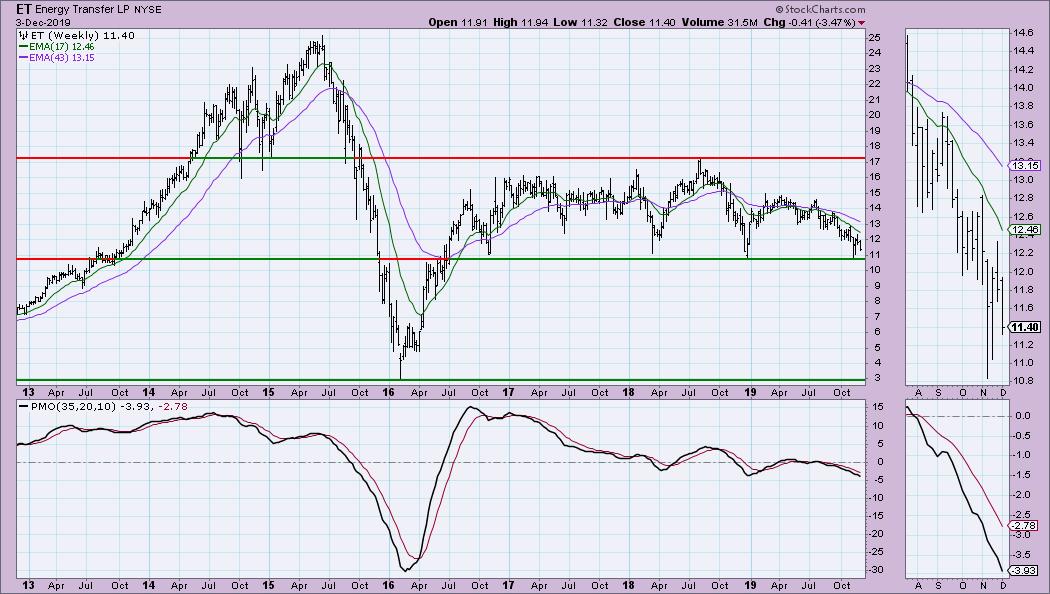
Here's the risk. Support at $10.50 is very strong and we are almost on top of it. The PMO is in decline and is suggesting the breakdown will happen.
Six Flags Entertainment Corp (SIX) - Earnings: 2/12 - 2/17/2020
SIX was unable to even reach overhead resistance at $47. Note how many times price touches that resistance line. The PMO is quite ugly and the OBV and SCTR have no redeeming qualities right now.
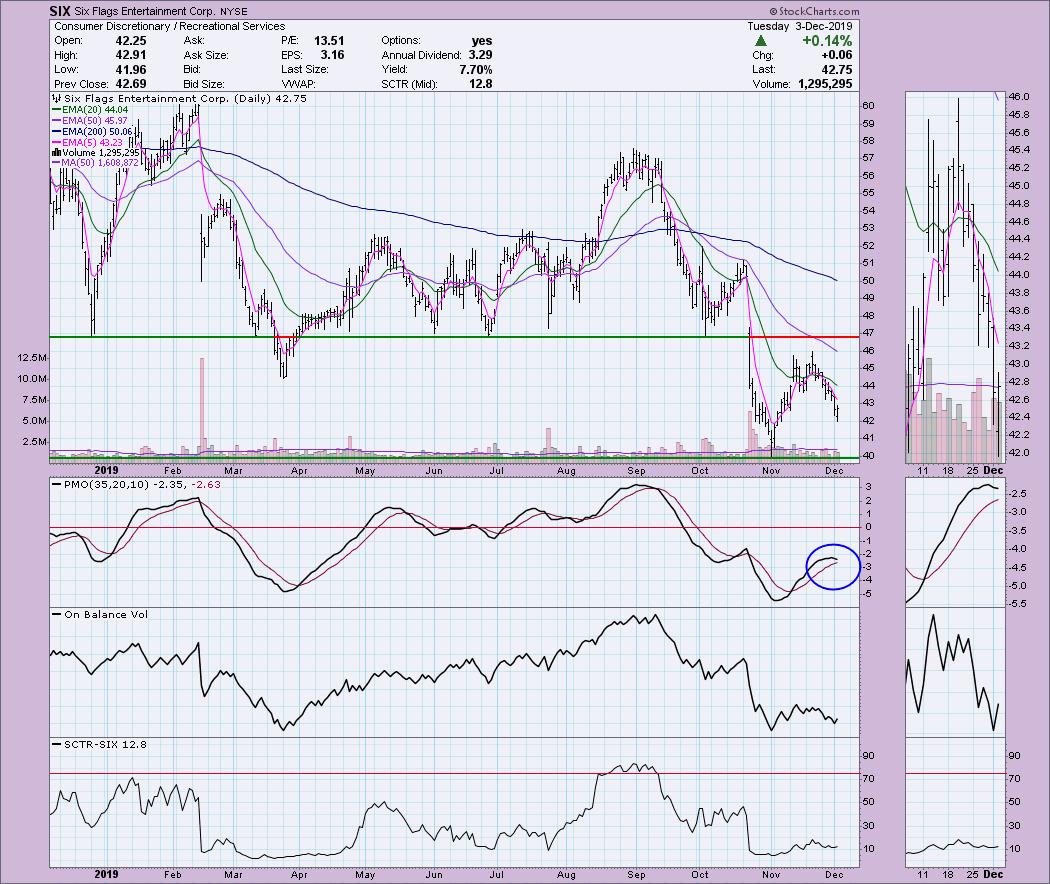
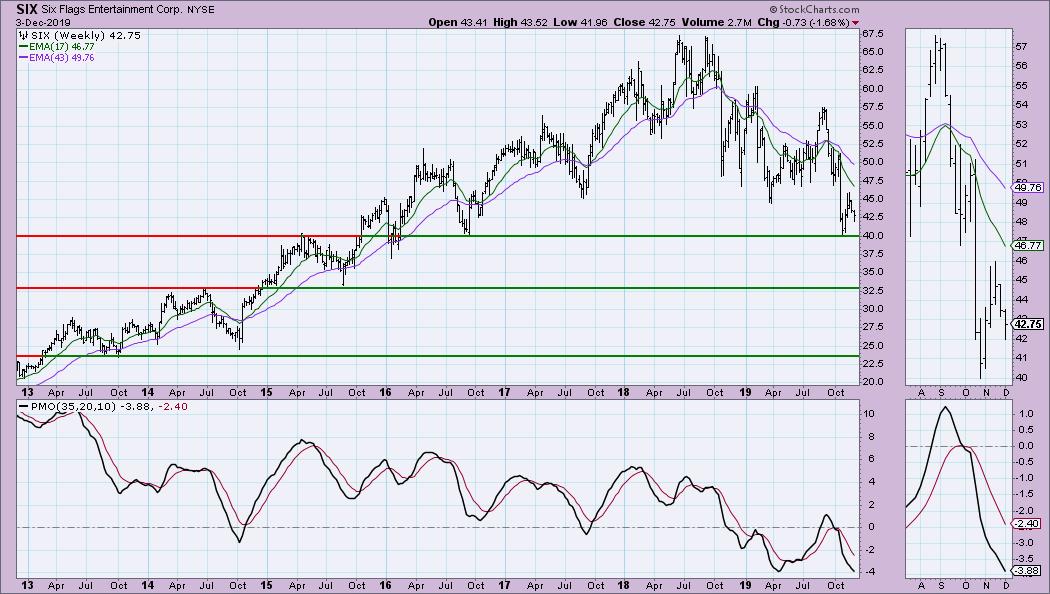
Support is very strong at $40. A ride down there would be an okay return, but there is a bonus: if price breaks down there, we don't have any support until $32.50. The PMO is still declining. We know that the bottom of the PMO range can move lower (to at least -6) given the range on the upside is around 6.
Stemline Therapeutics Inc (STML) - Earnings: 11/7/2019
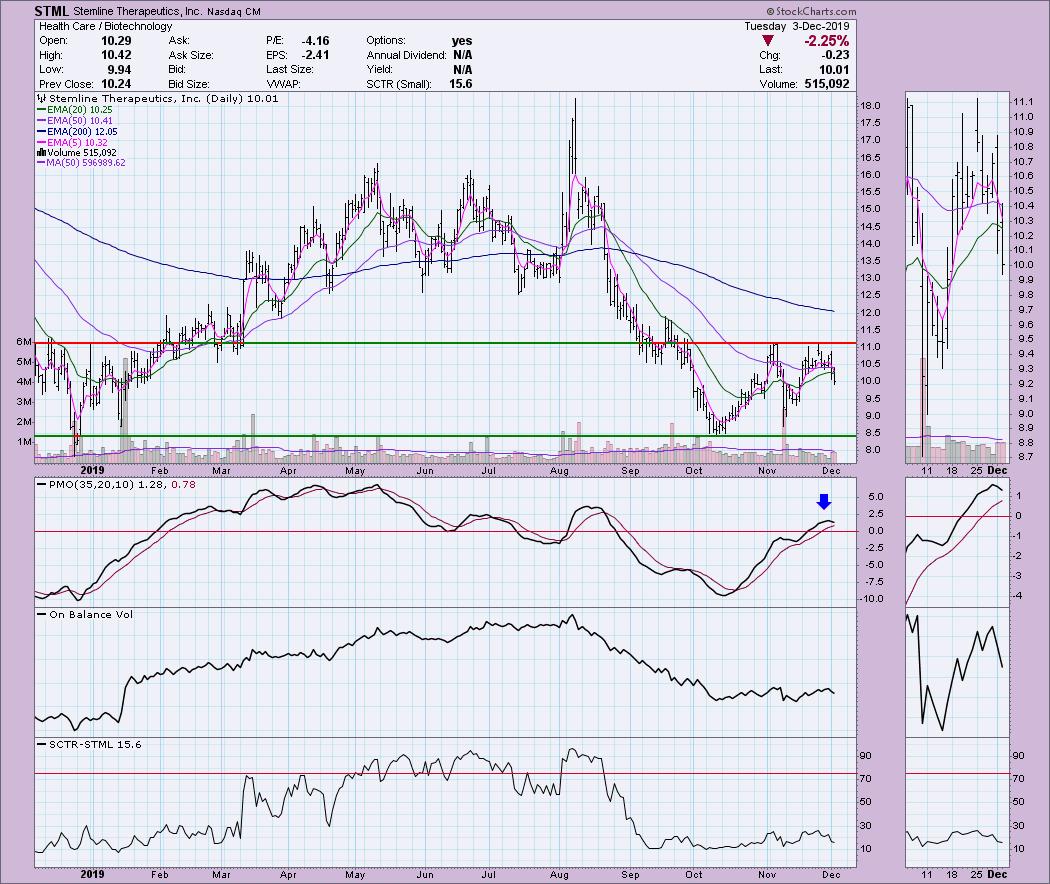
It may look like a double-top, but those are reversal patterns and we can see that the "confirmation line" is right at the October low. The good news is that even if it isn't "textbook," it does suggest we will see a move to support around $8.50. The 20/50-EMAs have both turned down, along with the PMO.
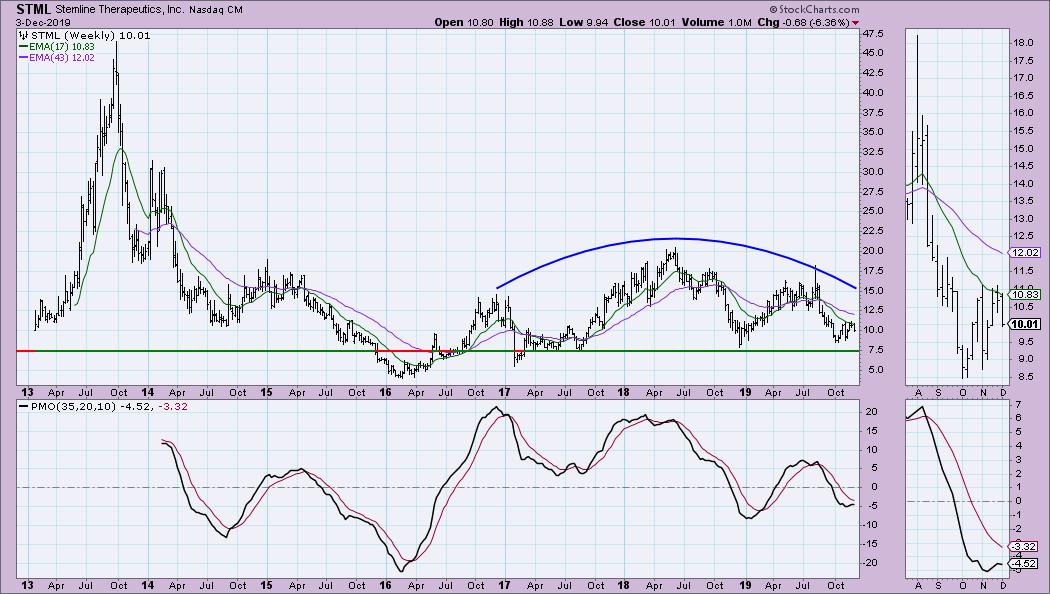
This is another fake-out chart pattern. It appears to look like a head-and-shoulders pattern, but it isn't. They are also reversal patterns; they need to arrive after a solid uptrend. However, we do have an inverted cup or rounded top, which typically call for lower prices anyway. The PMO is trying to turn up - note that $7.50 is your support level. Although it is somewhat close, I would expect to see that level tested before any solid rally.
Full Disclosure: I am not shorting any of the stocks above. I happily remain in 80% cash and don't really short the market. My risk appetite is small.
Sign Up for Market Vision 2020 Email List!
I will be presenting at the "Market Vision 2020" online conference on January 4th! It is sponsored by EarningsBeats.com and promises to be "THE" event to start the new year. We will have many of the commentators that you love presenting their "market view" for 2020, with John Murphy as the keynote speaker! For information on the event, sign up for the free emails, which will give you all the details as we get closer!

Erin Swenlin will be presenting at the The MoneyShow Las Vegas May 11-13, 2020! You'll have an opportunity to meet Erin and discuss the latest DecisionPoint news and Diamond Scans. The conference is free to attend or view online!
Watch the latest episode of DecisionPoint with Carl & Erin Swenlin LIVE on Mondays 5:00p EST or on the StockCharts TV YouTube channel here!
Technical Analysis is a windsock, not a crystal ball.
Happy Charting!
- Erin
erinh@stockcharts.com
NOTE: The stocks reported herein are from mechanical trading model scans that are based upon moving average relationships, momentum and volume. DecisionPoint analysis is then applied to get five selections from the scans. The selections given should prompt readers to do a chart review using their own analysis process. This letter is not a call for a specific action to buy, sell or short any of the stocks provided. There are NO sure things or guaranteed returns on the daily selection of "diamonds in the rough."
Helpful DecisionPoint Links:
DecisionPoint Shared ChartList and DecisionPoint Chart Gallery
Price Momentum Oscillator (PMO)
Swenlin Trading Oscillators (STO-B and STO-V)
**Don't miss DecisionPoint Commentary! Add your email below to be notified of new updates"**


