
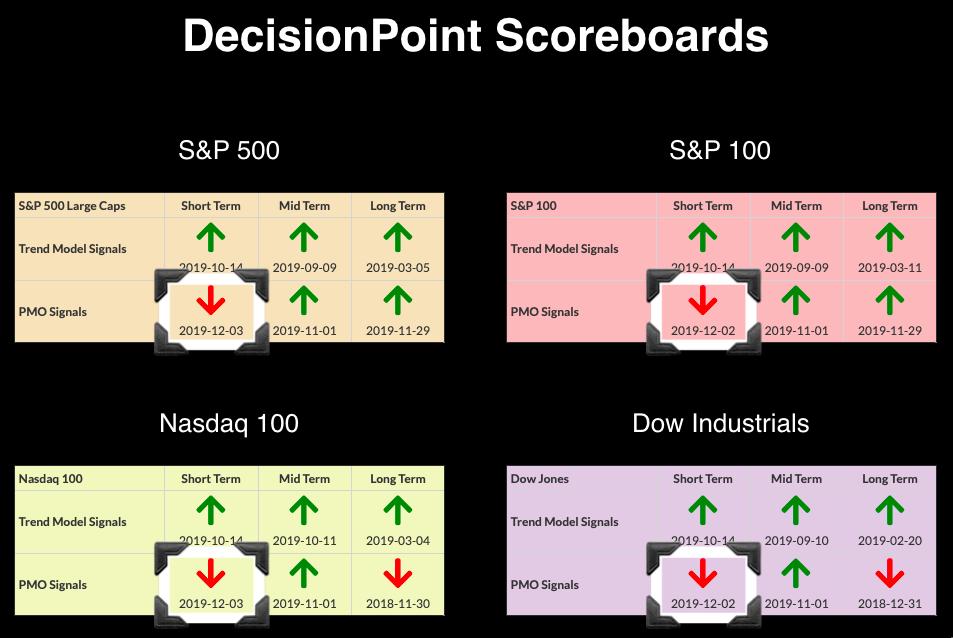
This week, we saw four new Short-Term Price Momentum Oscillator (PMO) SELL signals on the DP Scoreboards for all indexes. Last week, at month-end, we got two new Long-Term PMO BUY signals. Clearly short-term momentum has slowed, but, in the longer term, the picture isn't too pessimistic. I recommend you read Carl's Weekly Wrap from last Friday as he wrote about the monthly charts that went final. The OBV shows a positive divergence off the recent price low and I see what could be a buying initiation on the climactic indicators for the very short term.
The DecisionPoint Alert presents a mid-week assessment of the trend and condition of the stock market (S&P 500), the U.S. Dollar, Gold, Crude Oil and Bonds.
Watch the latest episode of DecisionPoint on StockCharts TV's YouTube channel here!
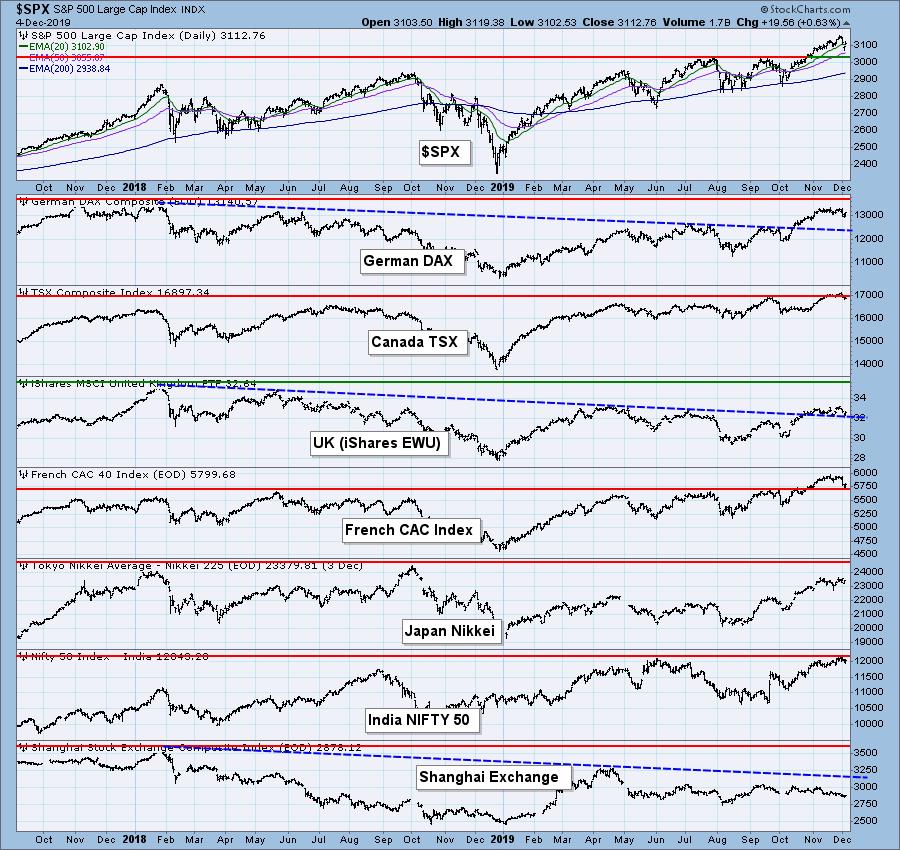
GLOBAL MARKETS
Note that China is still in a bear market.
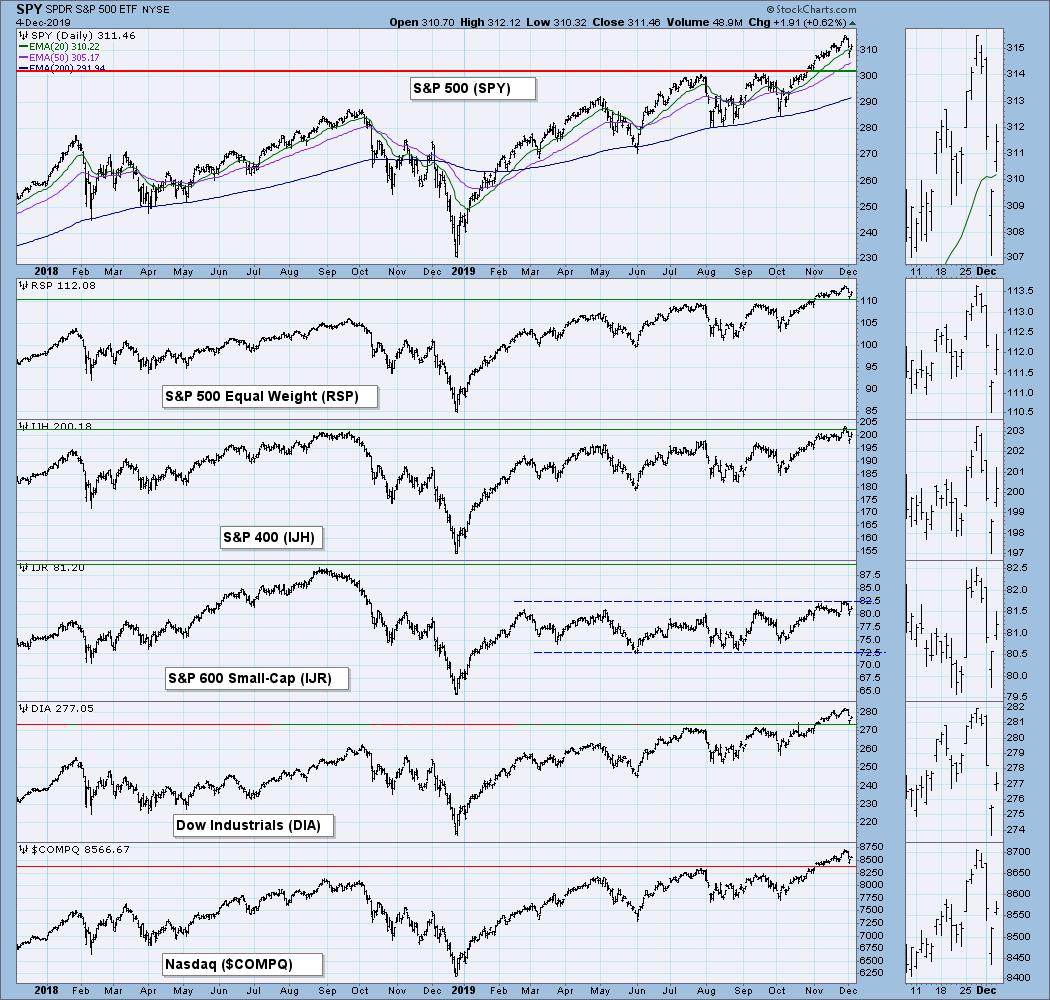
BROAD MARKET INDEXES
The SP400 finally broke all-time highs, but we can see that small-caps are still in a trading range well below its previous all-time highs.
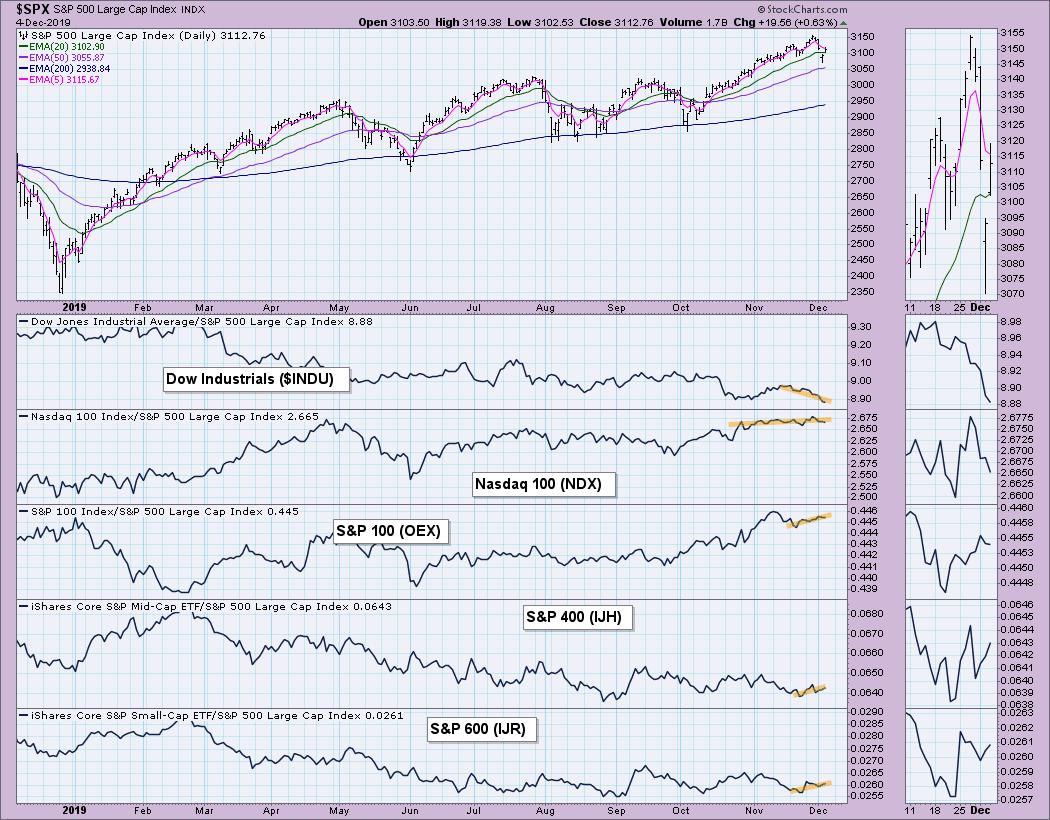
MARKET INDEXES PRICE RELATIVE TO SPX
I'm happy to see the Mid-Caps and Small-Caps outperforming again.
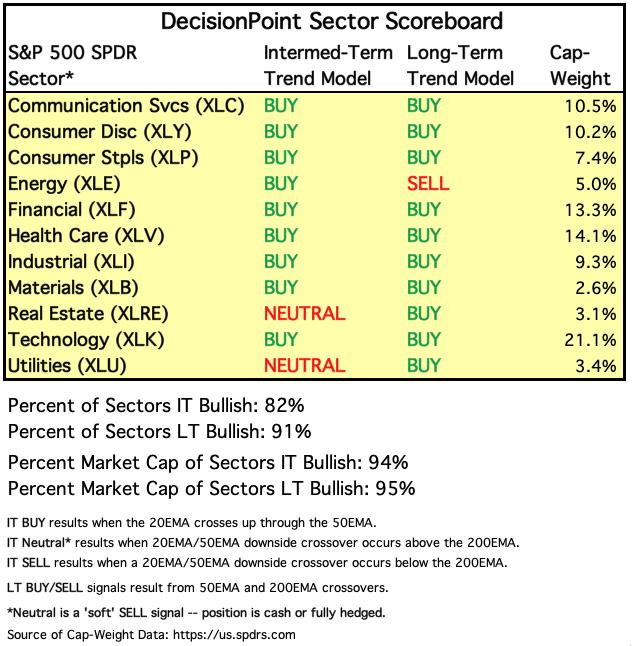
SECTORS
Each S&P 500 Index component stock is assigned to one, and only one, of eleven major sectors. This is a snapshot of the Intermediate-Term and Long-Term Trend Model signal status for those sectors.
STOCKS
IT Trend Model: BUY as of 9/4/2019
LT Trend Model: BUY (SPY) as of 2/26/2019
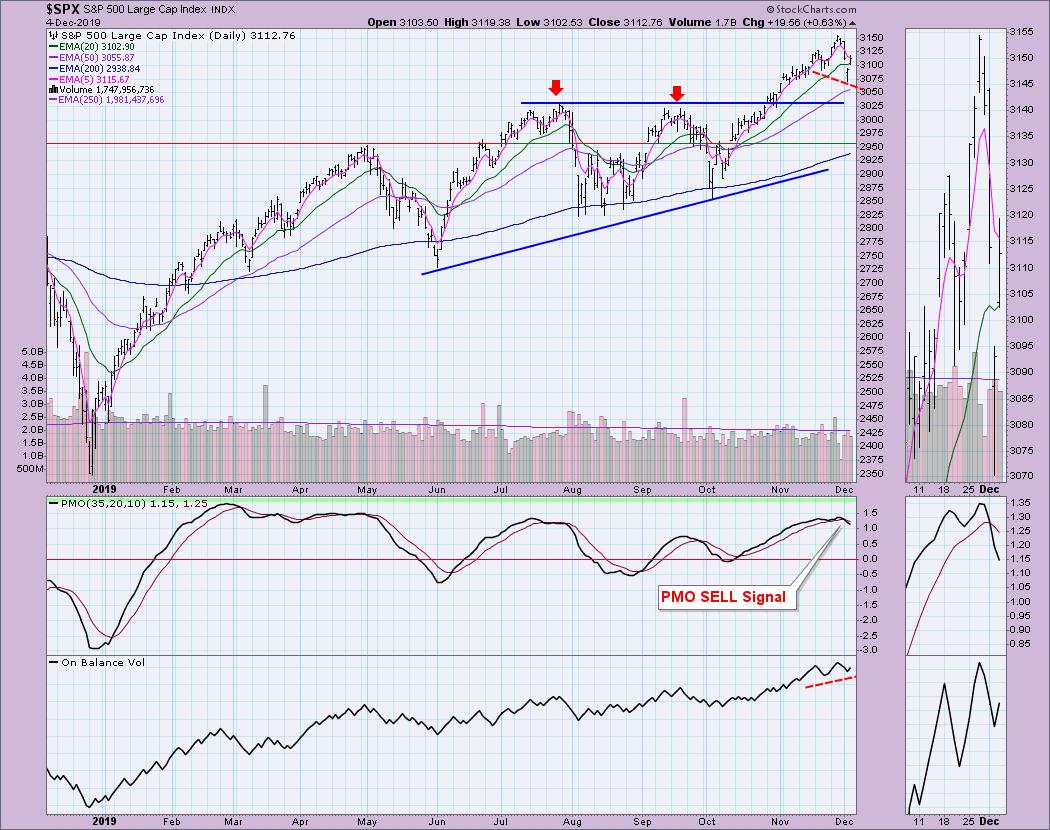
SPX Daily Chart: We got the expected breakout from the ascending triangle formation. It didn't reach the target for the pattern, so we could see some upside off of this pullback. The OBV shows rising bottoms coordinated with lower lows on price bottoms. That forms a positive divergence in the shorter term. Despite heavy volume selling, the OBV didn't deteriorate. The PMO SELL signal is concerning, which is why I remain cautiously optimistic. The typical range for the PMO is +2 to -2, so if it shifts upward, there is still plenty of room before the PMO gets to extremely overbought conditions.
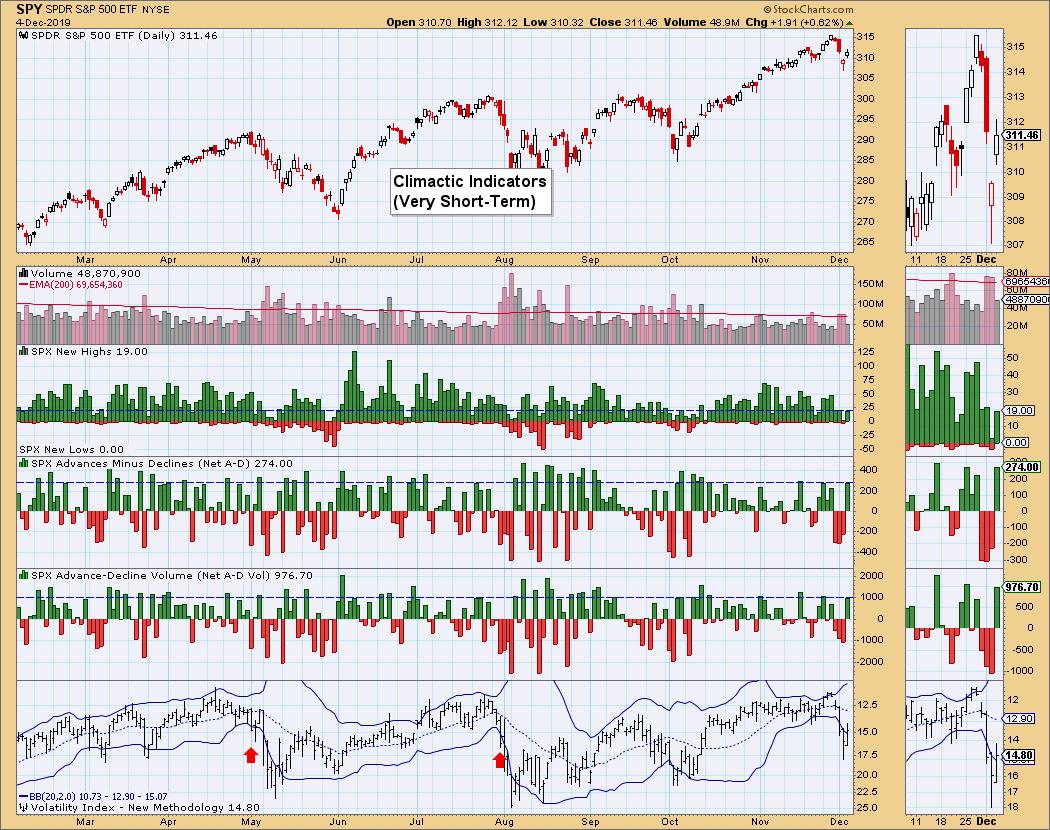
Climactic Market Indicators:
Three days with drops below the bottom Bollinger Band on the VIX tells me that it is likely time for a move higher. Combined with climactic advance/decline readings to the upside, I am looking at this as a possible buying initiation.
Short-Term Market Indicators: These indicators don't look great, but they are decelerating in near-term neutral to oversold territory. What bothers me is the deep dive we see on %above 20-EMA and %PMO Rising. However, a deep dive makes for a move to oversold territory. Oversold indicators are a good thing; when we see them turn to the upside, that's the point where I'll consider buying into the market.
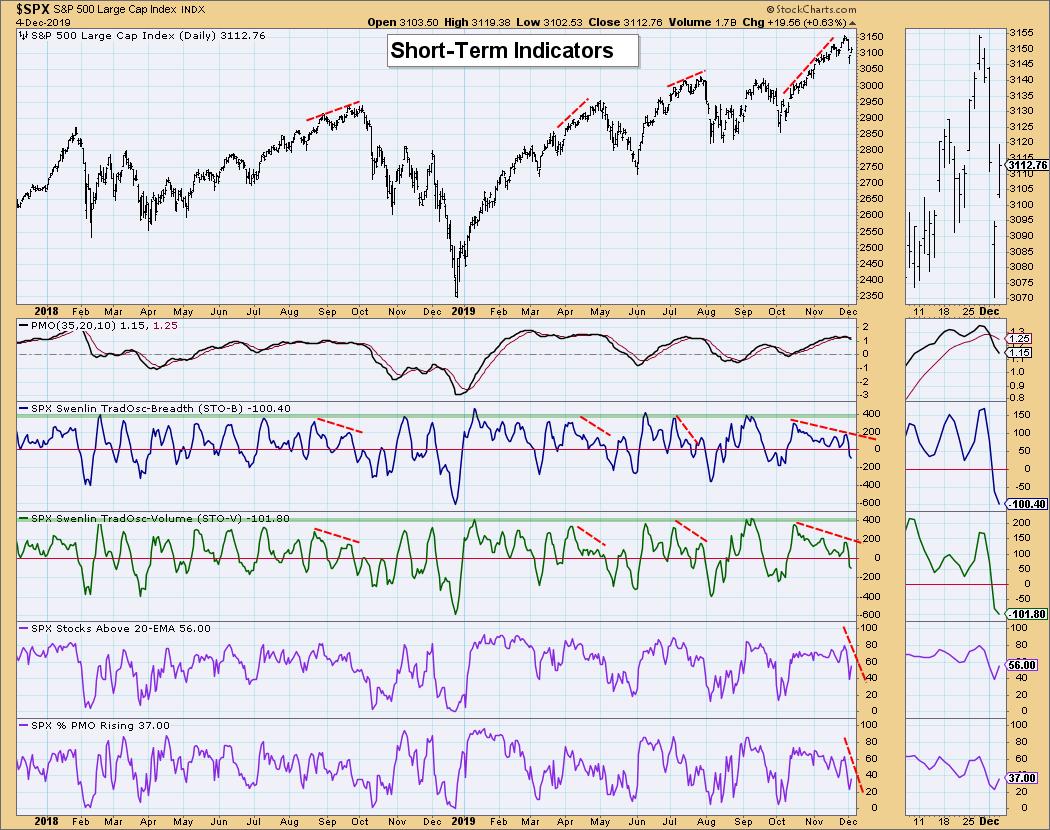
Intermediate-Term Market Indicators: The negative divergences remain and we aren't really seeing any true deceleration on them. They haven't quite reached neutral territory yet.
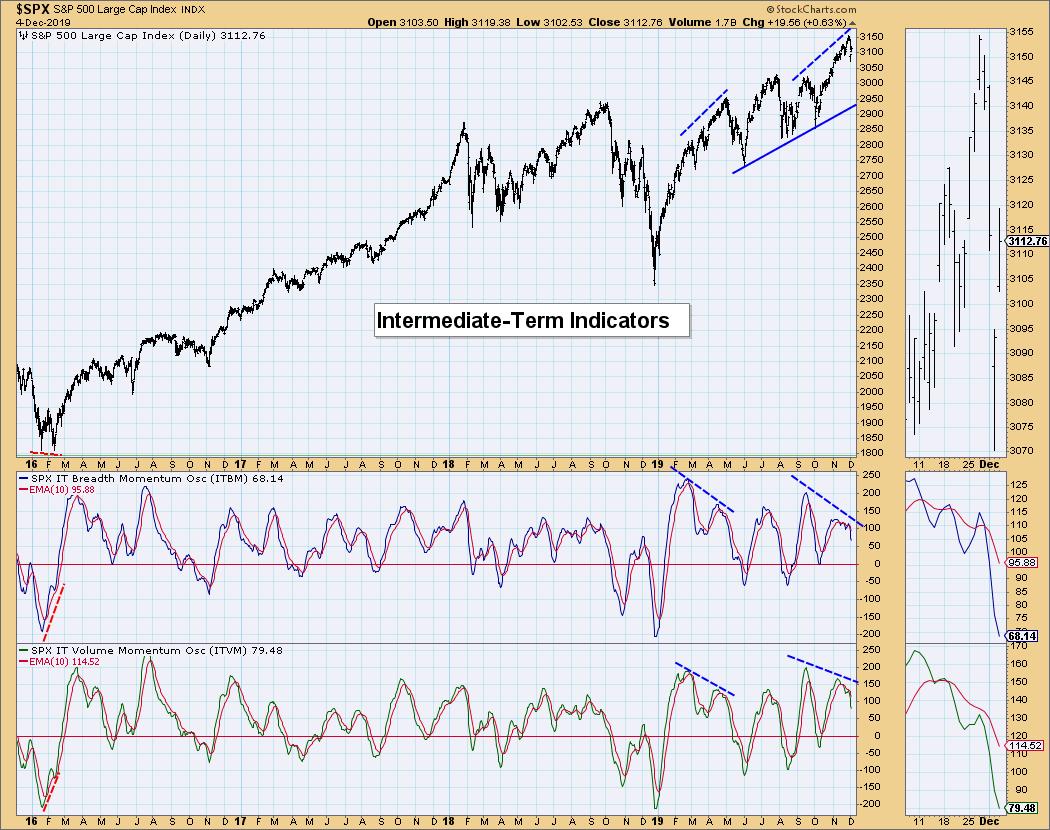
Conclusion: There are plenty of mixed messages to consider this week. Seeing ST PMO SELL signals on all four major indexes is a problem, as it certainly suggests more downside. However, the climactic indicators call for more upside and the positive divergence on the OBV is encouraging. I suspect we will see some more upside in the very short term with a high likelihood of a bigger decline later.
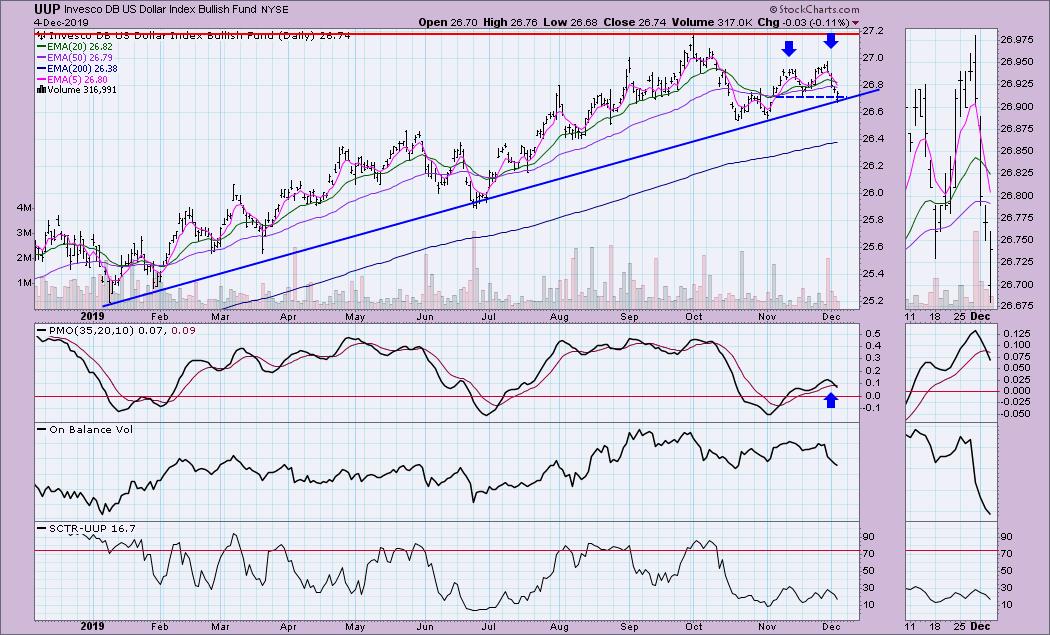
DOLLAR (UUP)
IT Trend Model: BUY as of 11/7/2019
LT Trend Model: BUY as of 5/25/2018
UUP Daily Chart: We see the double-bottom at the end of October executed, but moved right back into a bearish double-top. With the PMO SELL signal in play and a possible breakdown of an intermediate-term rising trend, I will likely be selling my UUP shares tomorrow unless we see a good bounce.
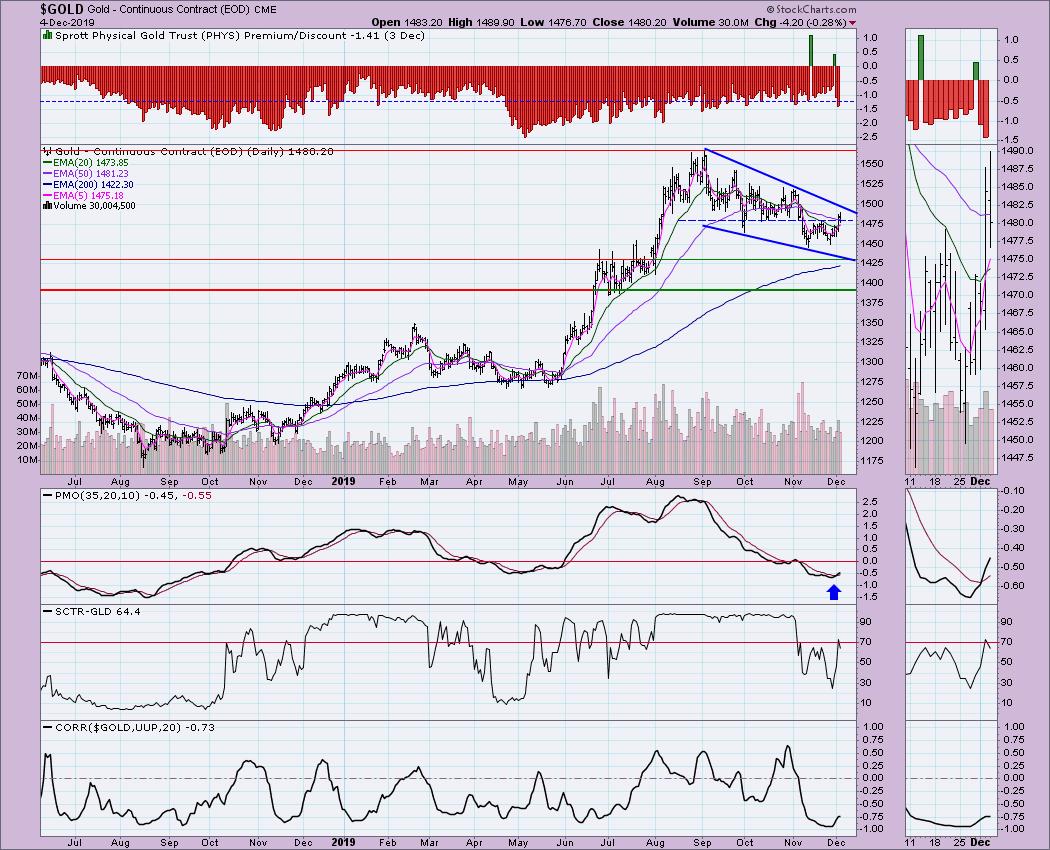
GOLD
IT Trend Model: Neutral as of 11/8/2019
LT Trend Model: BUY as of 1/8/2019
GOLD Daily Chart: The bullish falling wedge is now ripe for a breakout. Discounts are increasing again and that means sentiment for Gold is bearish. Sentiment is contrarian, so large discounts generally are bullish for price. The PMO has just locked in a new BUY signal in near-term oversold territory. If the Dollar continues to fail, Gold should see a nice breakout.
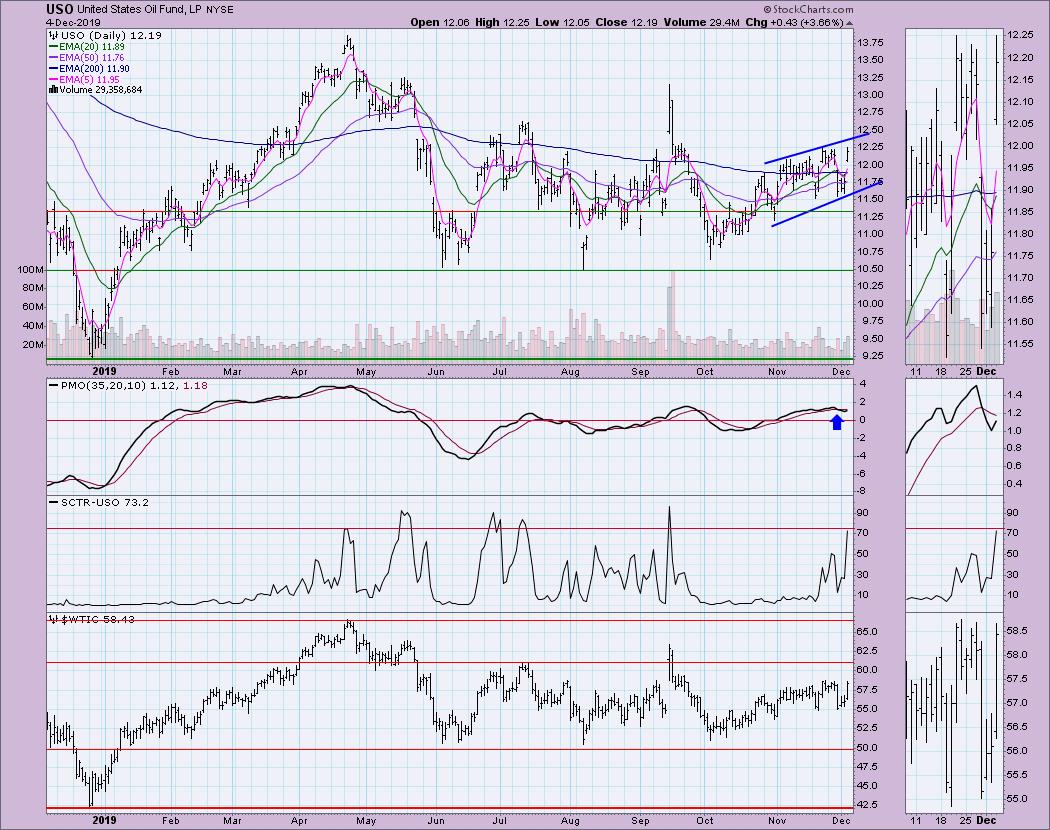
CRUDE OIL (USO)
IT Trend Model: SELL as of 10/2/2019
LT Trend Model: SELL as of 6/4/2019
USO Daily Chart: What used to be a rising trend channel has now turned into a bearish ascending wedge. The PMO ticked up today on the big rally in Oil. However, it is now close to the top of this wedge. I would look for falling prices rather than an upside breakout from a bearish pattern.
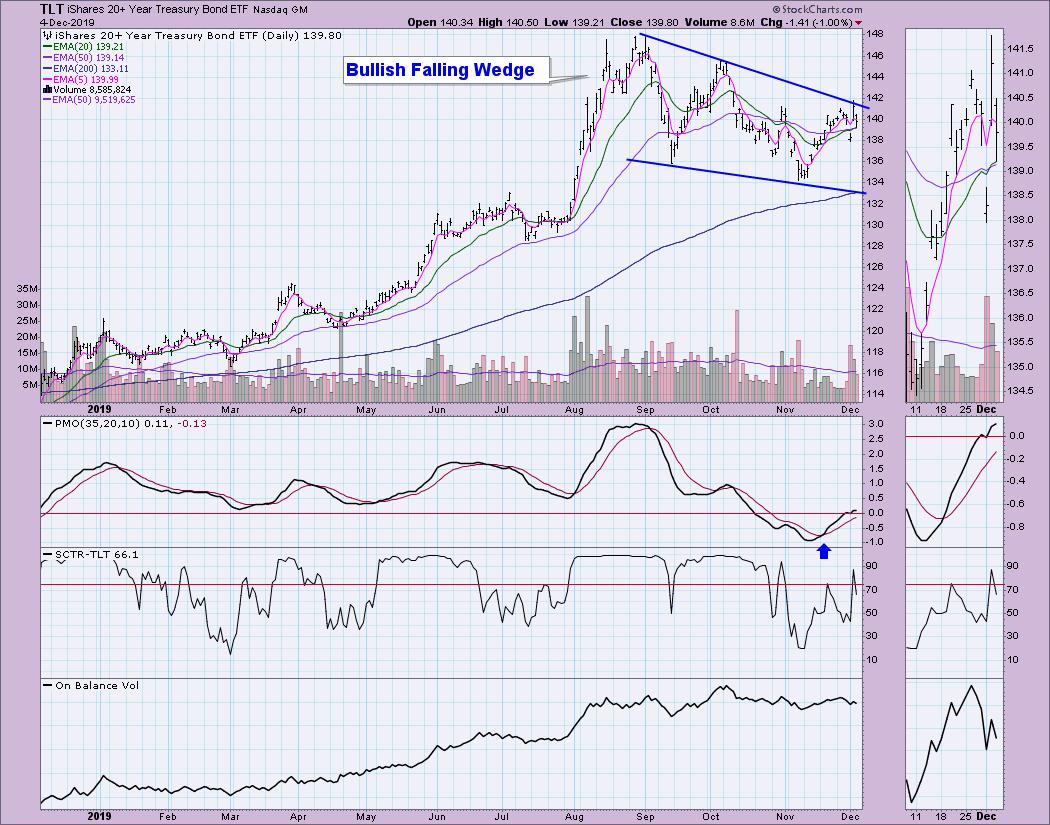
BONDS (TLT)
IT Trend Model: Neutral as of 10/28/2019
LT Trend Model: BUY as of 1/2/2019
TLT Daily Chart: We have a falling wedge still in play on TLT. It struggled to break out this week, ultimately failing to do so. I thought this would be the breakout moment, but price failed at the top of the wedge. The PMO is now above the zero line, so I am still expecting an upside breakout.
Technical Analysis is a windsock, not a crystal ball.
Happy Charting! - Erin
Email: erinh@stockcharts.com
Do Not Miss Market Vision 2020 Online Conference!
I will be presenting at the "Market Vision 2020" online conference on January 4th! It is sponsored by EarningsBeats.com and promises to be "THE" event to start the new year. We will have many of the commentators that you love presenting their "market view" for 2020, with John Murphy as the keynote speaker! For information on the event, sign up for the free emails that will give you all the details as we get closer!

Erin Swenlin will be presenting at the The MoneyShow Las Vegas May 11-13, 2020! You'll have an opportunity to meet Erin and discuss the latest DecisionPoint news and Diamond Scans. The conference is free to attend or view online!
**Don't miss any of the DecisionPoint commentaries! Go to the "Notify Me" box toward the end of this blog page to be notified as soon as they are published.**
NOTE: The signal status reported herein is based upon mechanical trading model signals, specifically the DecisionPoint Trend Model. These define the implied bias of the price index based upon moving average relationships, but they do not necessarily call for a specific action. They are information flags that should prompt chart review. Further, they do not call for continuous buying or selling during the life of the signal. For example, a BUY signal will probably (but not necessarily) return the best results if action is taken soon after the signal is generated. Additional opportunities for buying may be found as price zigzags higher, but the trader must look for optimum entry points. Conversely, exit points to preserve gains (or minimize losses) may be evident before the model mechanically closes the signal.
Helpful DecisionPoint Links:
DecisionPoint Shared ChartList and DecisionPoint Chart Gallery
Price Momentum Oscillator (PMO)
Swenlin Trading Oscillators (STO-B and STO-V)
