
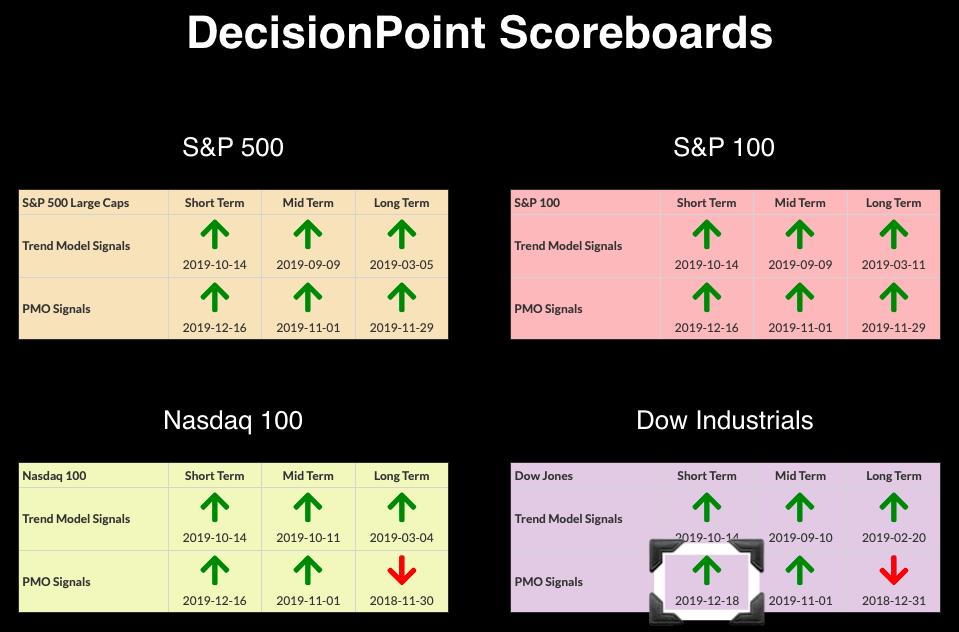
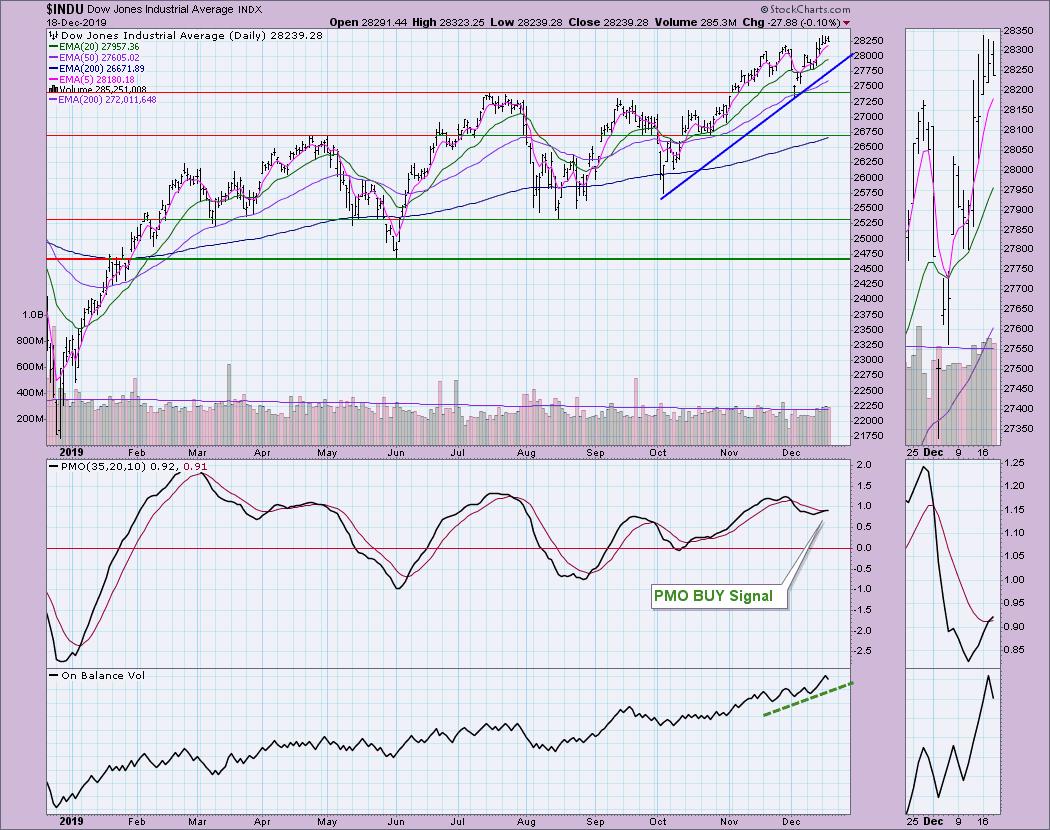
For consistency, I have adopted Carl's Weekly Wrap ChartStyles for the Mid-Week Alert. I hope you find them as helpful as I do! We had a new Short-Term Price Momentum Oscillator (PMO) BUY signal arrive for the Dow Industrials today; it was only delayed by a few days compared to the SPX, OEX and NDX. I've included the Dow chart below the Scoreboards. The market is certainly on the overbought side, but the indicators are confirming the rise and suggest we could see more going into January.
OBV is confirming the current rise. If you look in the thumbnail, you can see a very short-term bull flag. Support at the November top should hold.
The DecisionPoint Alert Mid-Week presents an assessment of the trend and condition of the stock market (S&P 500), the U.S. Dollar, Gold, Crude Oil and Bonds as of Wednesday's close.
Watch the latest episode of DecisionPoint on StockCharts TV's YouTube channel here!
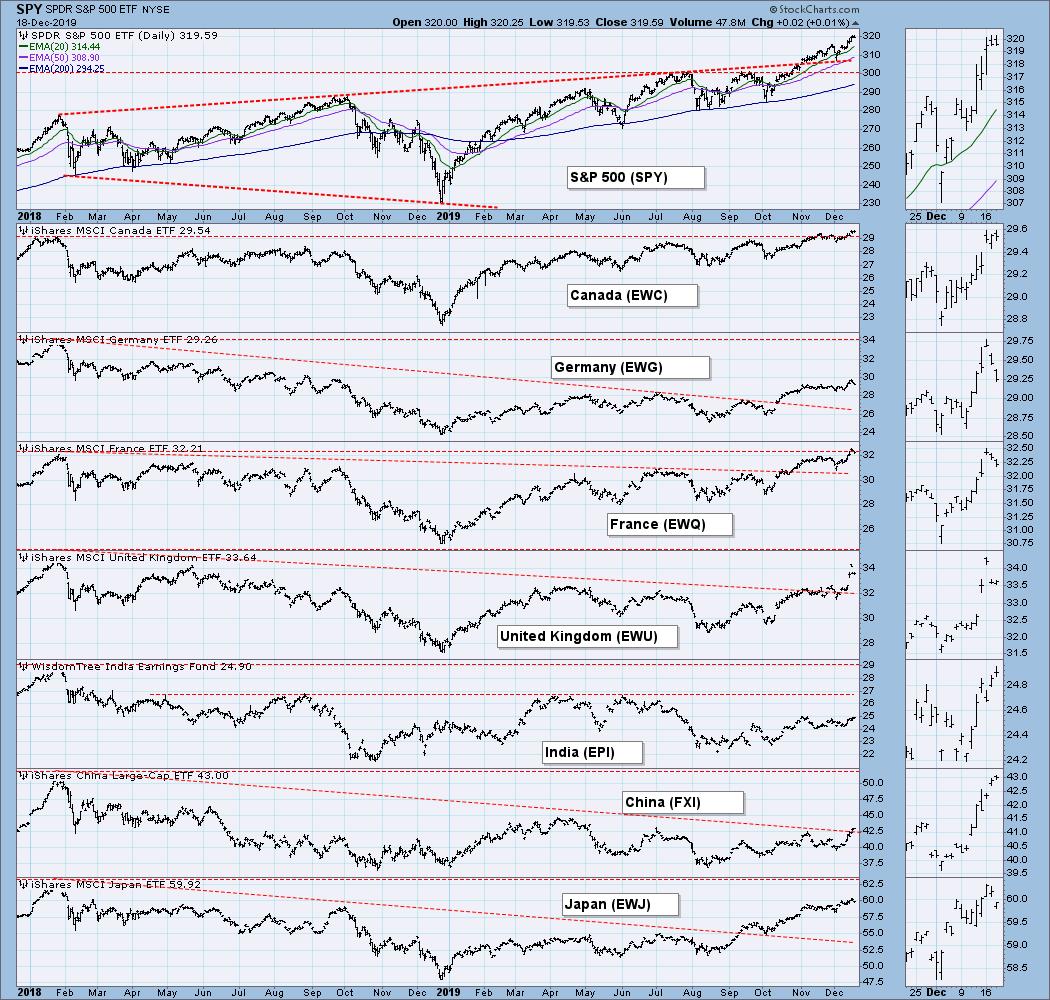
GLOBAL MARKETS
China appears to be coming out of its bear market. They have definitely been the laggard globally.
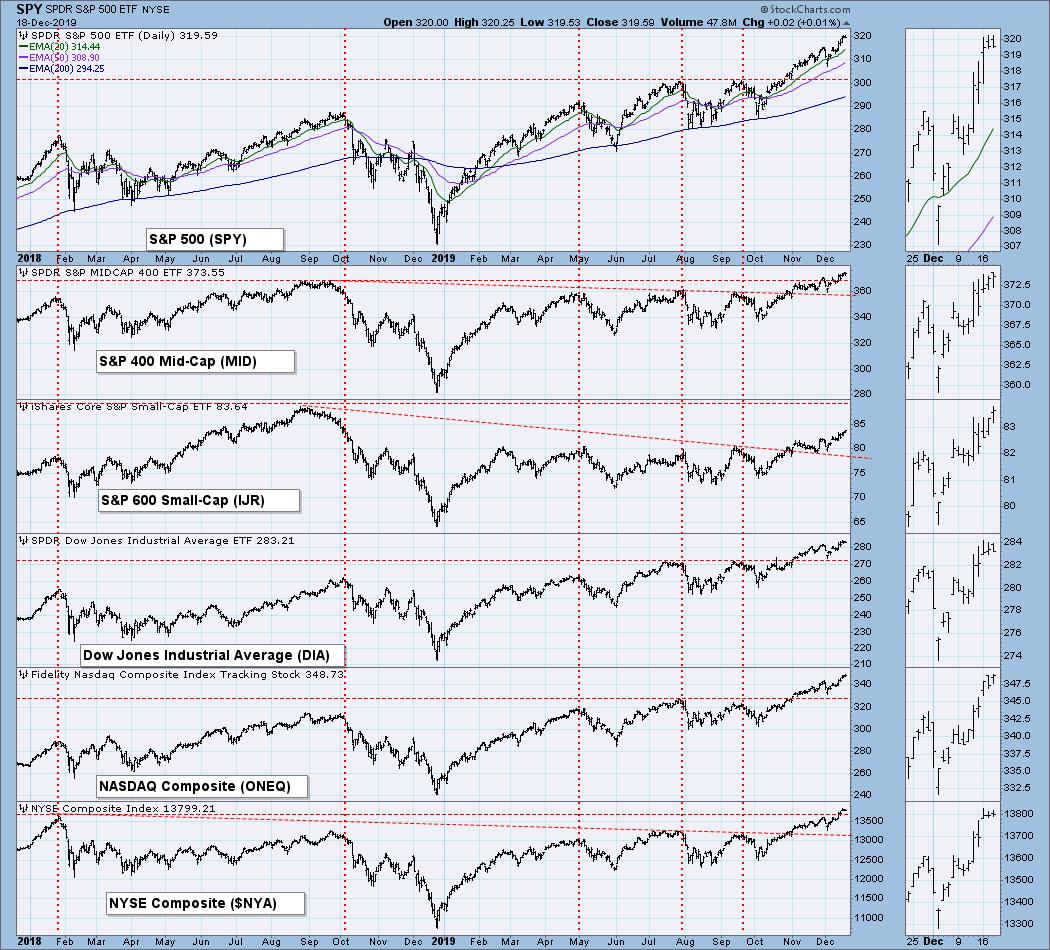
BROAD MARKET INDEXES
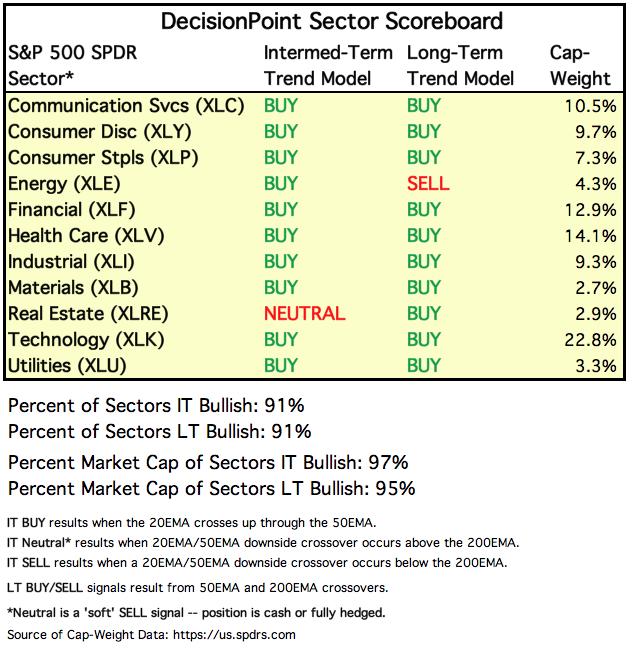
SECTORS
Each S&P 500 Index component stock is assigned to one, and only one, of eleven major sectors. This is a snapshot of the Intermediate-Term and Long-Term Trend Model signal status for those sectors.
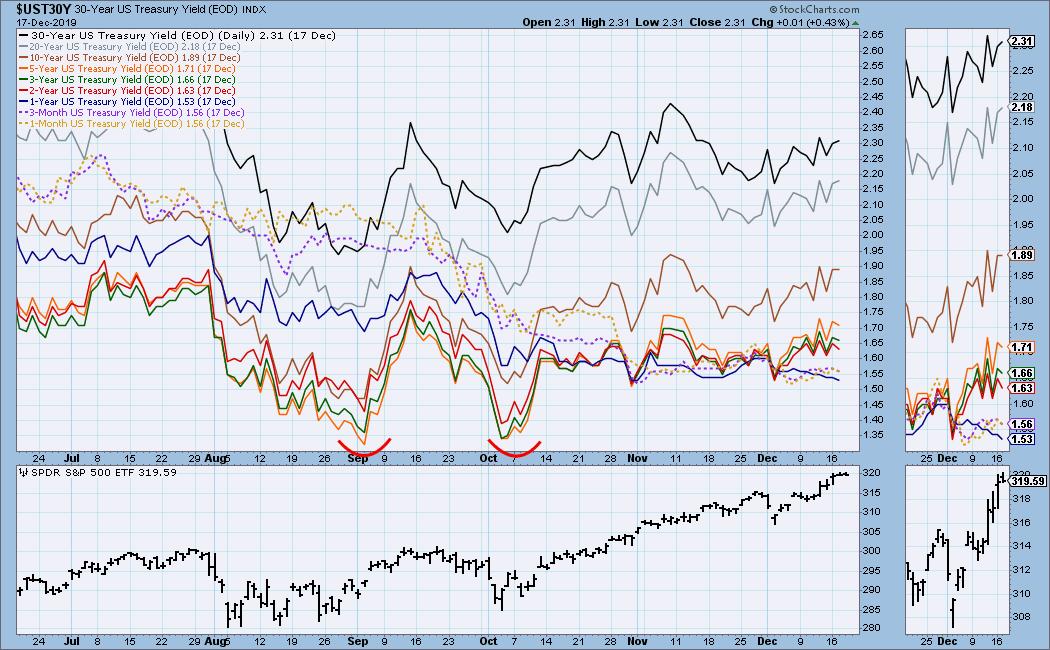
INTEREST RATES
This chart is included so we can monitor rate inversions. In normal circumstances, the longer money is borrowed, the higher the interest rate that must be paid. When rates are inverted, the reverse is true.
STOCKS
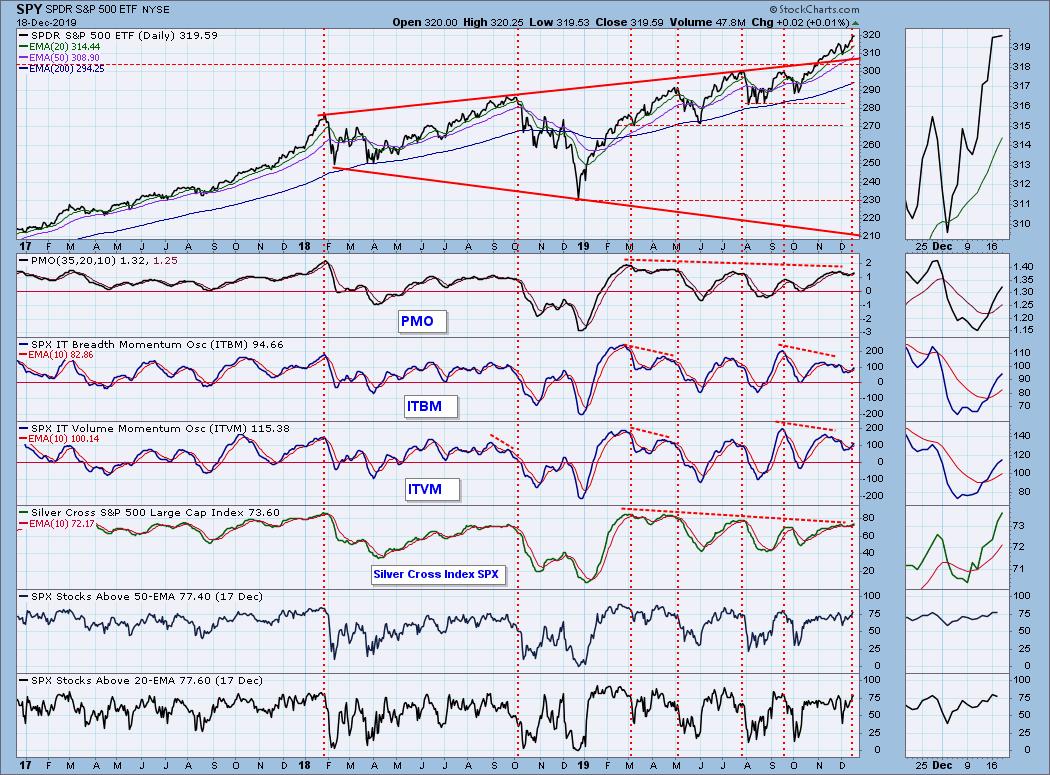
IT Trend Model: BUY as of 9/6/2019
LT Trend Model: BUY as of 2/26/2019
SPY Daily Chart: The market continues to travel higher within the rising trend channel, though it has seemed to take a pause so far this week. The PMO BUY signal arrived on Monday. I note that we are seeing volume on the SPX that is above its 250-EMA; however, notice that buyers of the SPY seem to be dwindling somewhat. Overall it is a strong volume pattern on the OBV.
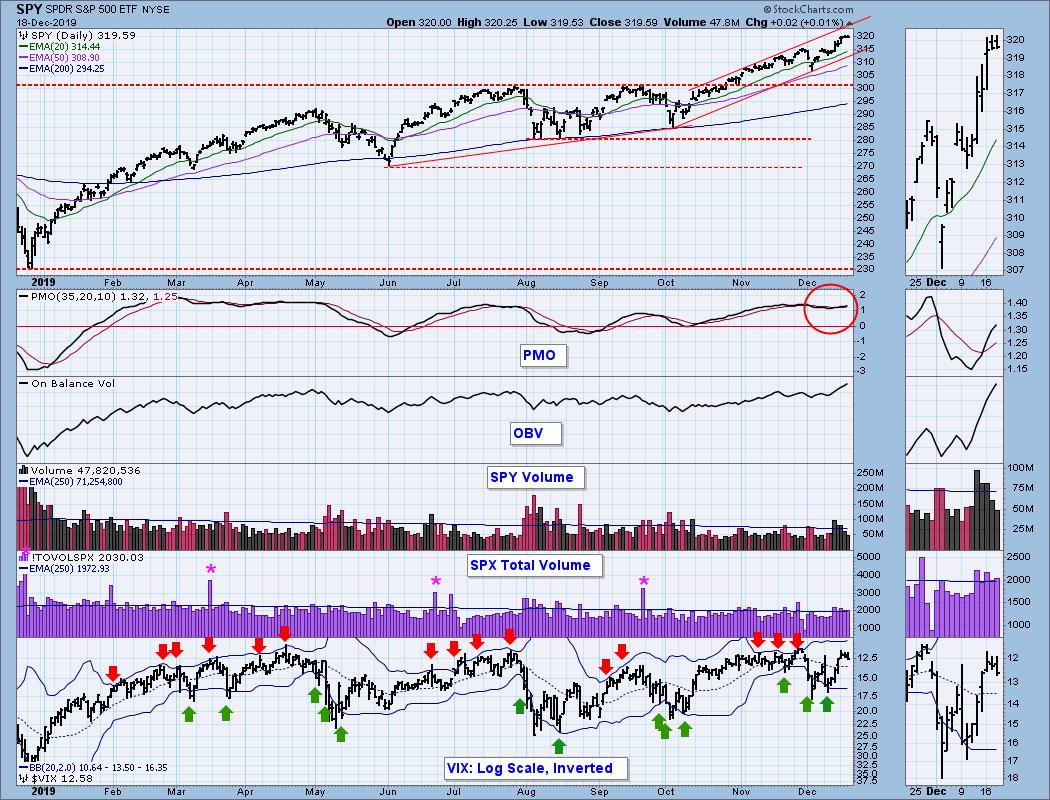
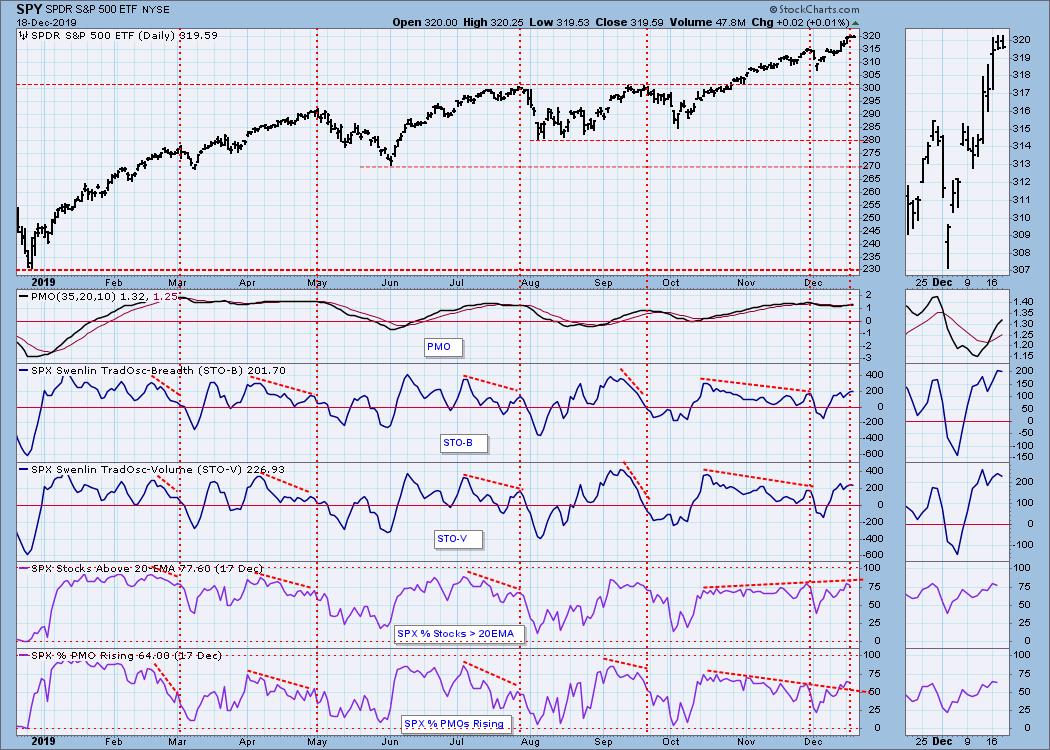
Climactic Market Indicators: We didn't see anything climactic today. The VIX has paused, but still has plenty of room to travel to the upside before signaling a short-term decline with a penetration of the upper Bollinger Band.
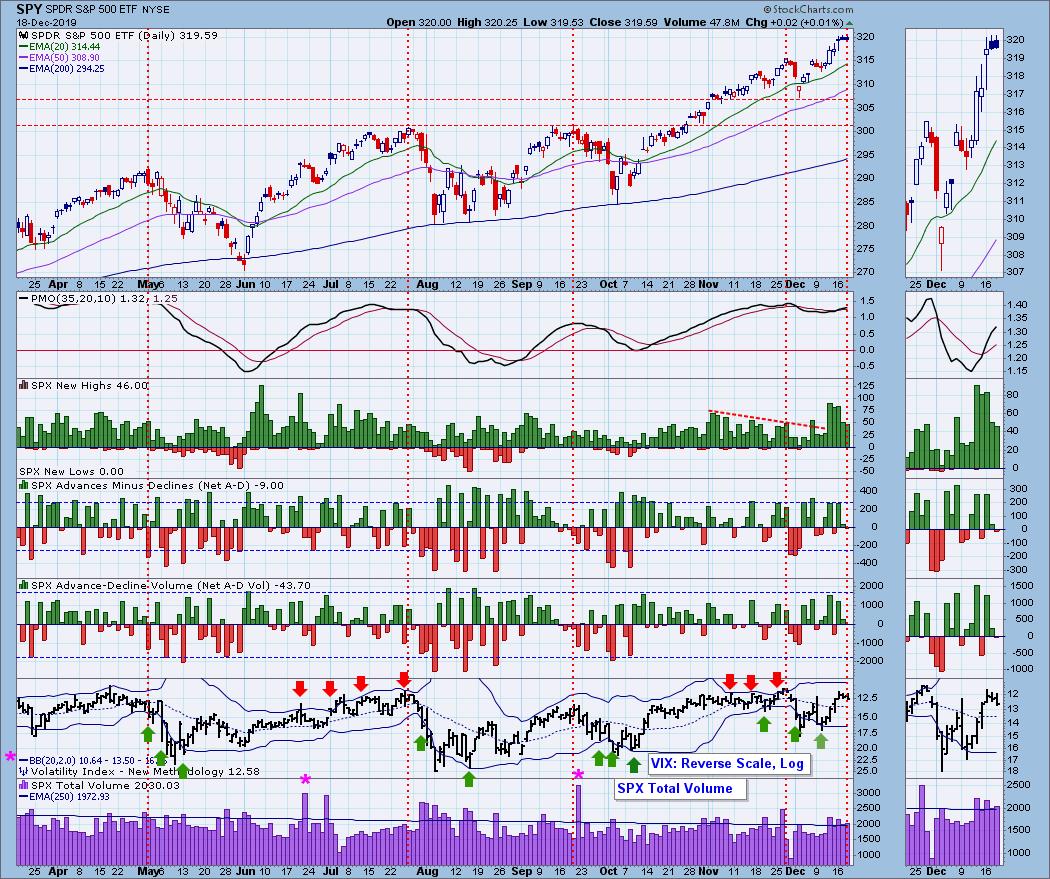
Short-Term Market Indicators: These indicators may have topped, but overall they are trending higher along with the market. I don't see any current negative divergences, which is bullish. Note that we are seeing more improvement as more stocks move above their 20-EMAs and have rising PMOs.
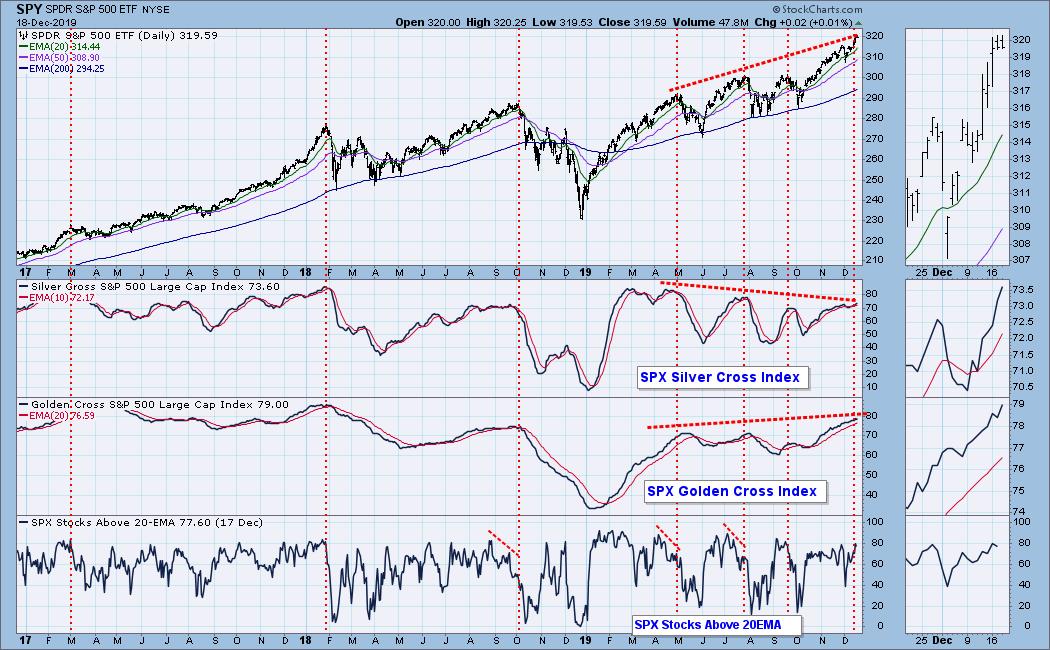
Intermediate-Term Market Indicators: More improvement is visible on the Golden Cross and Silver Cross Indexes. These readings can certainly support higher prices.
We have positive crossovers on both the ITBM and ITVM. They are continuing to rise and aren't really overbought.
CONCLUSION: Volume is supporting the current price rise; we are now seeing more participation from the rest of the S&P 500, as more and more have positive 20/50-EMA crossovers (Silver Cross Index) and are rising above their 20-EMAs. It appears that Santa Claus will indeed be coming to town, unlike last year when we saw the crash right before the holidays.
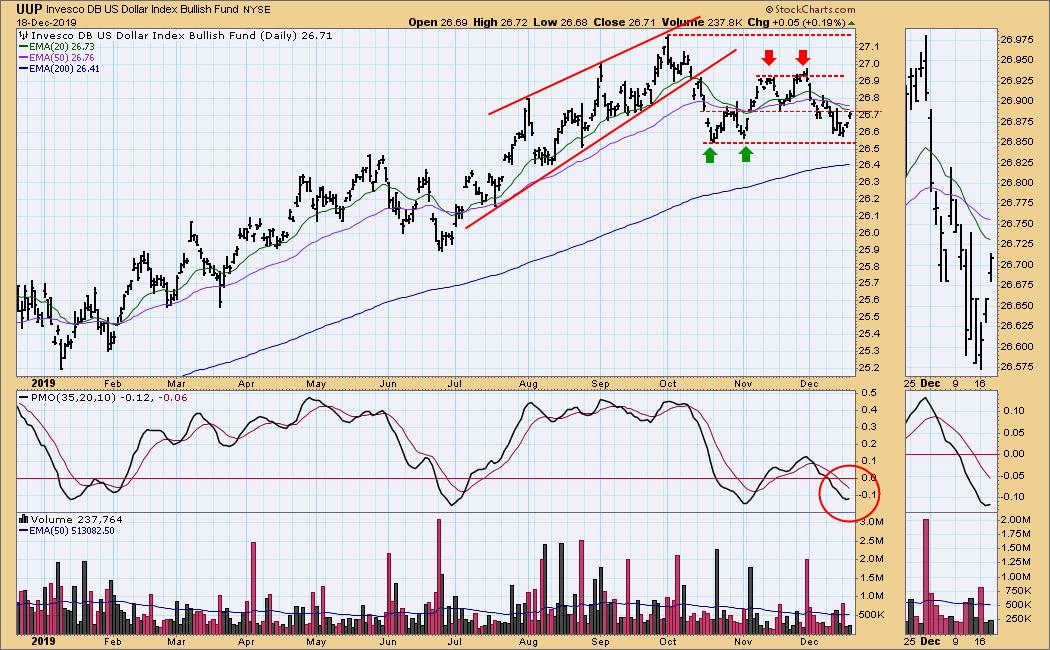
DOLLAR (UUP)
IT Trend Model: NEUTRAL as of 12/11/2019
LT Trend Model: BUY as of 5/25/2018
UUP Daily Chart: Price has bounced off support at the October lows and has now reached the confirmation line, which was shared by the double-bottom at first and then the double-top in November. The PMO has turned up in oversold territory. Thus, despite a recent ITTM Neutral signal on 12/11, I am looking for higher prices.
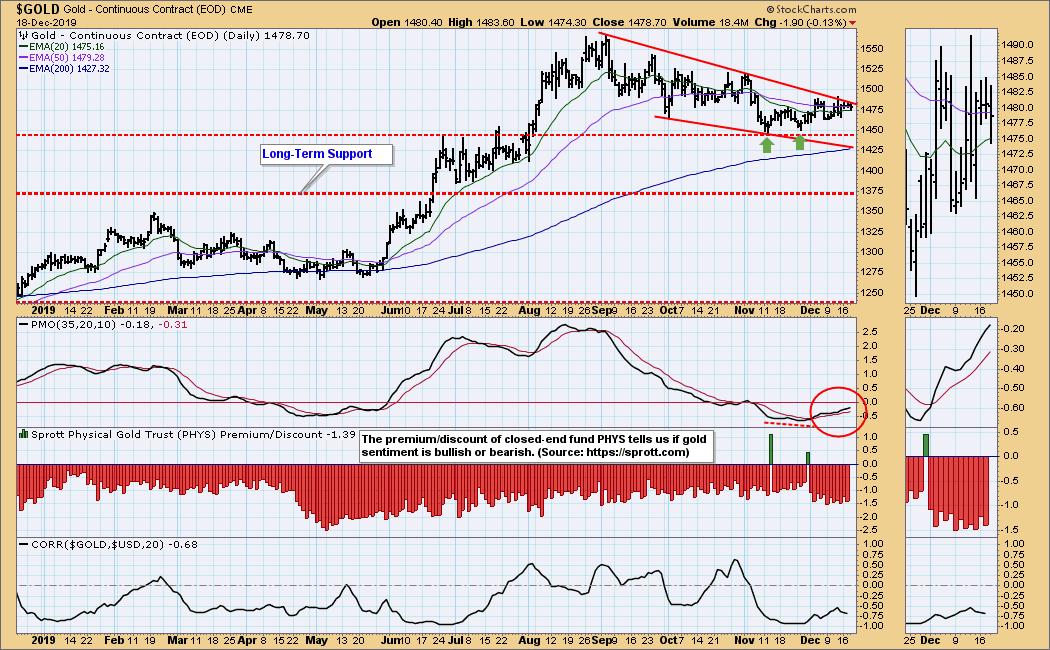
GOLD
IT Trend Model: NEUTRAL as of 11/8/2019
LT Trend Model: BUY as of 1/8/2019
GOLD Daily Chart: Gold continues to tease as it travels mostly sideways within the bullish falling wedge pattern. The PMO is rising on a BUY signal. Discounts remain high, which is bullish for Gold. I'm expecting an upside breakout.
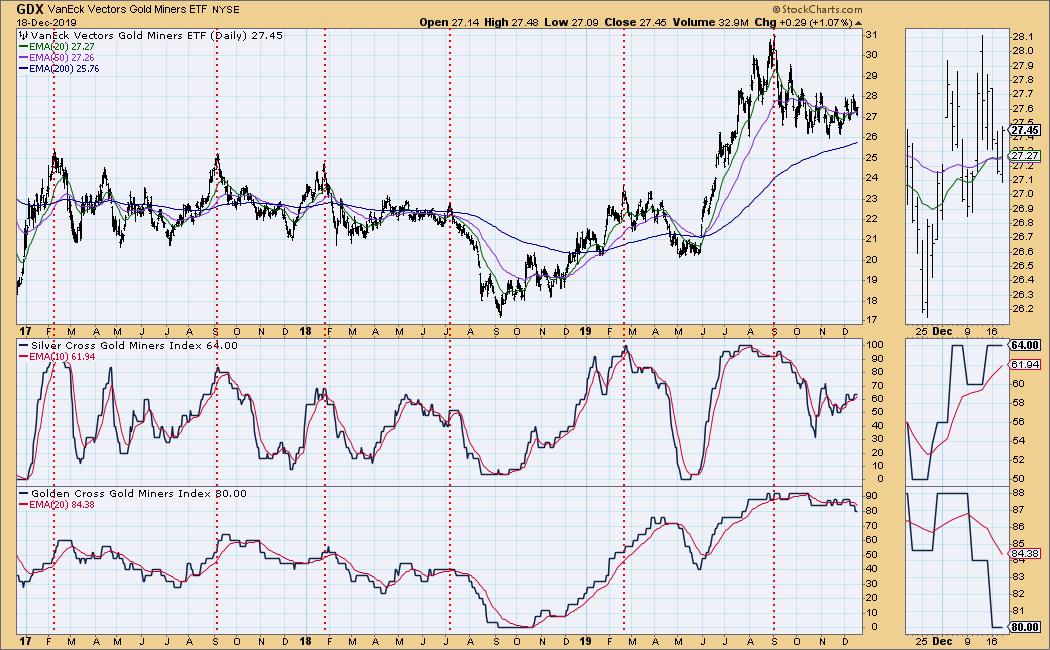
GOLD MINERS Golden and Silver Cross Indexes: We have added a Gold and Silver Cross Index for the Gold Miners, so we are adding it to this section of the DP Alert. The rising Silver Cross Index suggests we could see that breakout in Gold. While the Gold Cross Index is falling somewhat, 80% is a nice number and can support higher prices.
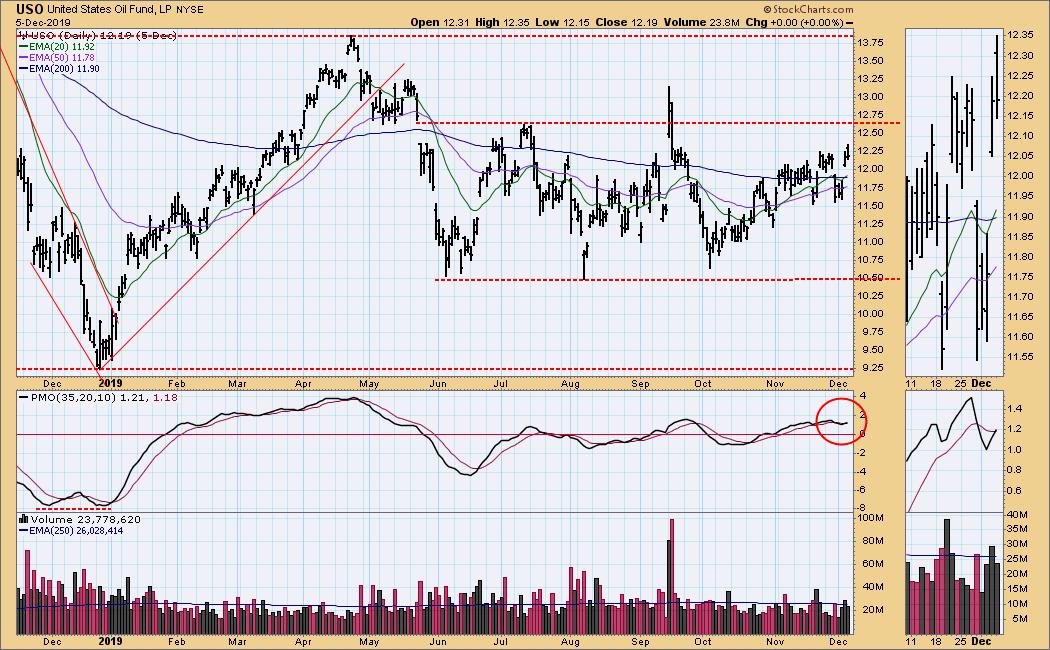
CRUDE OIL (USO)
IT Trend Model: BUY as of 11/6/2019
LT Trend Model: SELL as of 6/4/2019
USO Daily Chart: Oil remains in a wide trading range. The PMO has reversed and triggered a whipsaw PMO BUY signal. I am looking for price to challenge the July high. At that point, we can reevaluate the PMO, which could find itself overbought at that point.
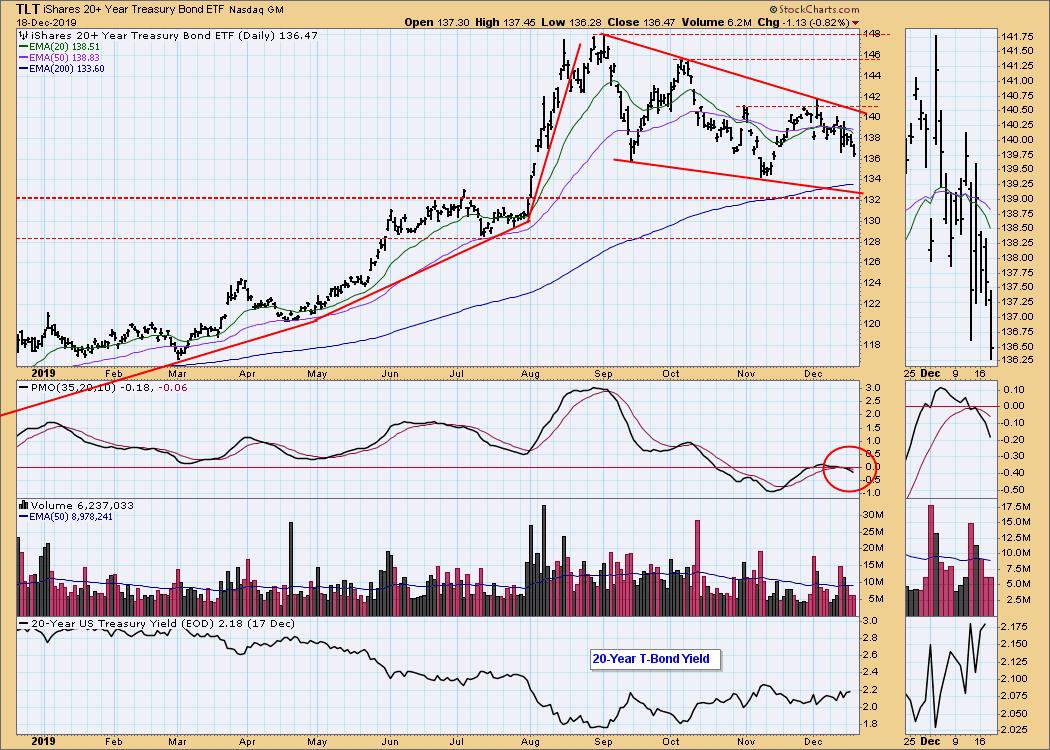
BONDS (TLT)
IT Trend Model: NEUTRAL as of 12/12/2019
LT Trend Model: BUY as of 1/2/2019
TLT Daily Chart: Bonds are mixed. We do have a bullish falling wedge pattern, but the PMO just triggered a SELL signal below the zero line. I would look for price to test the bottom of this wedge once again.
**Don't miss any of the DecisionPoint commentaries! Go to the "Notify Me" box toward the end of this blog page to be notified as soon as they are published.**
Technical Analysis is a windsock, not a crystal ball.
Happy Charting! - Erin
Email: erinh@stockcharts.com
Special Announcement!
I will be presenting at the "Market Vision 2020" online conference on January 4th! It is sponsored by EarningsBeats.com and promises to be "THE" event to start the new year. We will have many of the commentators that you love presenting their "market view" for 2020, with John Murphy as the keynote speaker! For information on the event, sign up for the free emails that will give you all the details as we get closer!

Erin Swenlin will be presenting at the The MoneyShow Las Vegas May 11-13, 2020! You'll have an opportunity to meet Erin and discuss the latest DecisionPoint news and Diamond Scans. The conference is free to attend or view online!
**Don't miss any of the DecisionPoint commentaries! Go to the "Notify Me" box toward the end of this blog page to be notified as soon as they are published.**
NOTE: The signal status reported herein is based upon mechanical trading model signals, specifically the DecisionPoint Trend Model. These define the implied bias of the price index based upon moving average relationships, but they do not necessarily call for a specific action. They are information flags that should prompt chart review. Further, they do not call for continuous buying or selling during the life of the signal. For example, a BUY signal will probably (but not necessarily) return the best results if action is taken soon after the signal is generated. Additional opportunities for buying may be found as price zigzags higher, but the trader must look for optimum entry points. Conversely, exit points to preserve gains (or minimize losses) may be evident before the model mechanically closes the signal.
Helpful DecisionPoint Links:
DecisionPoint Shared ChartList and DecisionPoint Chart Gallery
Price Momentum Oscillator (PMO)
Swenlin Trading Oscillators (STO-B and STO-V)


