I have been noticing on the business channels that analysts have become quite complacent regarding their market outlook. They remind me of the line from an old favorite song, "Nothing but blue skies do I see." Yesterday I posted the latest *NAAIM Exposure Index number and snapped to attention -- they are 98% long. I take this as a warning that sentiment is dangerously bullish. Such readings don't always signal market tops, and when they do, it isn't always a major top, but it pays to take notice. As you might imagine, I have some ideas about this, and I will dig deeper later in this article.
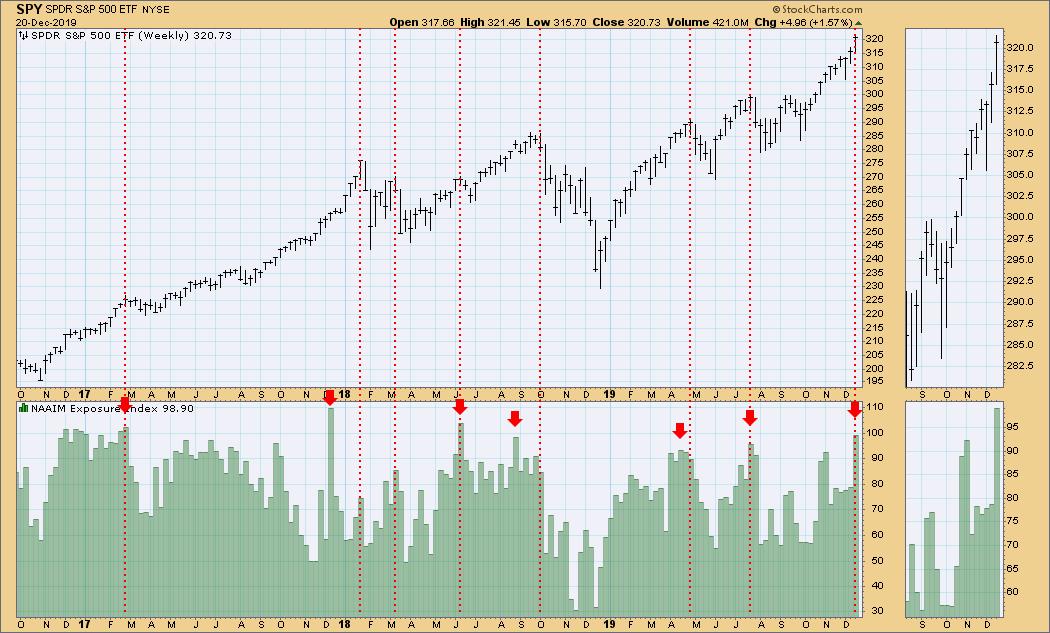
*NAAIM is the National Association of Active Investment Managers. The Exposure Index shows the average percentage of member exposure, and the range is -200% (short) to +200% (long), but it rarely gets over +100% and it is only been negative twice, and then only by tiny amounts.
The DecisionPoint Weekly Wrap presents an end-of-week assessment of the trend and condition of the stock market (S&P 500), the U.S. Dollar, Gold, Crude Oil, and Bonds.
Watch the latest episode of DecisionPoint on StockCharts TV's YouTube channel here!
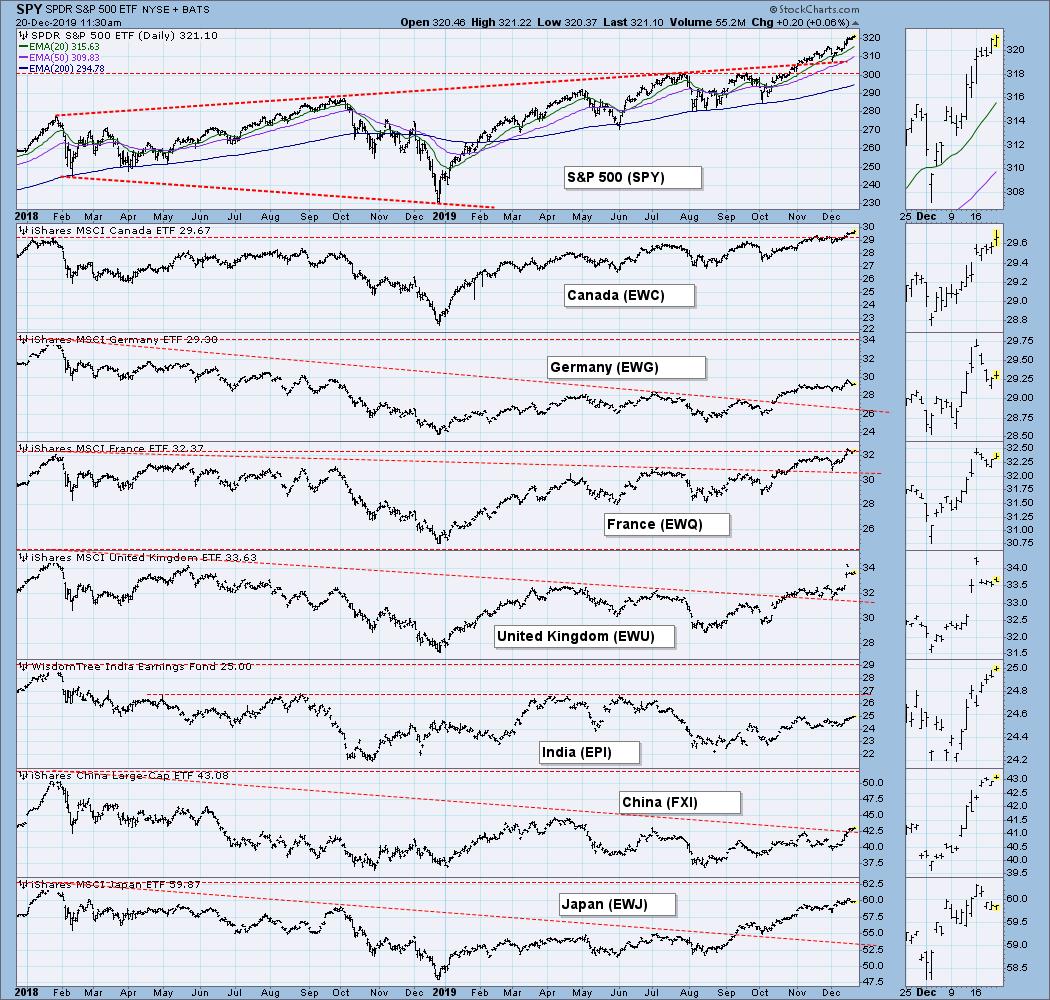
GLOBAL MARKETS
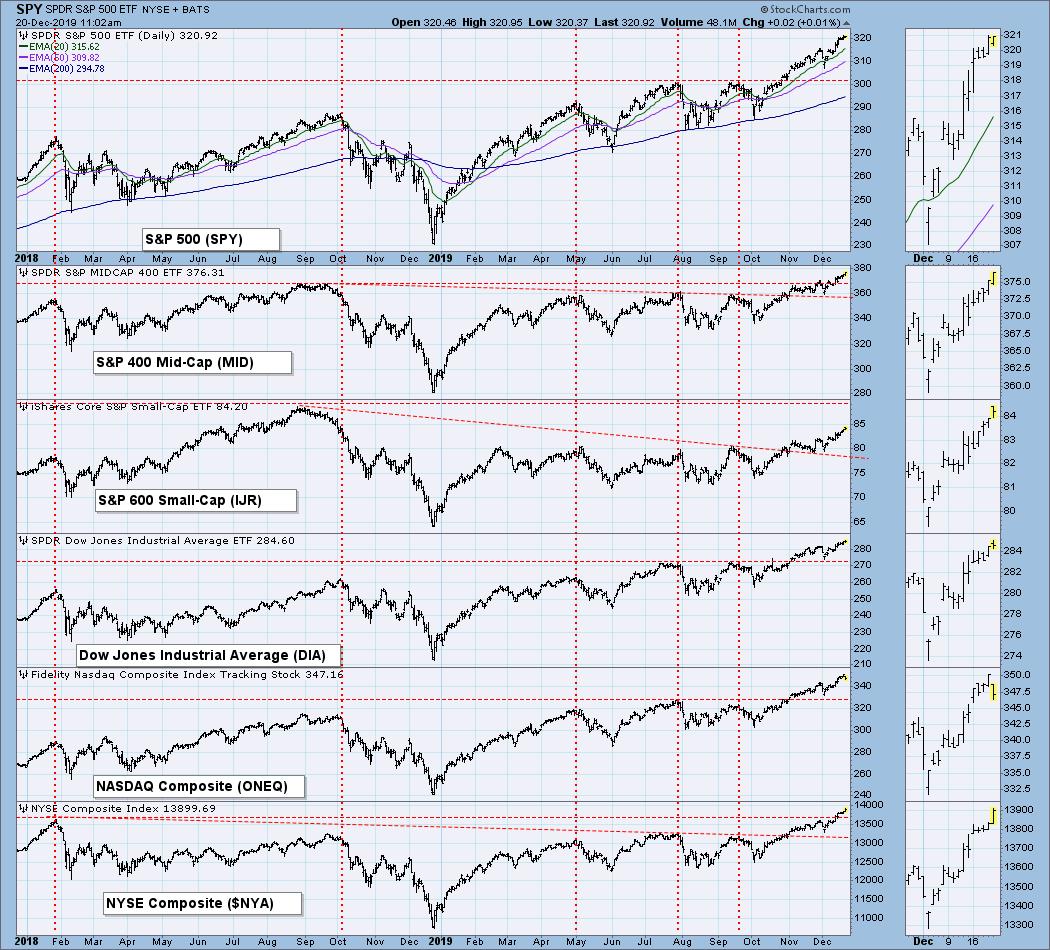
BROAD MARKET INDEXES
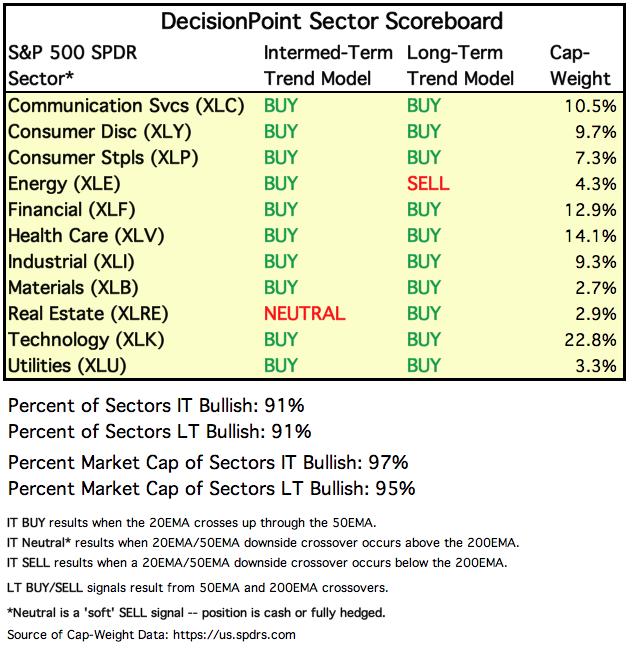
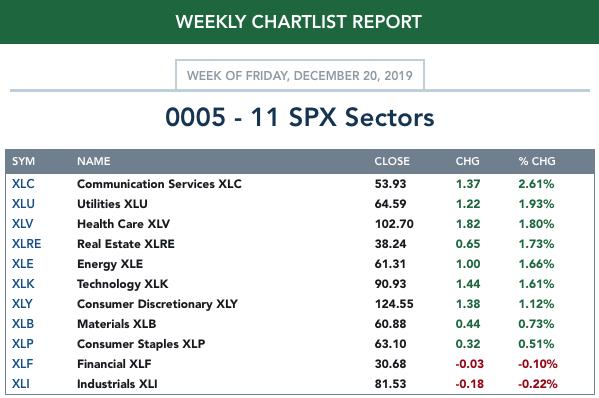
SECTORS
Each S&P 500 Index component stock is assigned to one, and only one, of 11 major sectors. This is a snapshot of the Intermediate-Term (Silver Cross) and Long-Term (Golden Cross) Trend Model signal status for those sectors.
A new feature at StockCharts.com is the capability to get daily and weekly reports on your chart lists.
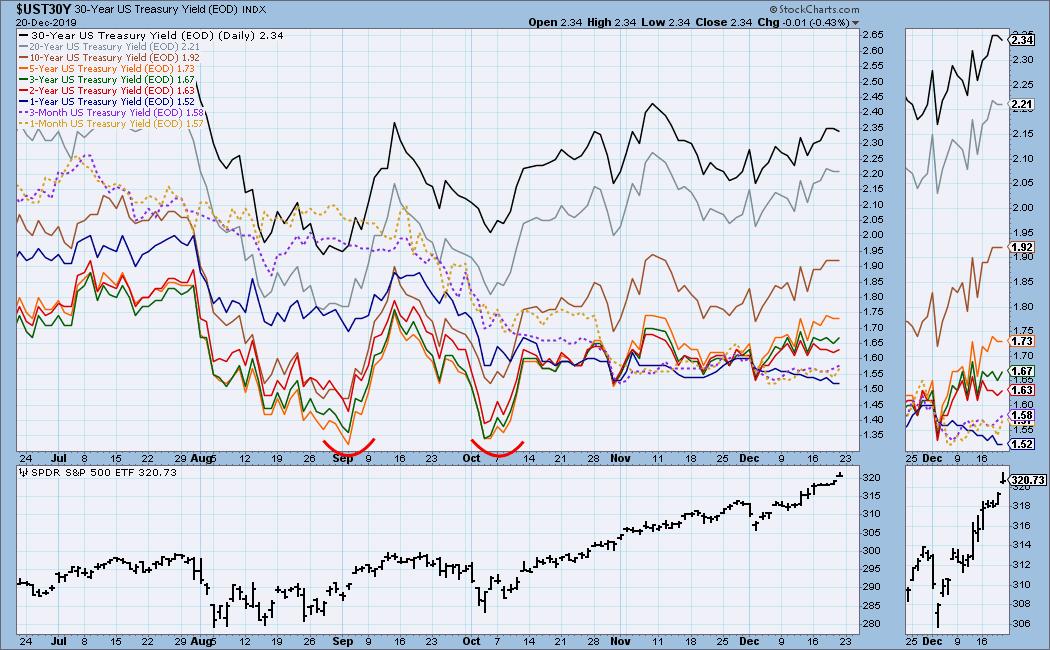
INTEREST RATES
This chart is included so we can monitor rate inversions. In normal circumstances the longer money is borrowed the higher the interest rate that must be paid. When rates are inverted, the reverse is true.
STOCKS
IT Trend Model: BUY as of 9/6/2019
LT Trend Model: BUY as of 2/26/2019
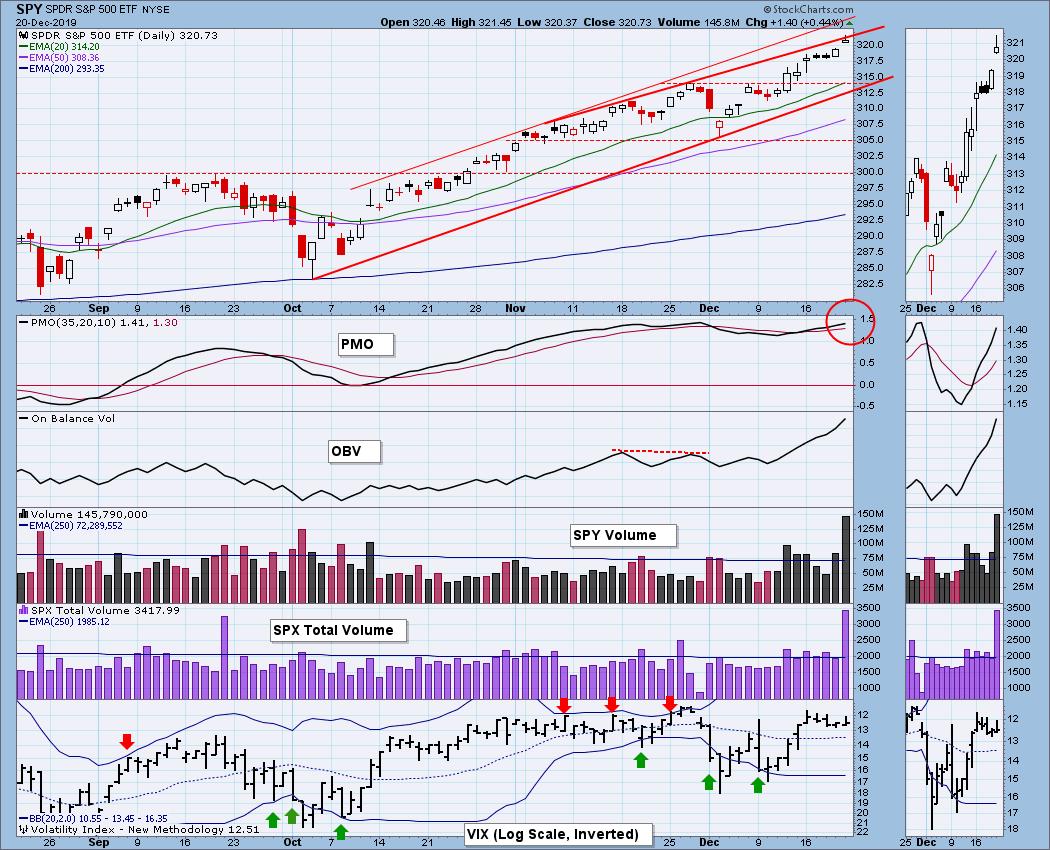
SPY Daily Chart: The significance of today's high SPX Total Volume is options expiration. Another anomaly is the high SPY volume. This is not normal for options expiration days, and could be the result of traders going flat for the holidays. We can see price reached the top of a rising wedge pattern, and, significantly, today's candle was a bearish shooting star.
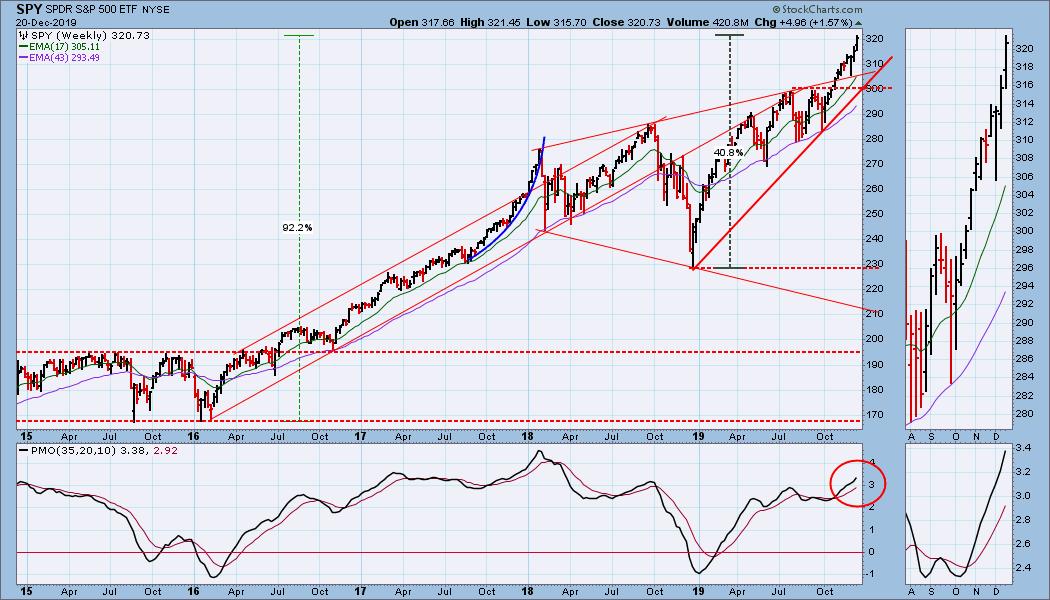
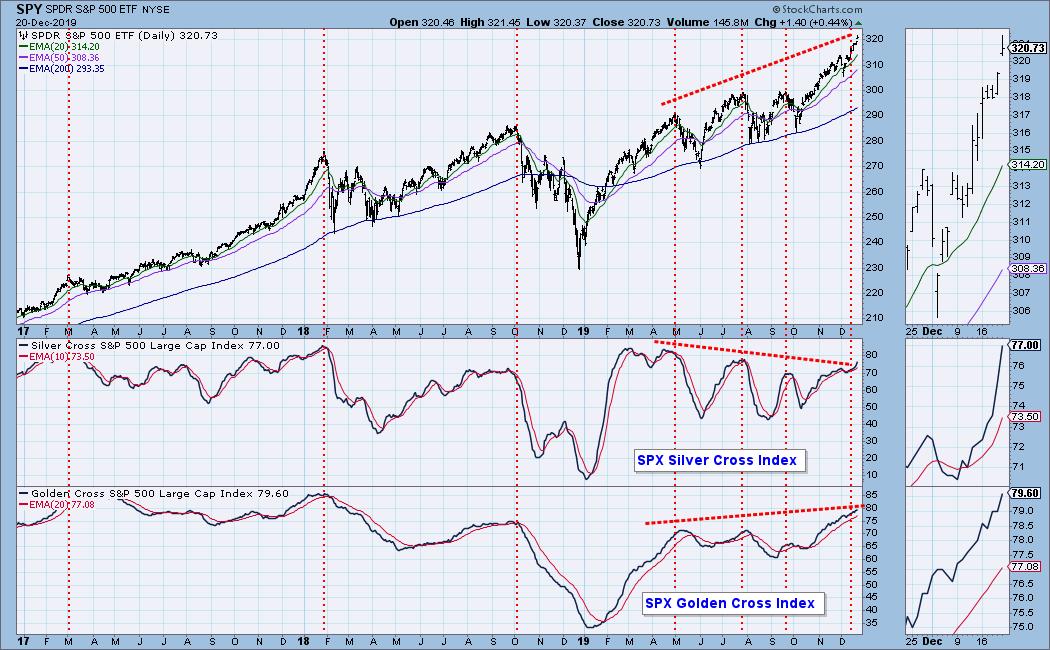
SPY Weekly Chart: This chart is bullish, but the rising trend line drawn from the 2018 low is really too steep. The weekly PMO is rising, but it is overbought.
Climactic Market Indicators: It was a climax day in nearly all respects, but that shooting star candle says it was an exhaustion climax.
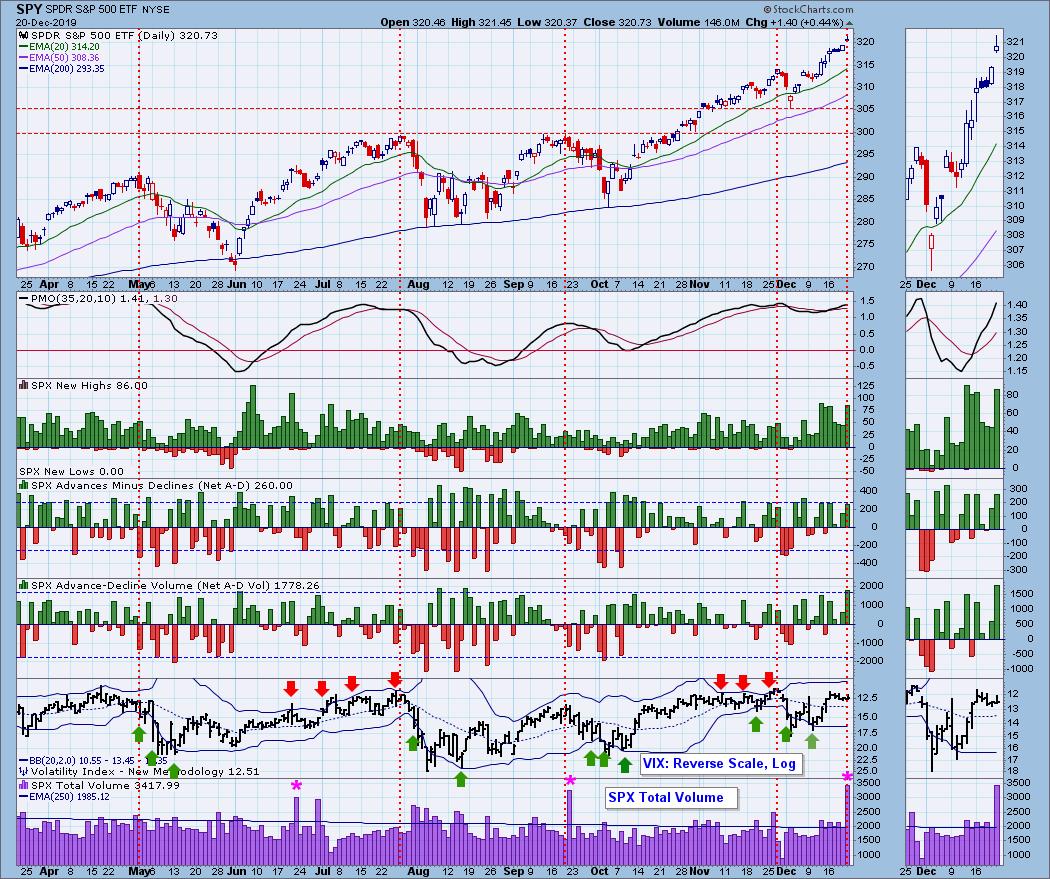
Short-Term Market Indicators: These indicators are somewhat weak, considering that the market is making record highs.
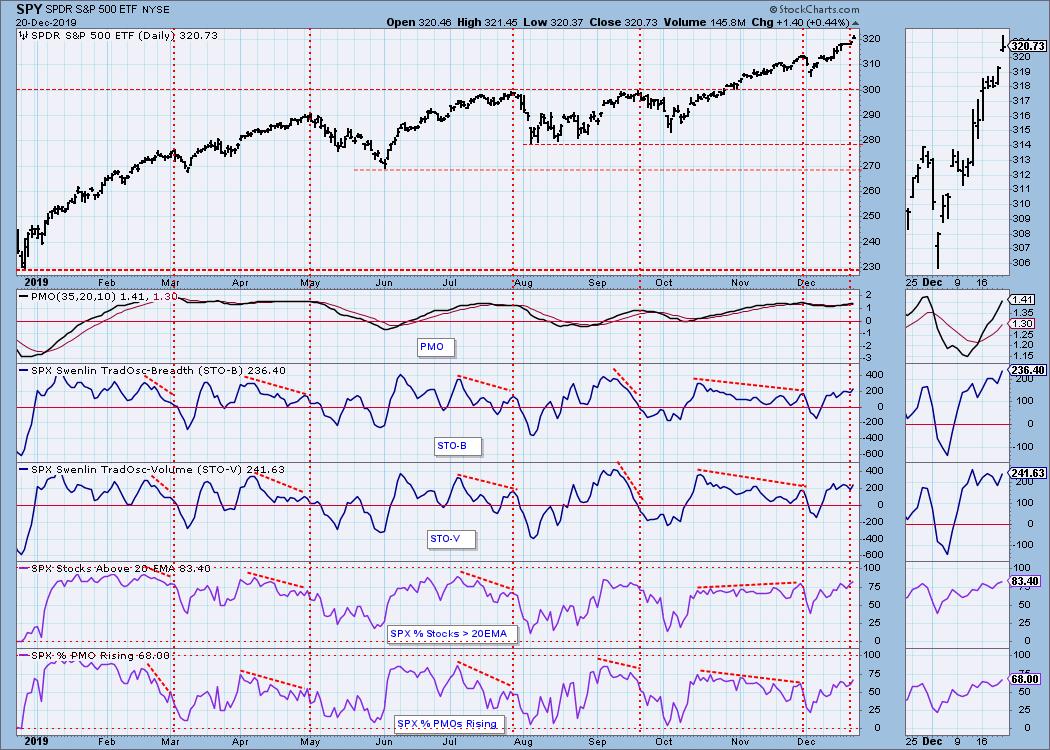
Intermediate-Term Market Indicators: As with the short-term indicators could be a bit stronger, but there is not a significant problem in that regard.
Again, these readings are less than robust. There is room to accommodate higher readings,
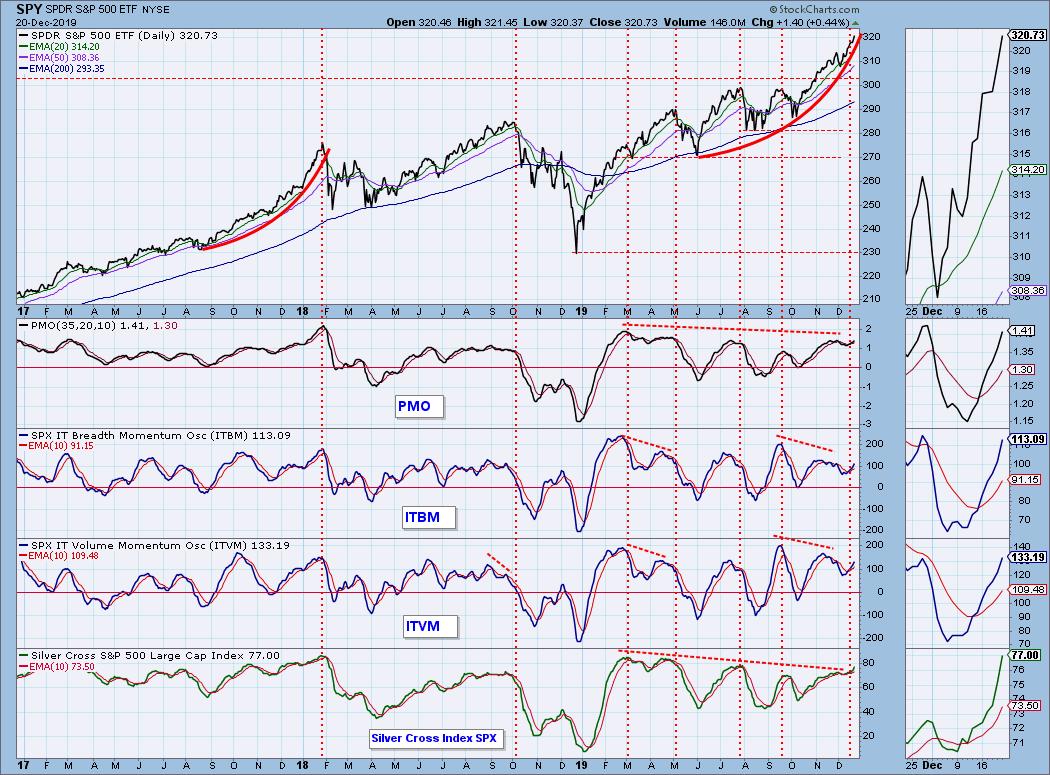
CONCLUSION: As I often do, I am relying on the chart immediately above to formulate an outlook. Recently, I noticed that the current rally is becoming parabolic, and is similar to the blowoff top in January 2018. None of the indicators are as overbought now as they were back then, but a few more weeks of rally could bring them to very overbought levels. I can't guarantee anything, but if this rally continues for a few more weeks (mid- to late-January?), I can almost guarantee we'll see an attention-getting correction. There is so much good news, so how can that happen? Well, vertical advances are usually doomed to collapse, and the extra-bullish sentiment is part of this setup. That doesn't mean the end of the world, but cooler heads will prevail, and the advance must be digested in some way.
The next two weeks have holidays on Wednesdays, and my original thought was that trading would be light with prices edging higher until January 6; however, the exhaustion climax, combined with weak short- and intermediate-term indicator readings makes me think we'll see a down move next week. Maybe it will be quick and dirty, or maybe it will be the beginning of something more damaging, but be alert.
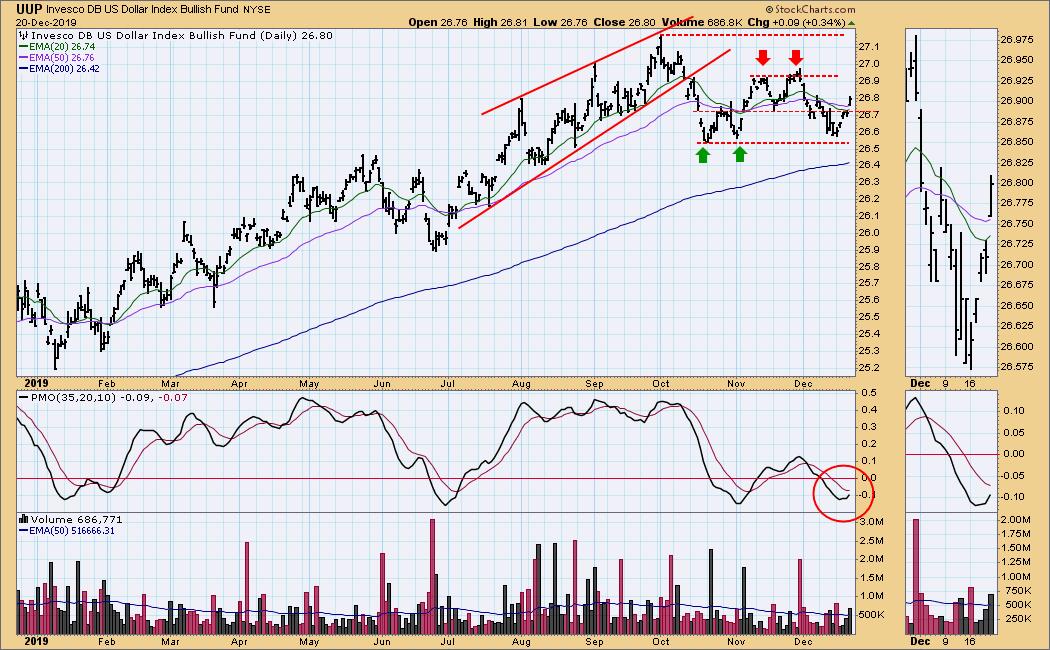
DOLLAR (UUP)
IT Trend Model: NEUTRAL as of 12/11/2019
LT Trend Model: BUY as of 5/25/2018
UUP Daily Chart: Price is in a trading range, and is pulling the 20EMA and 50EMA into whipsaw mode.
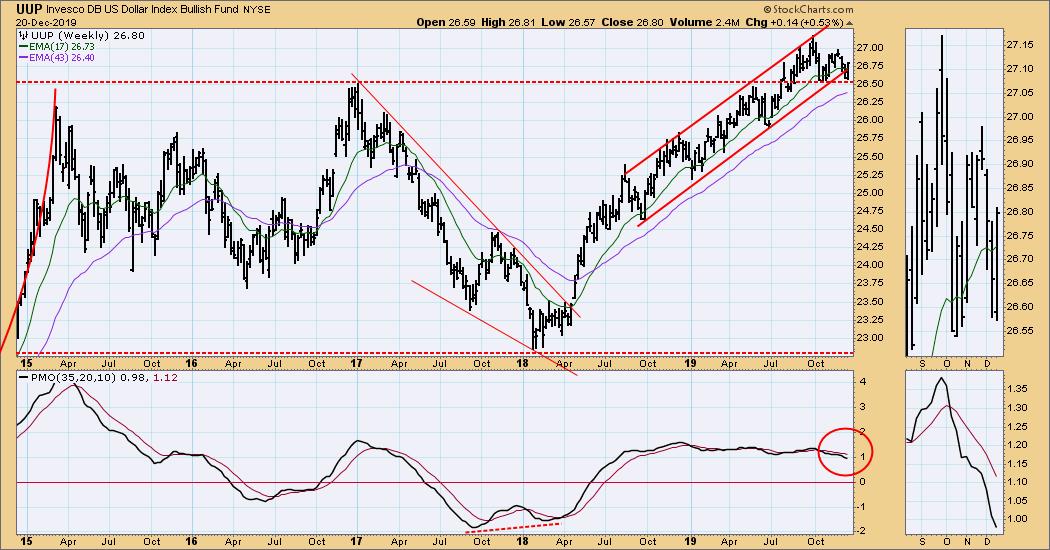
UUP Weekly Chart: The rising trend line has been broken, but the long-term horizontal support still holds.
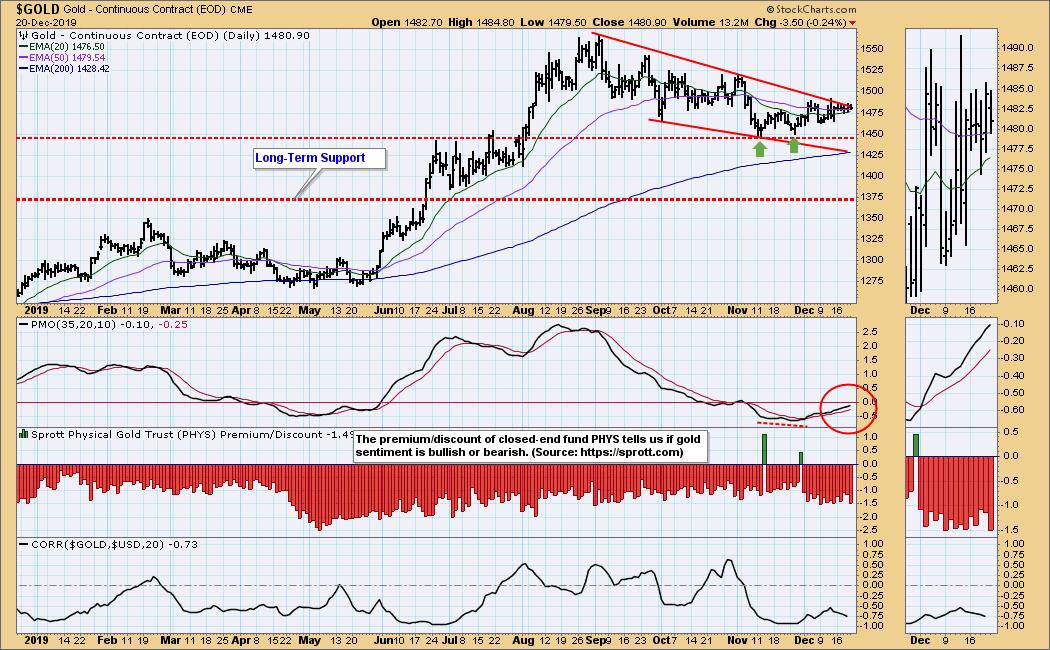
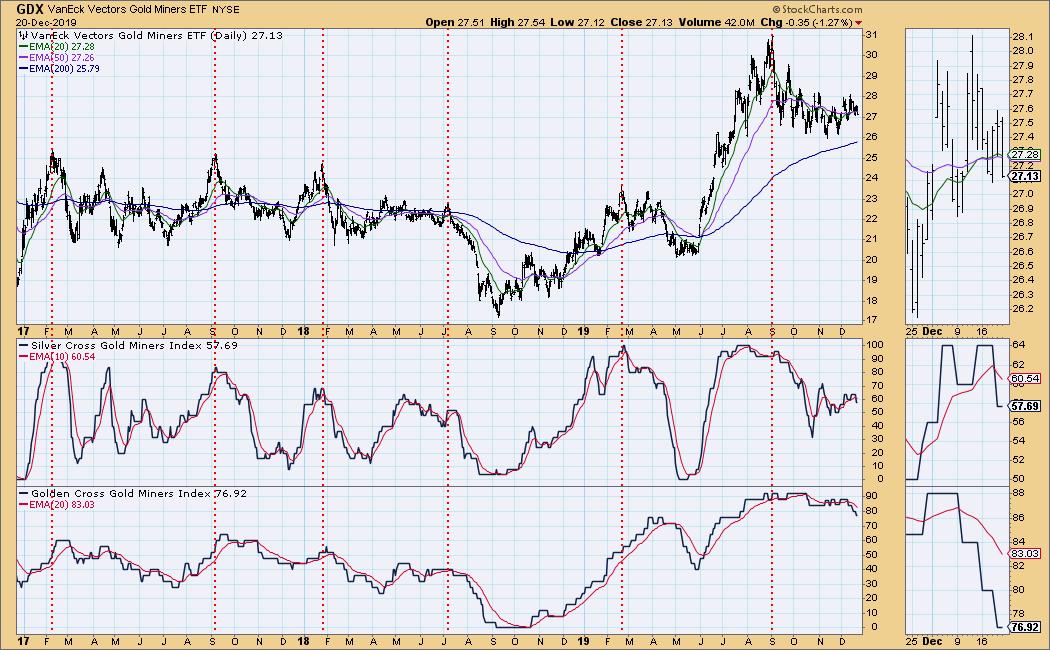
GOLD
IT Trend Model: NEUTRAL as of 11/8/2019
LT Trend Model: BUY as of 1/8/2019
GOLD Daily Chart: Gold is really pressing against the top of a falling wedge, the resolution of which is expected to be upside.
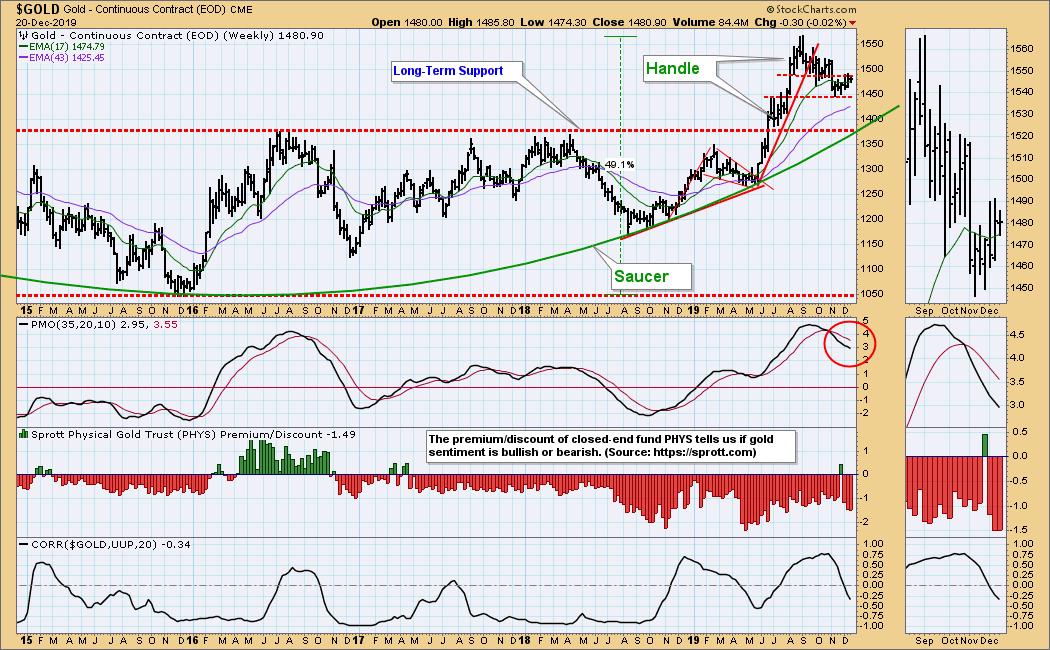
GOLD Weekly Chart: Gold is correcting the advance from earlier this year, and is moving down toward long-term support at 1375. The commercials are heavily short gold, so we must hope that short position is worked off before that support is violated.
GOLD MINERS Golden and Silver Cross Indexes: I notice that these indicators are much more volatile than other sectors. The price advance to the August top has moved the Golden Cross Index to very bullish levels. GDX is currently digesting that move.
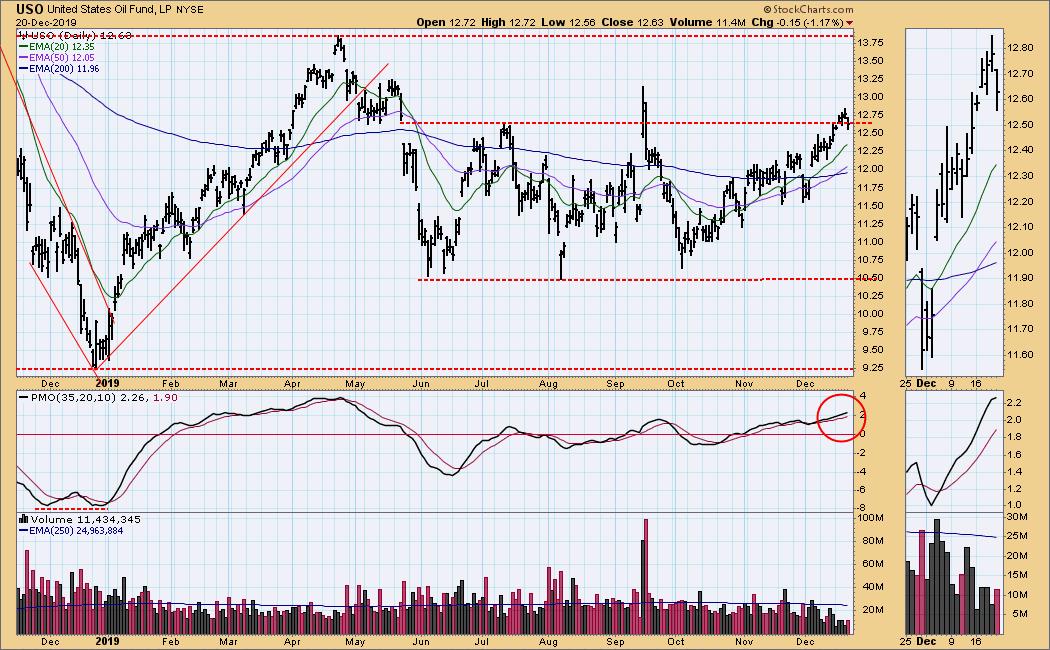
CRUDE OIL (USO)
IT Trend Model: BUY as of 11/6/2019
LT Trend Model: SELL as of 6/4/2019
USO Daily Chart: It appears that price is getting ready to move down to the bottom of the trading range -- about 10.50.
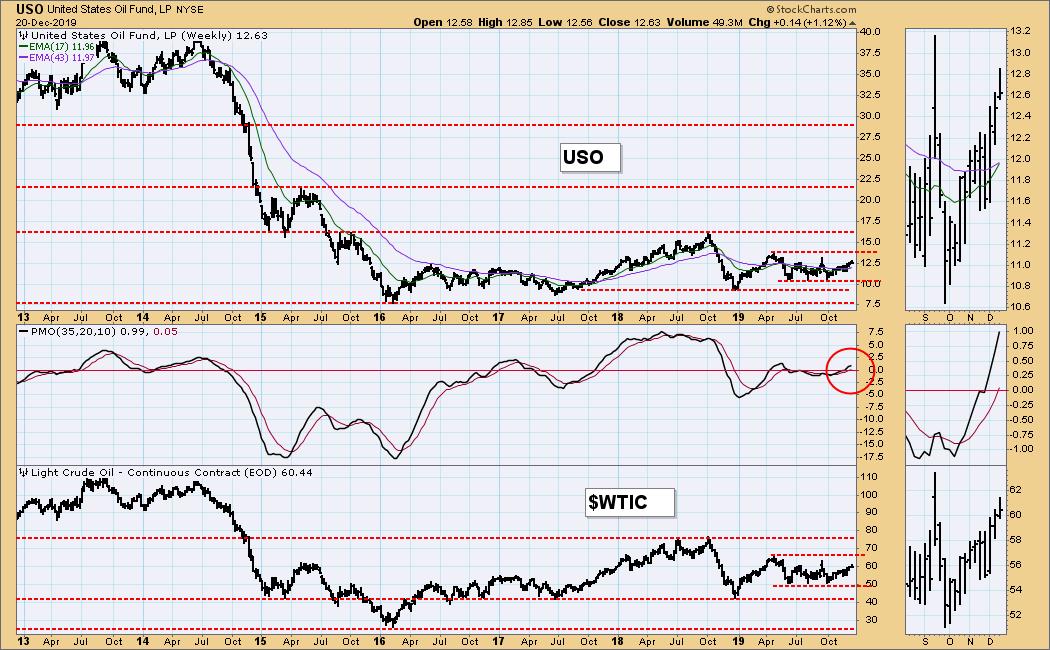
USO Weekly Chart: The most narrow WTIC range is 51 to 61, and the broader range is 42 to 67. My expectation is that the narrow range will prevail until some major news hits. I have no idea what that might be.
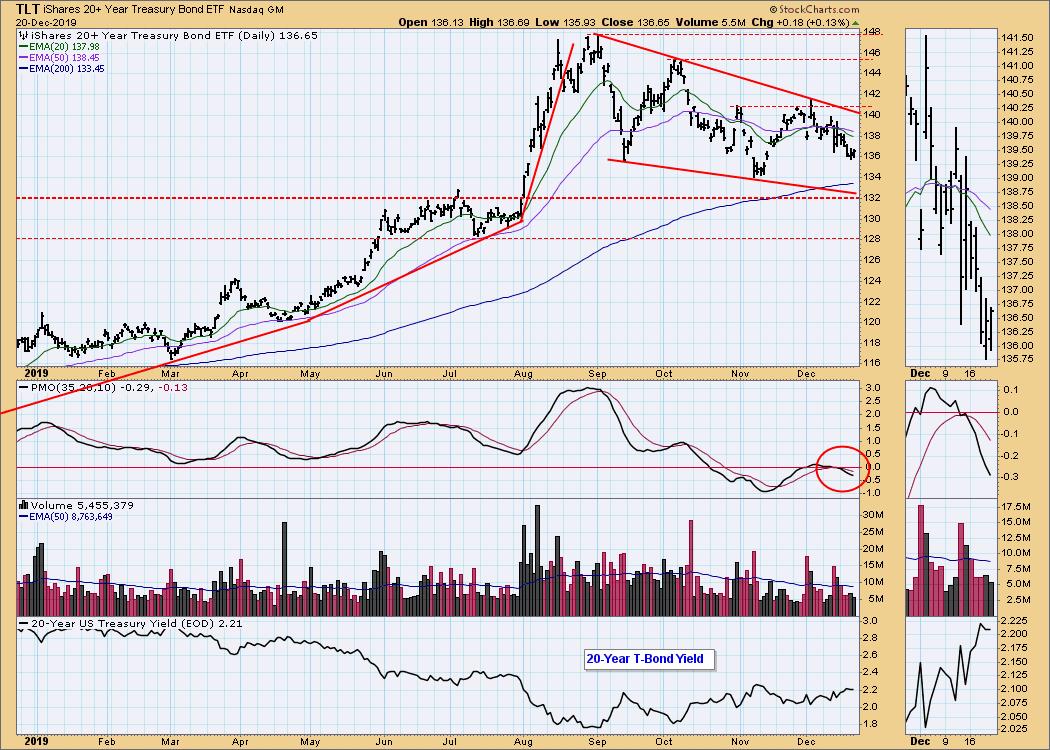
BONDS (TLT)
IT Trend Model: NEUTRAL as of 12/12/2019
LT Trend Model: BUY as of 1/2/2019
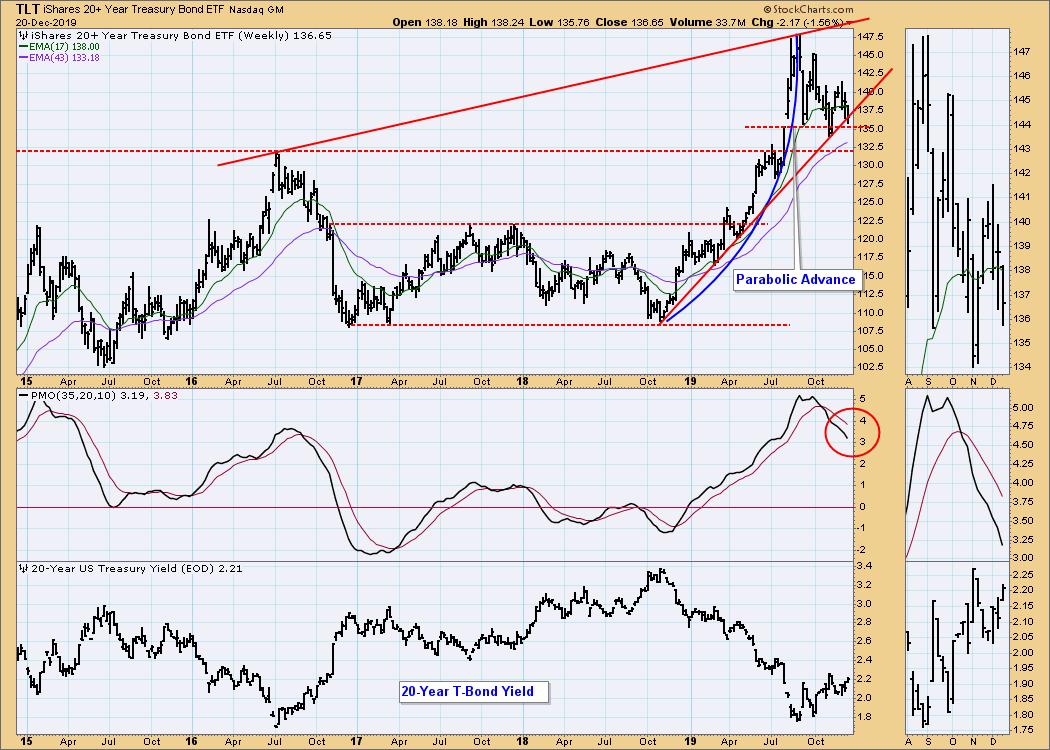
TLT Daily Chart: Until the Fed changes something, I think the maximum range is 128 to 148. There is a falling wedge, which should resolve upward.
TLT Weekly Chart: After a parabolic advance, TLT retreated to the rising trend line. If that line is violated, and it probably will be, I'll look for support at 135 to contain the decline.
**Don't miss any of the DecisionPoint commentaries! Go to the "Notify Me" box toward the end of this blog page to be notified as soon as they are published.**
Technical Analysis is a windsock, not a crystal ball.
Happy Charting! - Carl
NOTE: The signal status reported herein is based upon mechanical trading model signals, specifically, the DecisionPoint Trend Model. They define the implied bias of the price index based upon moving average relationships, but they do not necessarily call for a specific action. They are information flags that should prompt chart review. Further, they do not call for continuous buying or selling during the life of the signal. For example, a BUY signal will probably (but not necessarily) return the best results if action is taken soon after the signal is generated. Additional opportunities for buying may be found as price zigzags higher, but the trader must look for optimum entry points. Conversely, exit points to preserve gains (or minimize losses) may be evident before the model mechanically closes the signal.
Helpful DecisionPoint Links:
DecisionPoint Shared ChartList and DecisionPoint Chart Gallery
Price Momentum Oscillator (PMO)
Swenlin Trading Oscillators (STO-B and STO-V)


