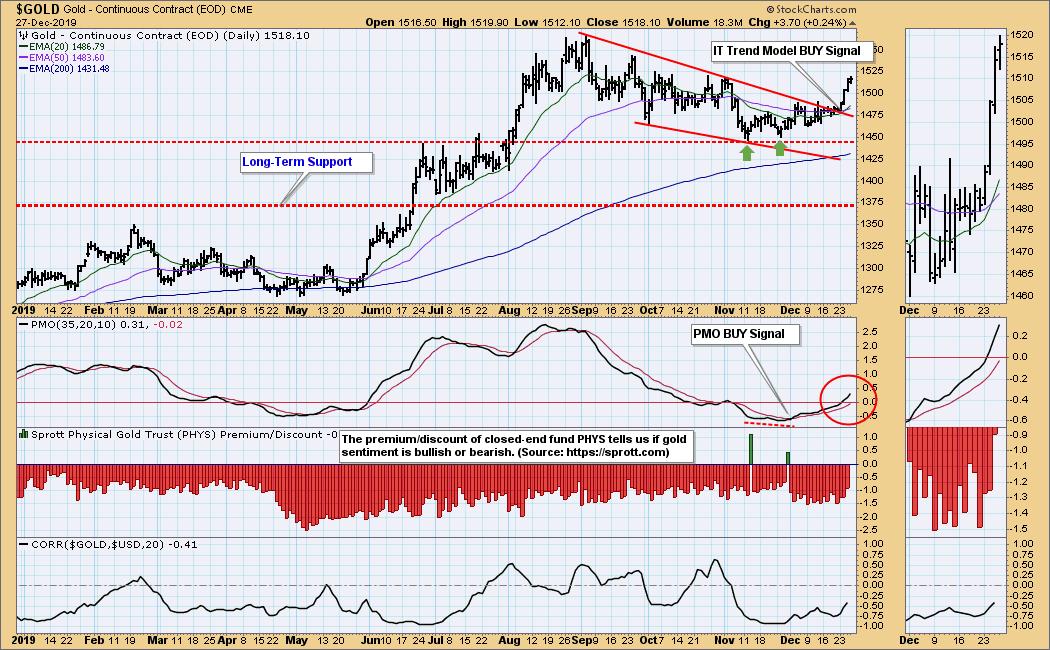
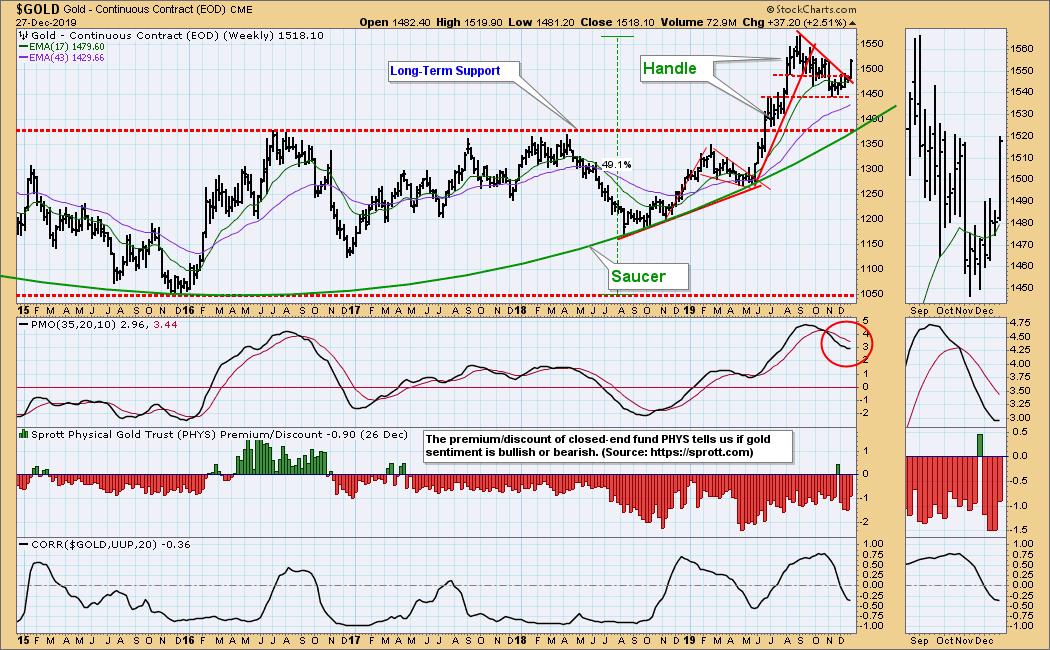
On Thursday the gold 20EMA crossed up through the 50EMA, generating an IT Trend Model BUY signal. Notice also, that we had other indications alerting us that gold's price action was about to turn positive. There was a double bottom, followed immediately by the PMO crossing up through the signal line. And before that, there were two green spikes showing closed-end fund PHYS was briefly trading at a premium, which means that sentiment on those days had turned positive. We'll take a deeper dive into gold's prospects below.
The DecisionPoint Weekly Wrap presents an end-of-week assessment of the trend and condition of the stock market (S&P 500), the U.S. Dollar, Gold, Crude Oil, and Bonds.
Watch the latest episode of DecisionPoint on StockCharts TV's YouTube channel here!
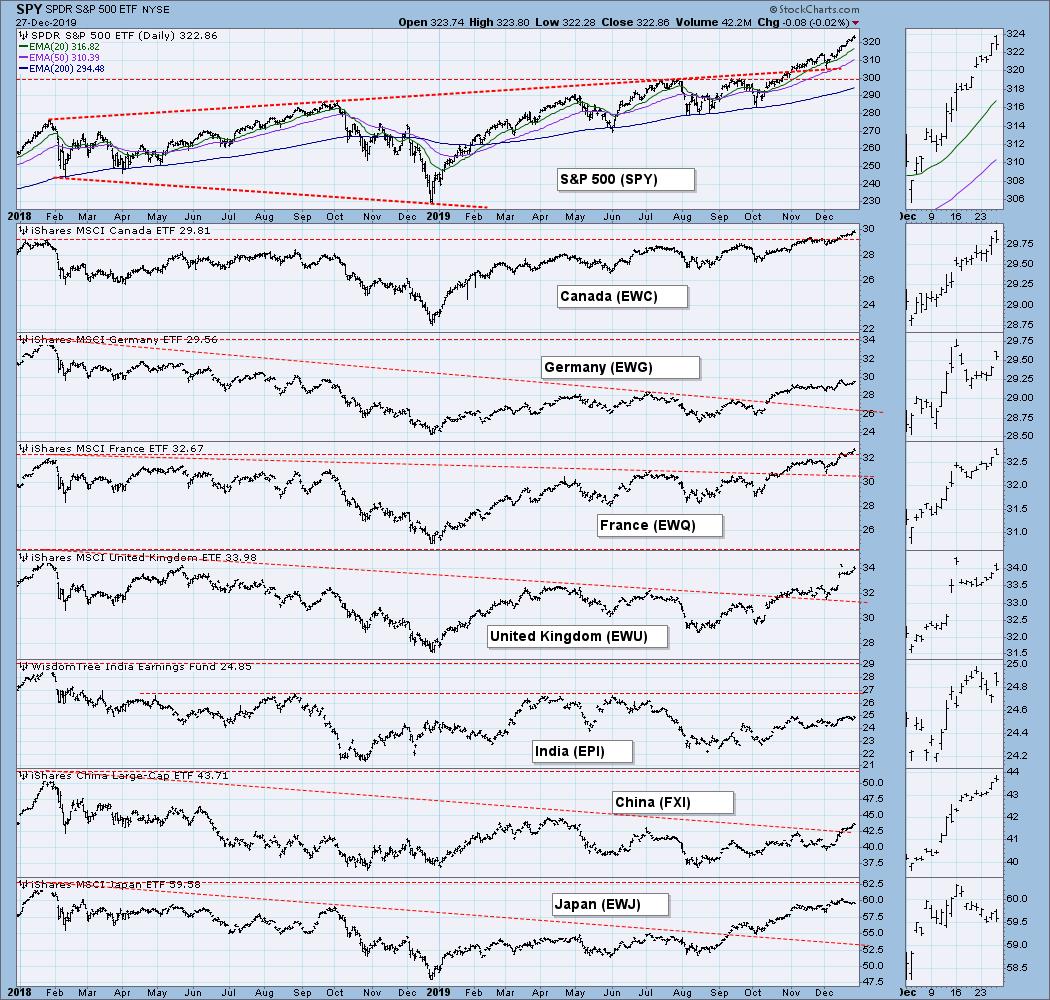
GLOBAL MARKETS
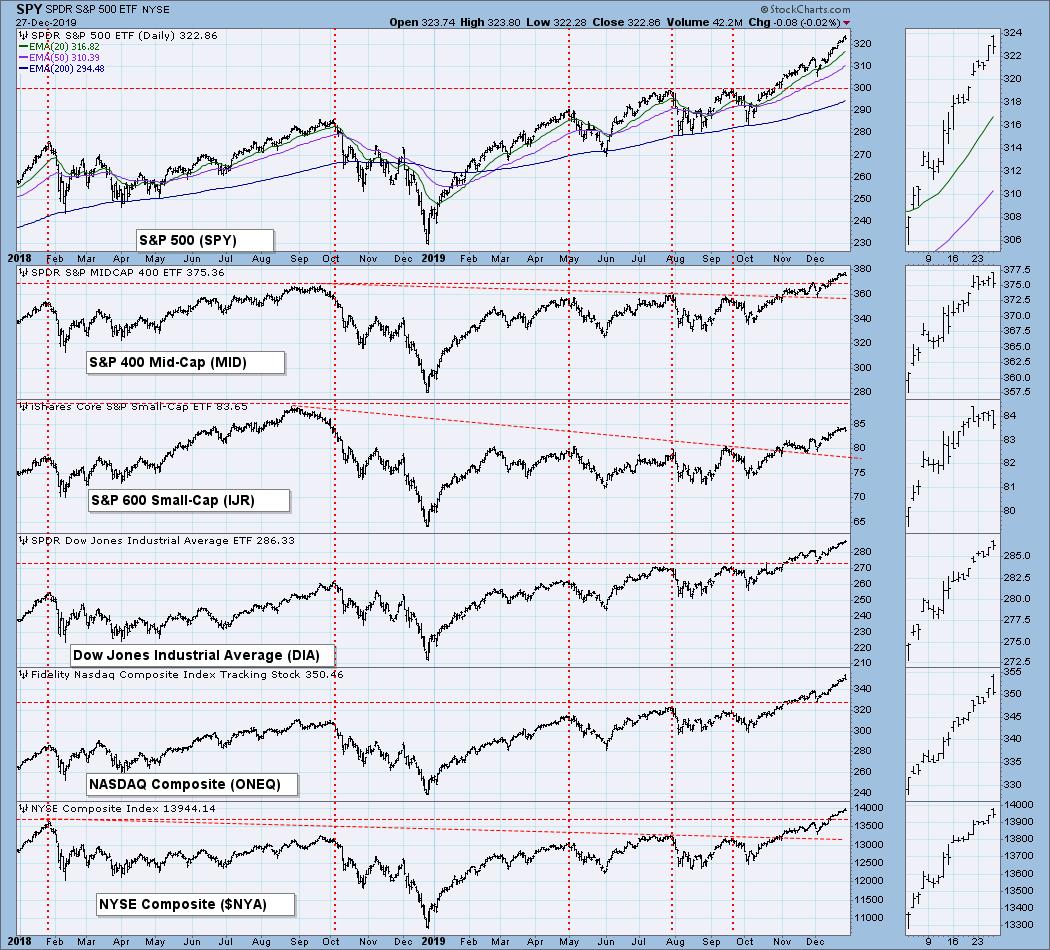
BROAD MARKET INDEXES
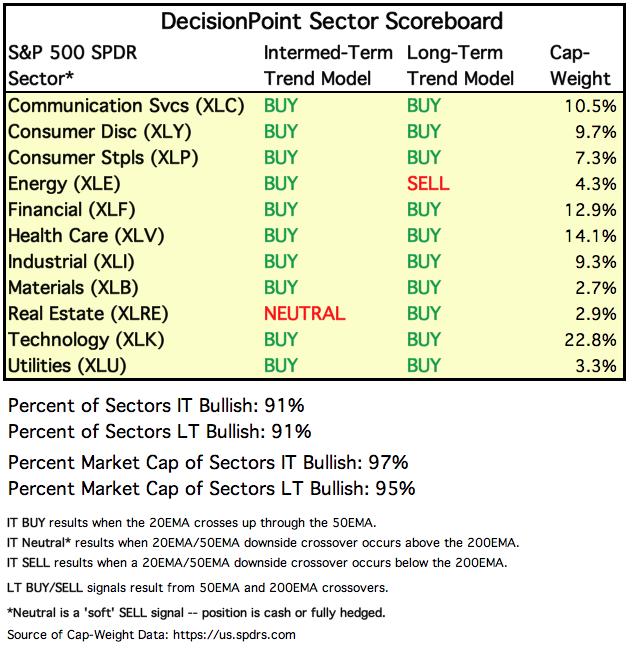
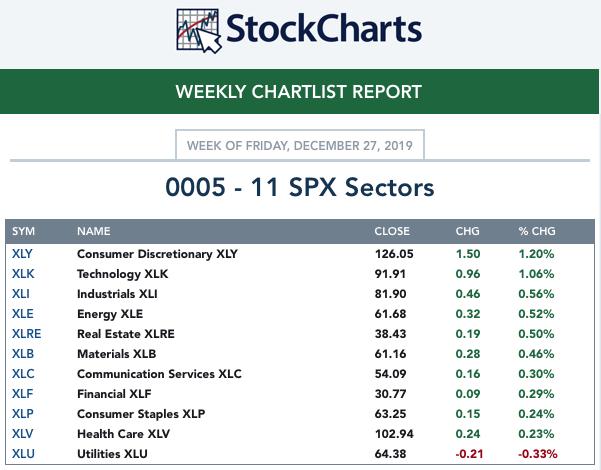
SECTORS
Each S&P 500 Index component stock is assigned to one, and only one, of 11 major sectors. This is a snapshot of the Intermediate-Term (Silver Cross) and Long-Term (Golden Cross) Trend Model signal status for those sectors.
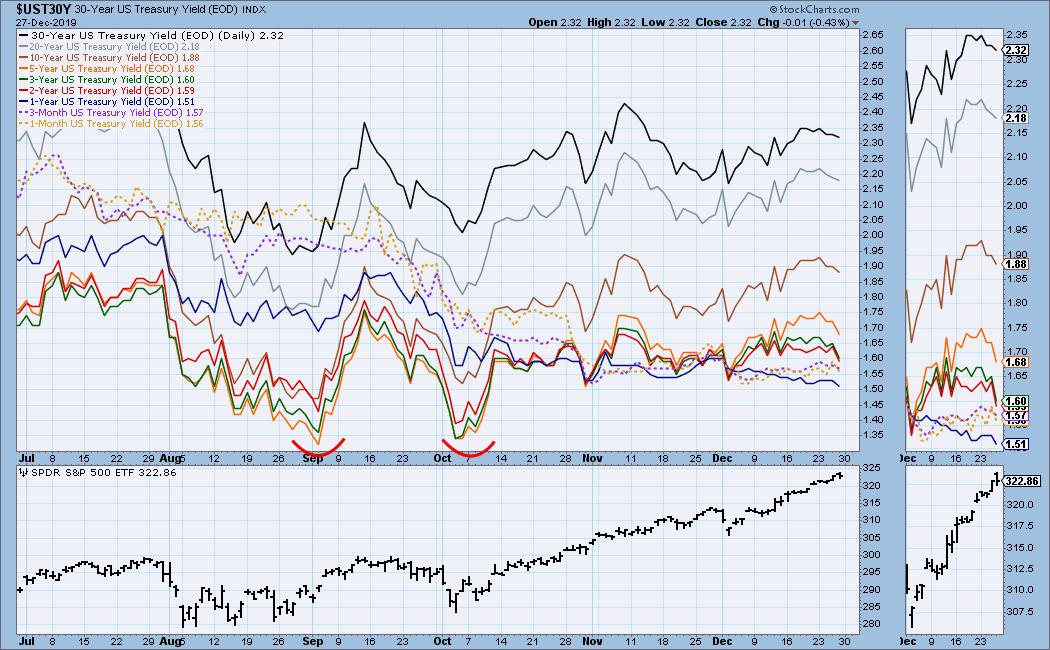
INTEREST RATES
This chart is included so we can monitor rate inversions. In normal circumstances the longer money is borrowed the higher the interest rate that must be paid. When rates are inverted, the reverse is true.
STOCKS
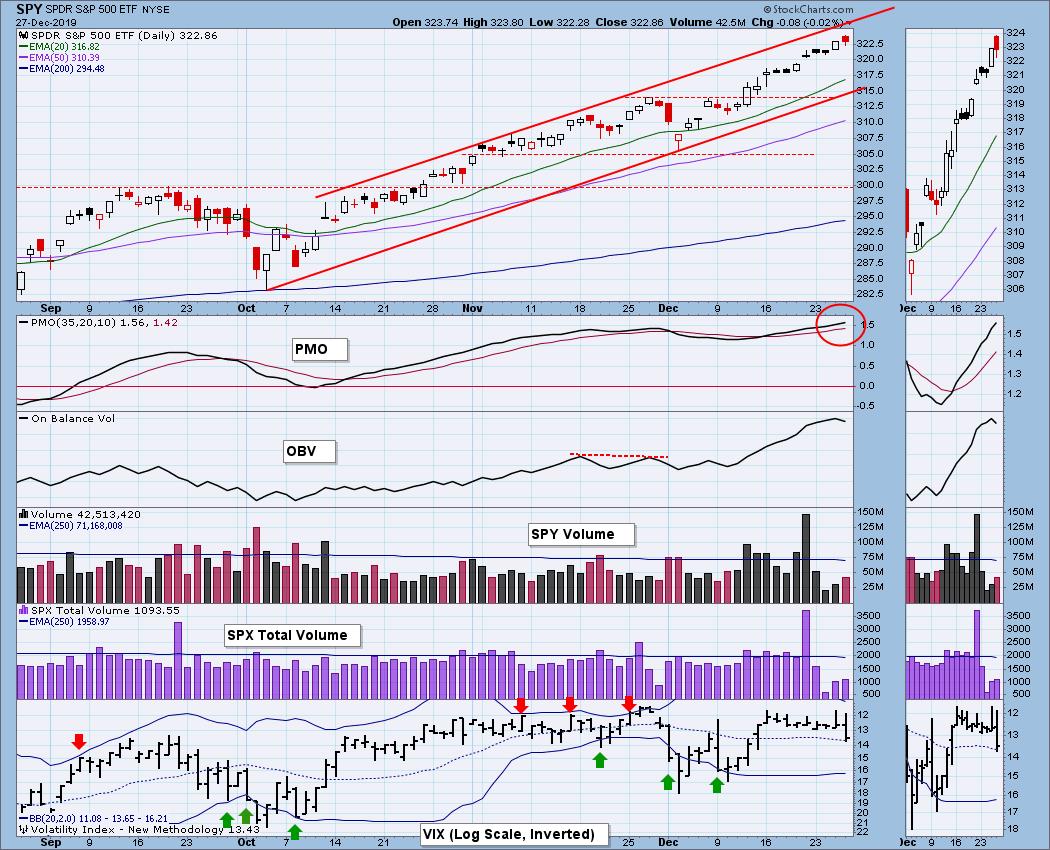
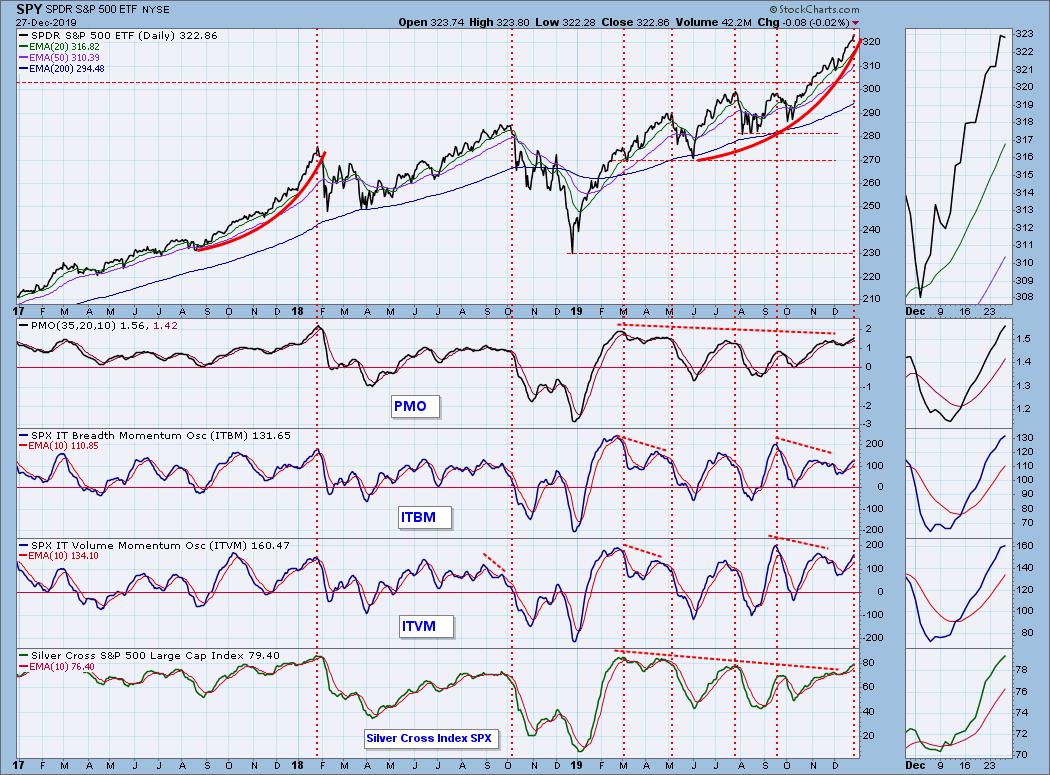
IT Trend Model: BUY as of 9/6/2019
LT Trend Model: BUY as of 2/26/2019
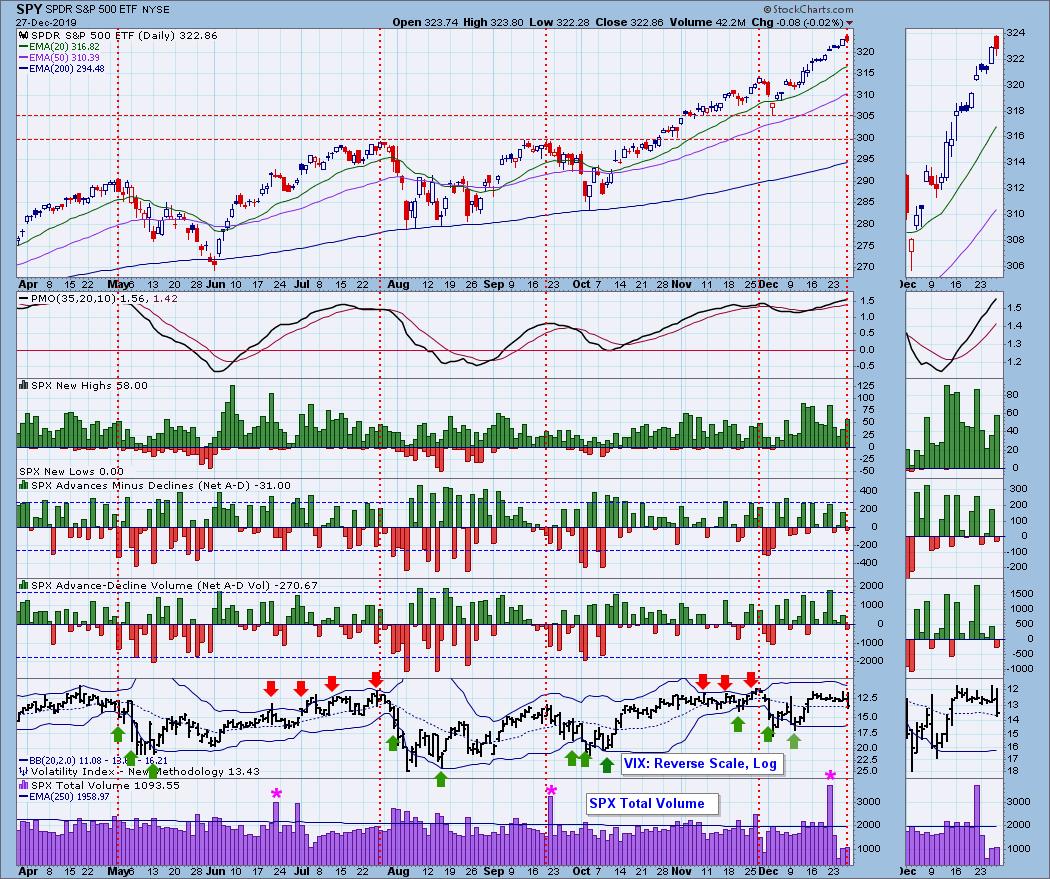
SPY Daily Chart: SPY is reaching the top of a rising trend channel, which could interfere with the rally next week. Volume was unusually low due to holiday trading. We'll probably see the same next week.
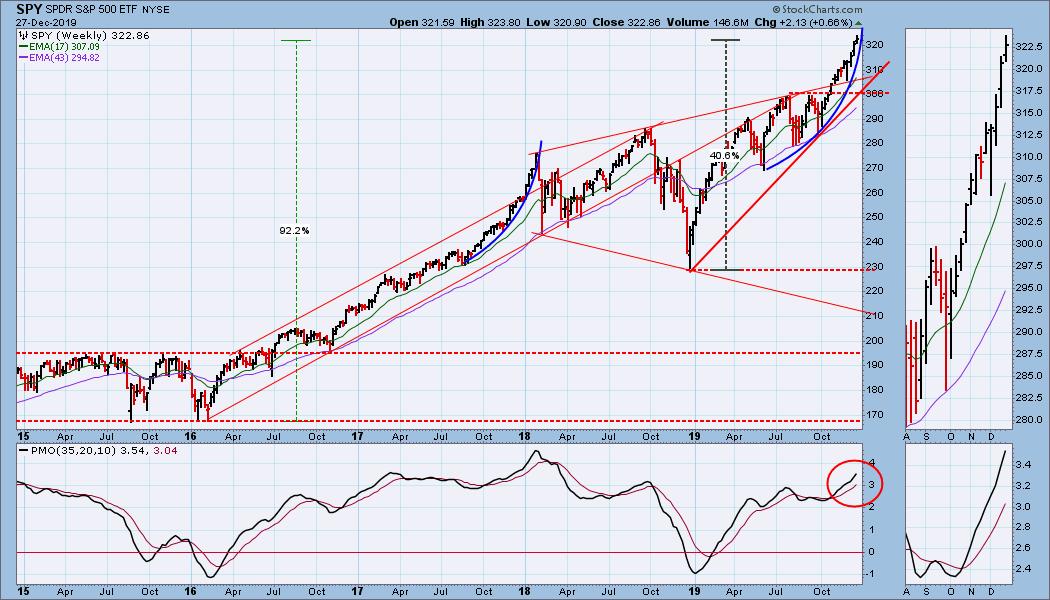
SPY Weekly Chart: The weekly PMO has reached the most overbought level since early-2018.
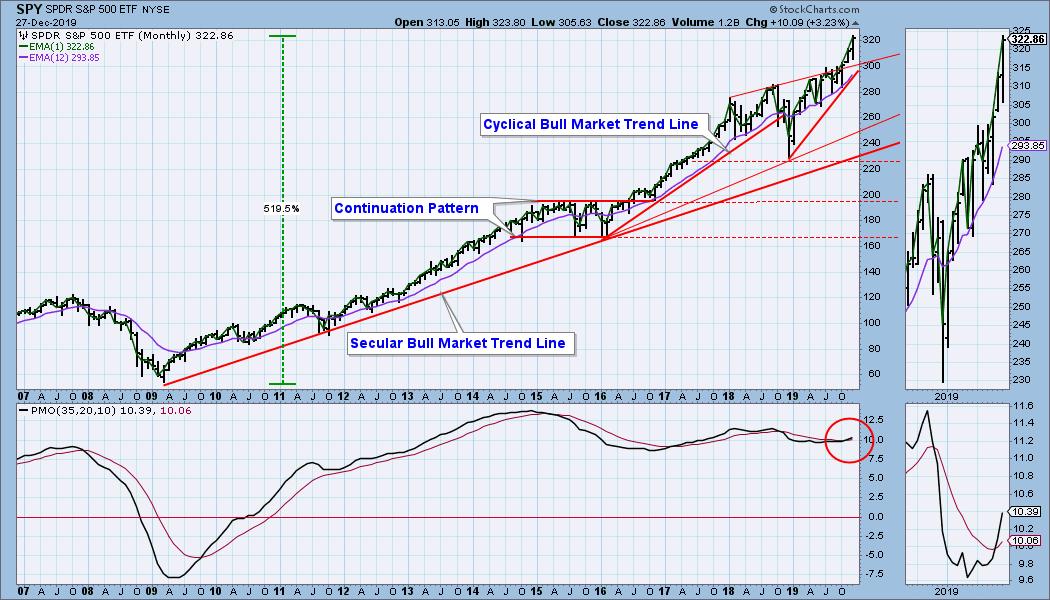
SPY Monthly Chart: There are still two trading days left in December, and the monthly charts won't be final until then, but I think now is a good time to review that time frame. For SPY the monthly PMO is overbought, but it has been overbought for about eight years. The PMO and price are rising, so this chart is bullish.
Climactic Market Indicators: There were no climax readings this week.
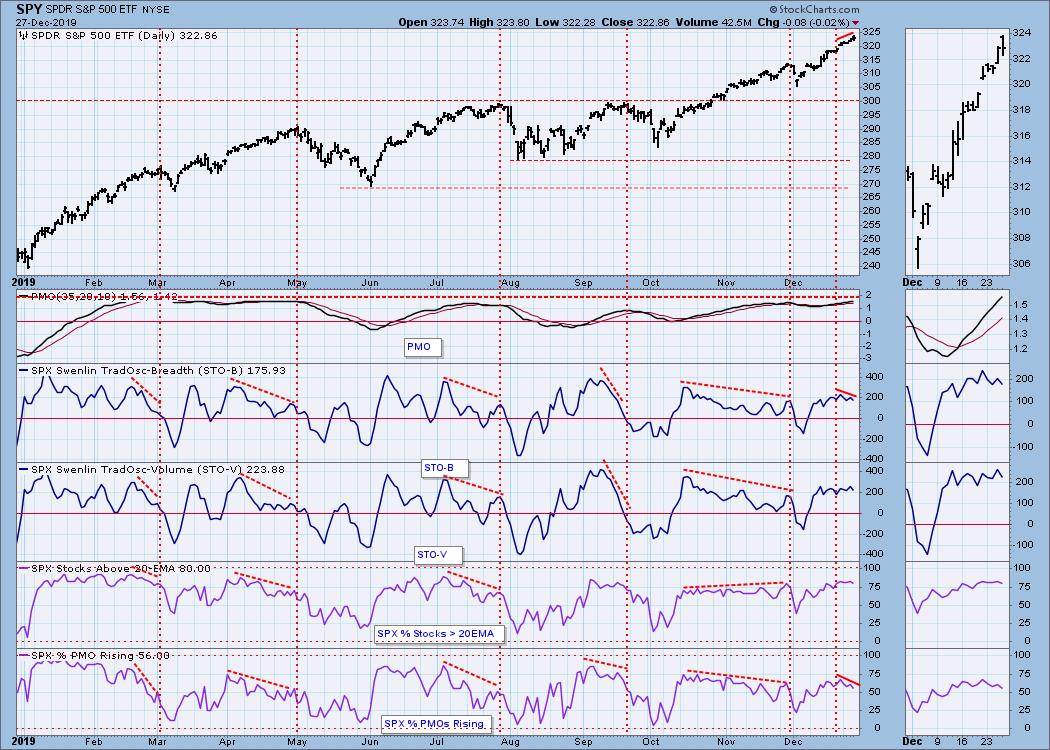
Short-Term Market Indicators: The STO-B and Percent PMOs Rising are falling in the short-term, diverging negatively from price.
Intermediate-Term Market Indicators: Surprisingly, the Golden Cross Index is higher than the Silver Cross Index. In any case, they both confirm the rising price trend.
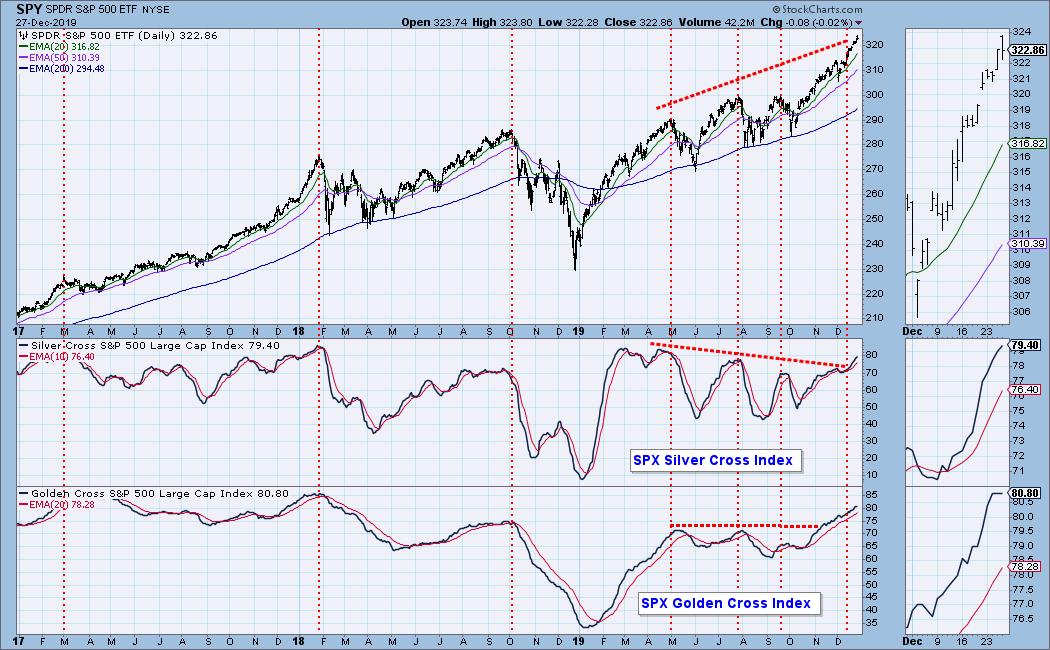
All these indicators are in overbought territory.
CONCLUSION: The trend of the market is up, and the condition is overbought. Last week, for various tantalizing reasons, I thought we might get a down move this week. Didn't happen. The more tantalizing of last weeks reasons for being bearish are no longer present, so next week I'll be looking for continued light trading with prices edging higher until January 6. The current advance is still parabolic. Should it persist, I think it will break down sometime next month.
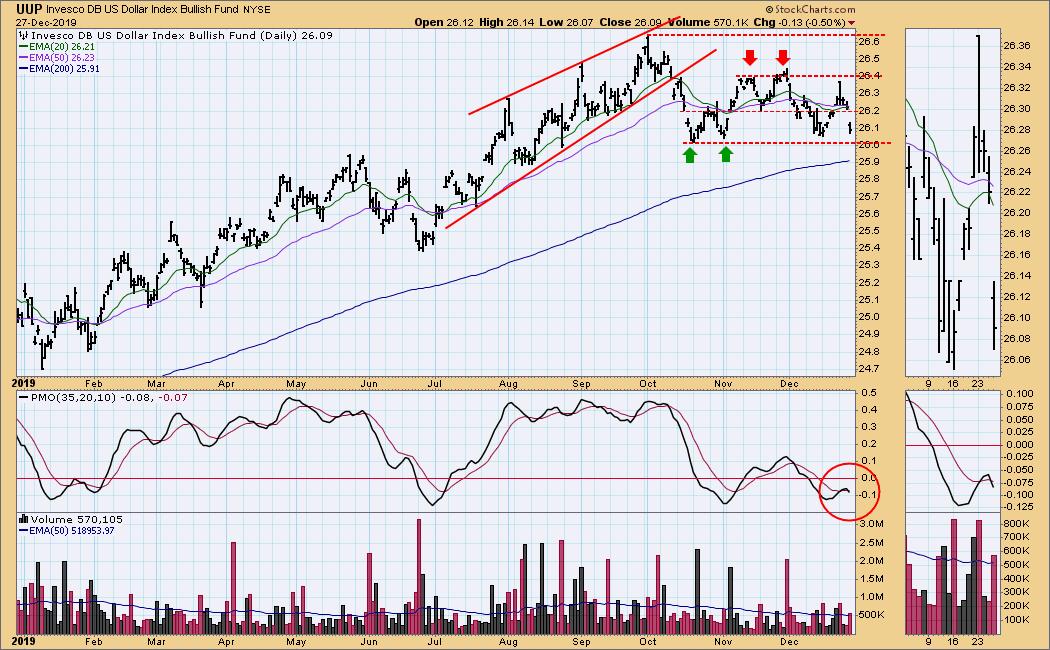
DOLLAR (UUP)
IT Trend Model: NEUTRAL as of 12/11/2019
LT Trend Model: BUY as of 5/25/2018
UUP Daily Chart: The daily PMO has turned down, and I think UUP is in trouble.
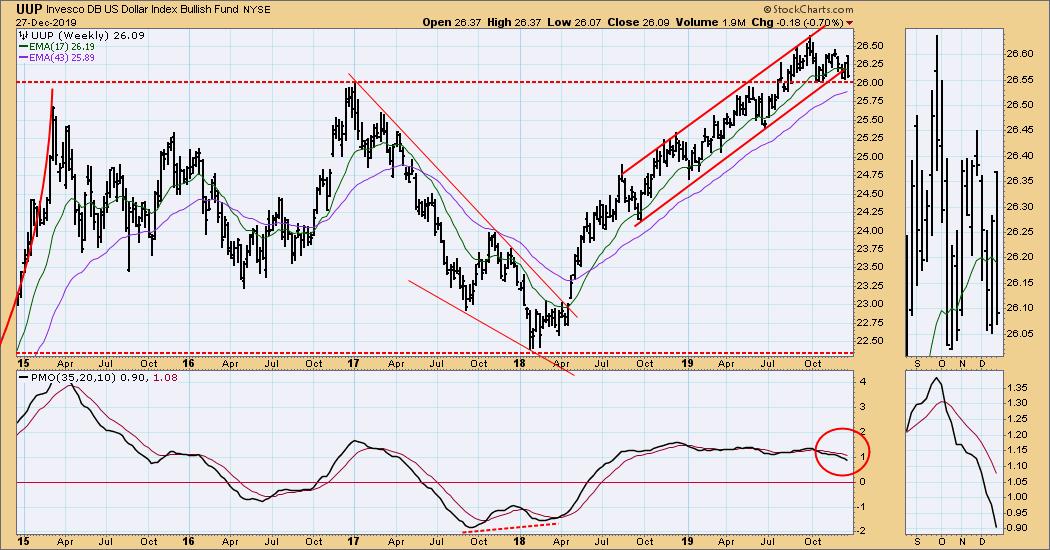
UUP Weekly Chart: The rising trend line has been broken, but important horizontal support still holds.
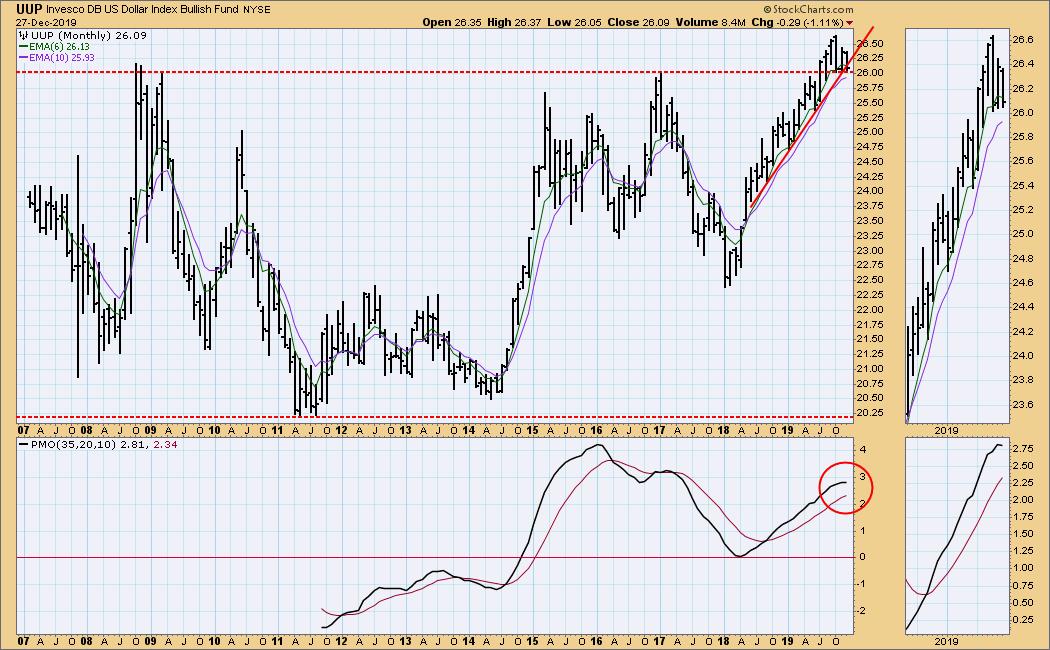
UUP Monthly Chart: The monthly PMO has turned down, and that is bearish for the dollar. Be sure to verity PMO direction as of the end of the month.
GOLD
IT Trend Model: BUY as of 12/26/2019
LT Trend Model: BUY as of 1/8/2019
GOLD Daily Chart: As I said earlier, there was a strong breakout this week, and what we can see here is very bullish; however, Tom McClellan has a chart showing that the COT (commitment of traders) for the Commercials (smart money) is heavily net short, which implies that more selling will be needed to clear those shorts. That is probably the correct point of view, but it is not out of the question that the rally could be accelerated by short covering.

GOLD Weekly Chart: This chart says that the process of forming the handle (on the saucer) may be completed.
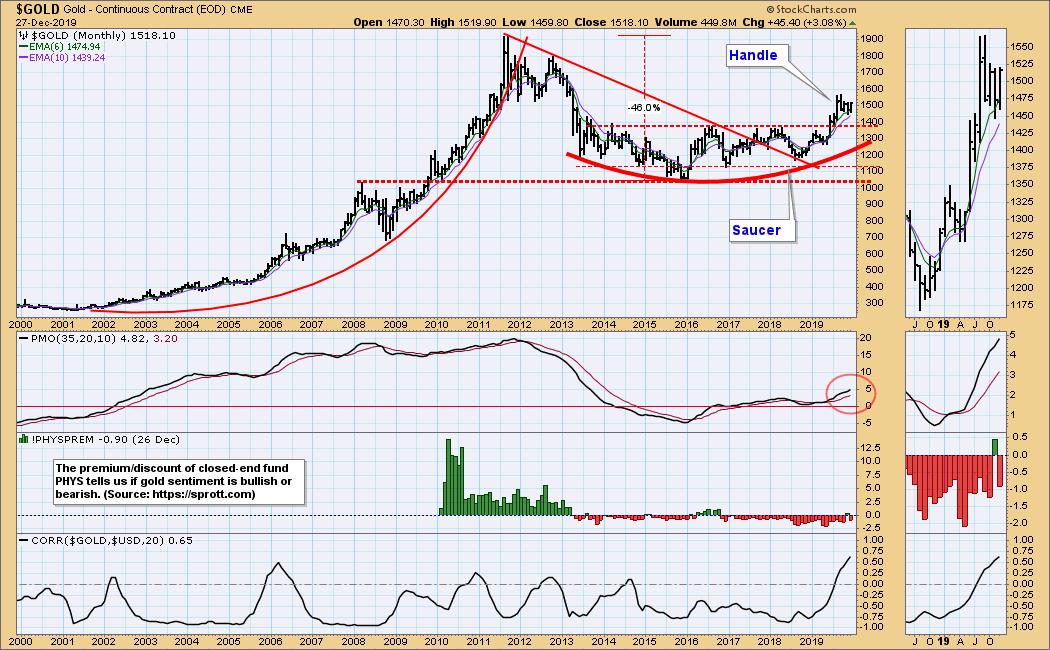
GOLD Monthly Chart: The breakout clearly seen on the daily and weekly charts is not yet evident in this time frame, but saucer with handle formation on this chart is very bullish.
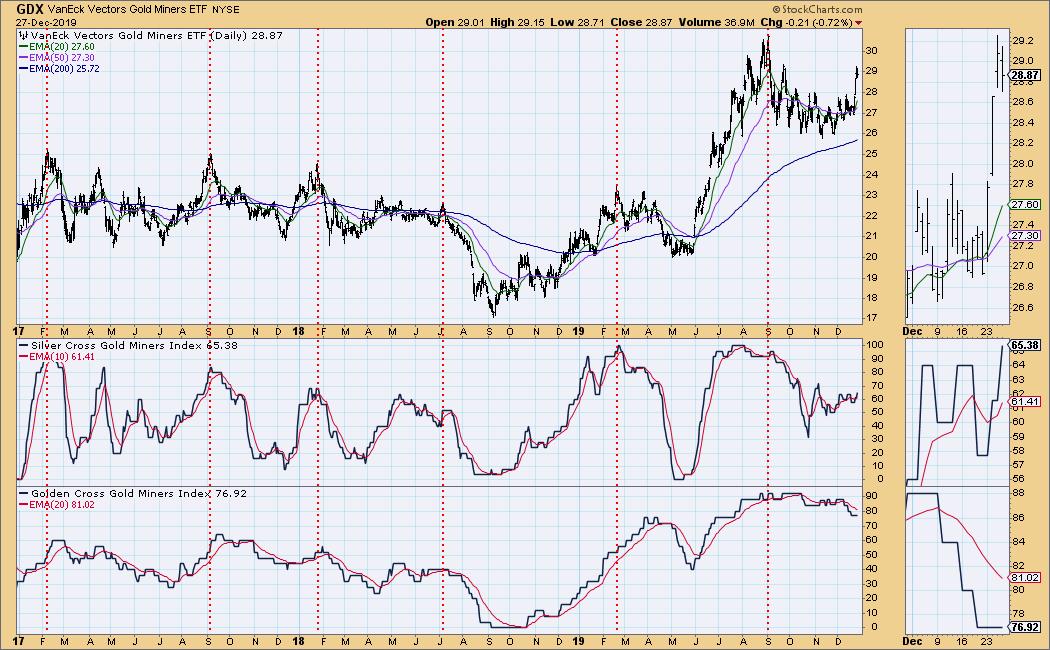
GOLD MINERS Golden and Silver Cross Indexes: These indexes are quite volatile, and they should show improvement quickly in light of this week's GDX rally.
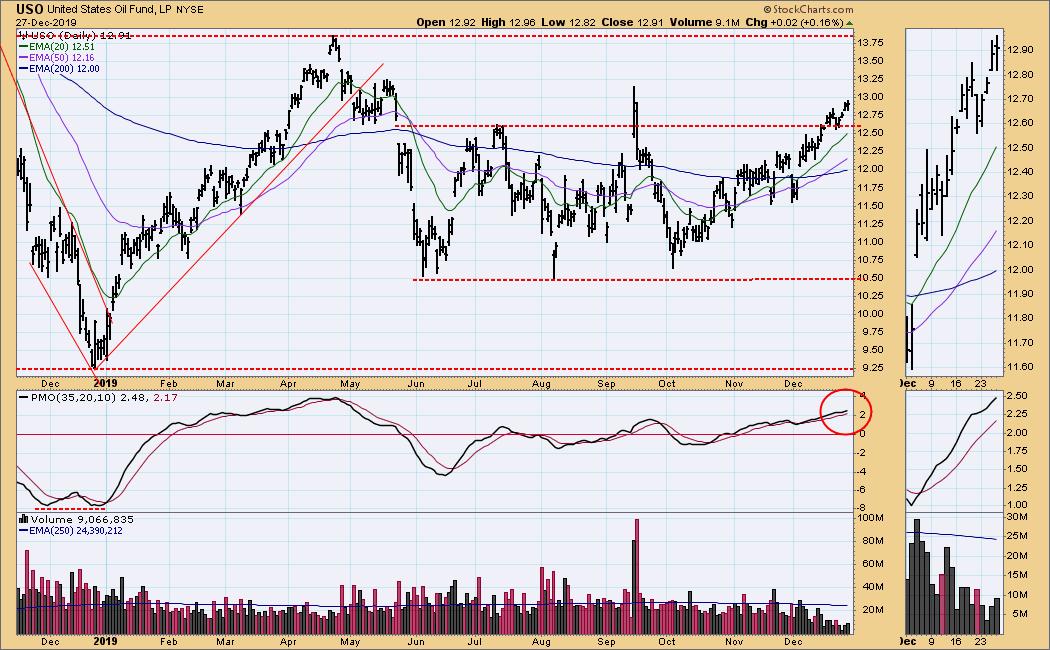
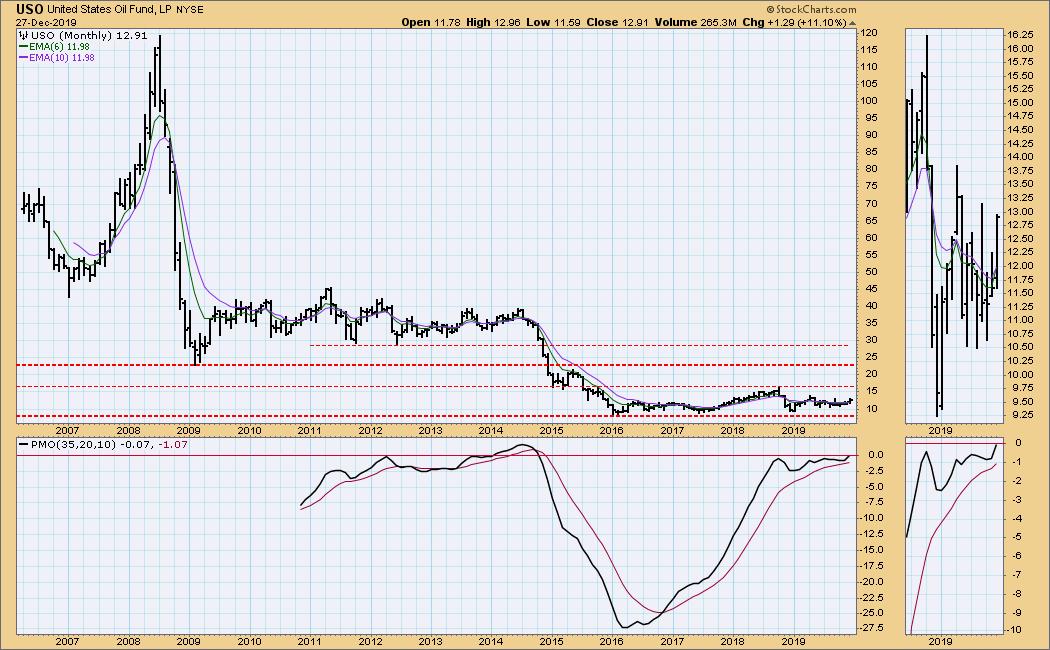
CRUDE OIL (USO)
IT Trend Model: BUY as of 11/6/2019
LT Trend Model: BUY as of 12/16/2019
USO Daily Chart: It looks as if the rally from the October low is still viable.
USO Weekly Chart: The narrow trading range prevails for the time being.

USO Monthly Chart: Price is in a basing pattern between 7.50 and 16.00 that could last for years.
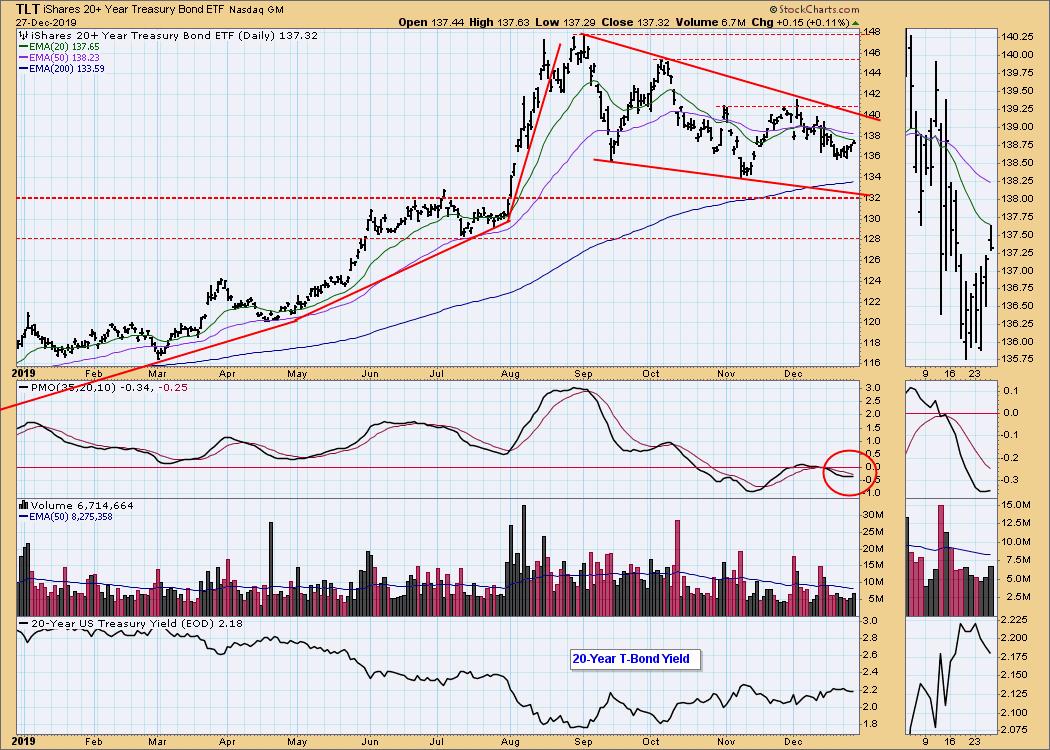
BONDS (TLT)
IT Trend Model: NEUTRAL as of 12/12/2019
LT Trend Model: BUY as of 1/2/2019
TLT Daily Chart: TLT has bottomed before reaching the bottom of the falling wedge formation, and the daily PMO has turned up. Looking good for an upside resolution of the wedge.
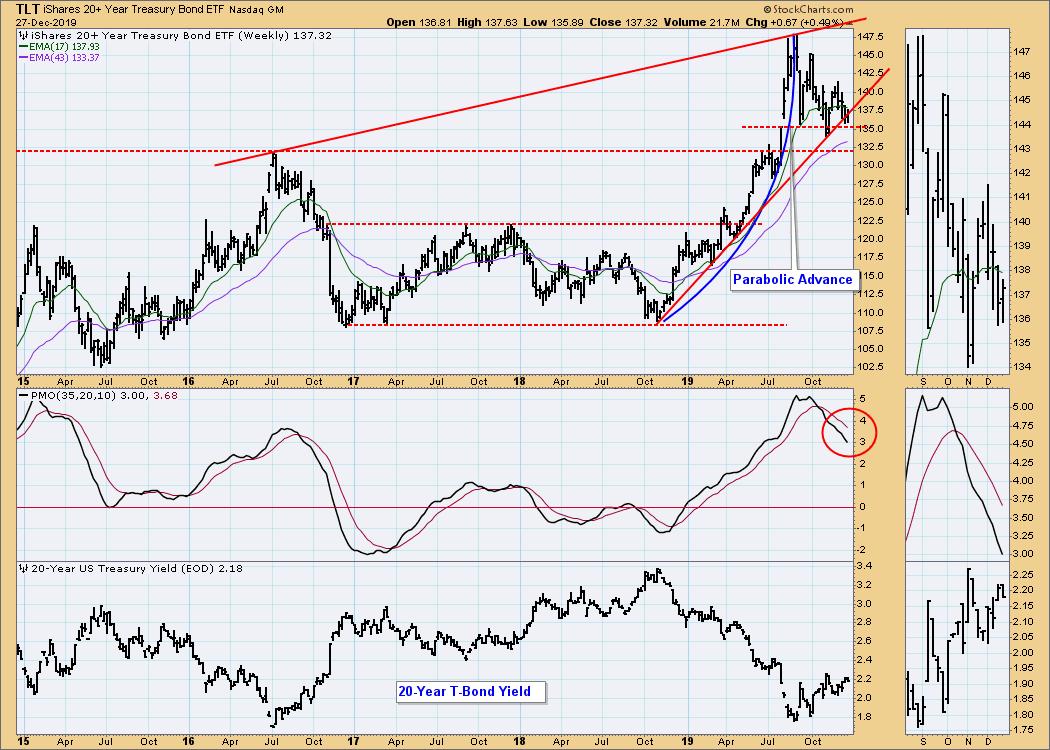
TLT Weekly Chart: The rising trend line is being tested hard, but there is no clear downside break yet.
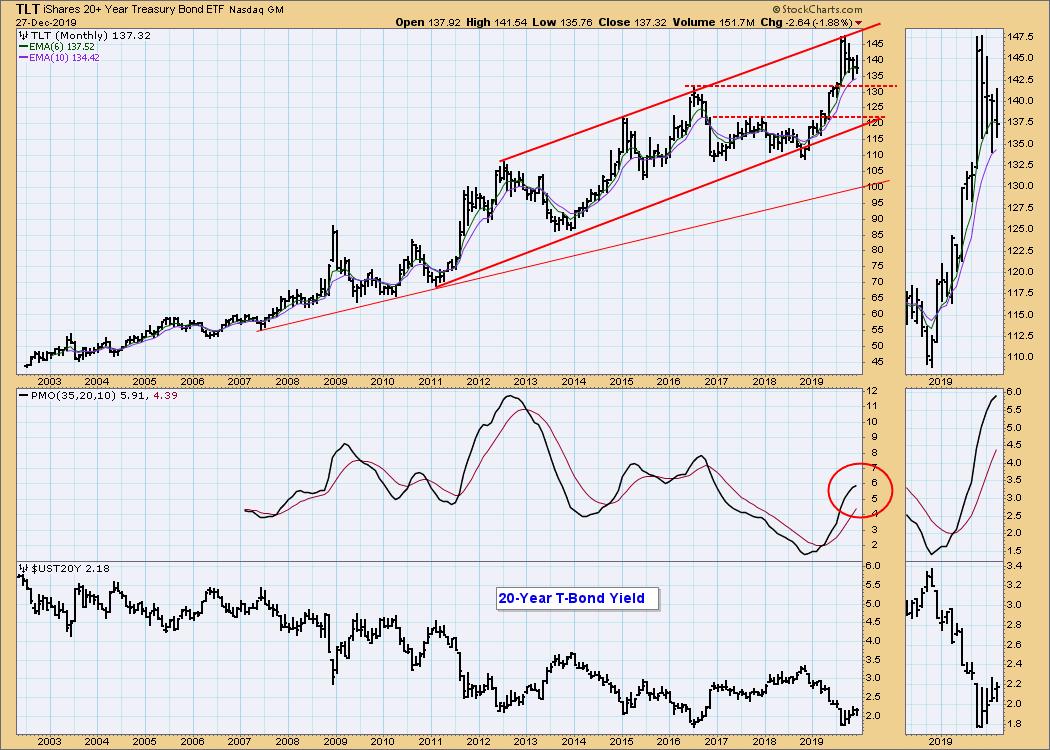
TLT Monthly Chart: The rising trend channel structure implies that price will head down or, at least, sideways for several months.
**Don't miss any of the DecisionPoint commentaries! Go to the "Notify Me" box toward the end of this blog page to be notified as soon as they are published.**
Technical Analysis is a windsock, not a crystal ball.
Happy Charting! - Carl
NOTE: The signal status reported herein is based upon mechanical trading model signals, specifically, the DecisionPoint Trend Model. They define the implied bias of the price index based upon moving average relationships, but they do not necessarily call for a specific action. They are information flags that should prompt chart review. Further, they do not call for continuous buying or selling during the life of the signal. For example, a BUY signal will probably (but not necessarily) return the best results if action is taken soon after the signal is generated. Additional opportunities for buying may be found as price zigzags higher, but the trader must look for optimum entry points. Conversely, exit points to preserve gains (or minimize losses) may be evident before the model mechanically closes the signal.
Helpful DecisionPoint Links:
DecisionPoint Shared ChartList and DecisionPoint Chart Gallery
Price Momentum Oscillator (PMO)
Swenlin Trading Oscillators (STO-B and STO-V)


