
Carl and I discussed in today's DecisionPoint show that finding "diamonds" could be difficult if the market decides it is finally ready for a correction. However, the Healthcare sector is considered a somewhat "defensive" area of the market. I wanted to stay away from Real Estate, as I don't like the XLRE chart, but I included one Real Estate sector stock today as I think the charts merit it.
I love to get your feedback on DP commentary, so shoot me an email at erinh@stockcharts.com. I read every one of them and try to answer them all! Your insight helps me to tailor my commentary to what my readers and viewers want to hear about.
Welcome to DecisionPoint Daily Diamonds, wherein I highlight five "diamonds in the rough." These are selected from the results of my DecisionPoint scans, which search for stocks that could benefit from the trend and condition of the market. Remember, these are not recommendations to buy or sell, but are the most interesting of the stocks that surfaced in my scans. My objective is to save you the work of the initial, tedious culling process, but you need to apply your own analysis to see if these stocks pique your interest as well. There are no guaranteed winners here!
Current Market Outlook:
Market Trend: Currently, we have Trend Model BUY signals in all three timeframes on the DP Scoreboard Indexes.
Market Condition: The market is overbought, with Price Momentum Oscillator (PMO) BUY signals on the DP Scoreboards. The SPX and OEX triggered new LT PMO BUY signals, so a corrective move is looking less likely. Remember, overbought conditions can persist in a bull market.
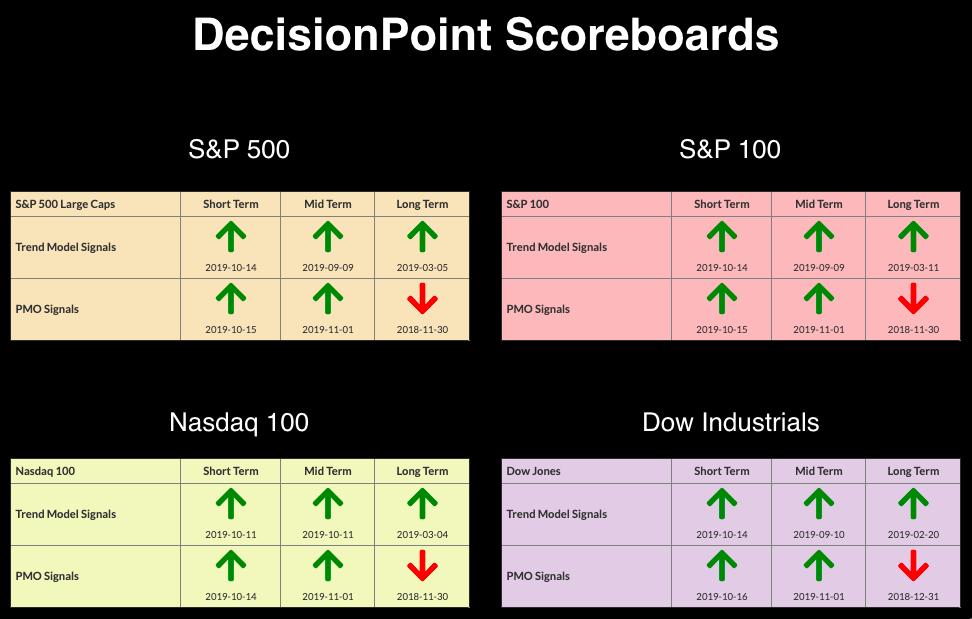
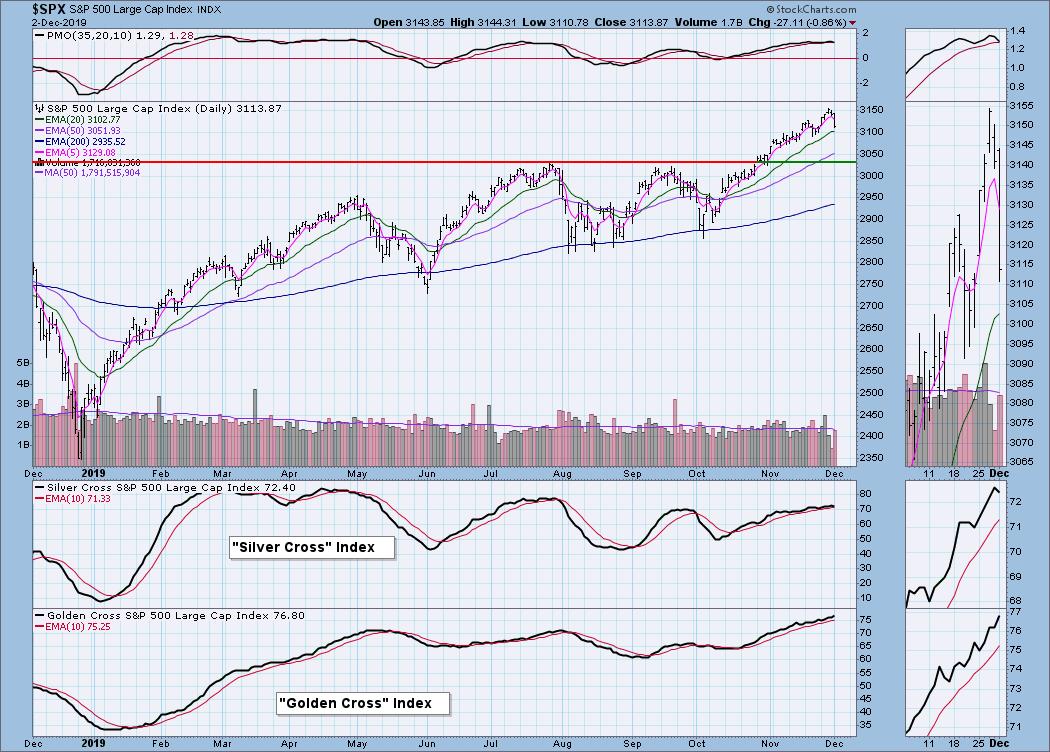
Market Environment: It is important to consider the odds for success. The Silver Cross Index measures the percentage of stocks on IT Trend Model BUY signals (20-EMA > 50-EMA), while the Golden Cross Index measures the percentage of stocks on LT Trend Model BUY signals (50-EMA > 200-EMA). Here are the current percentages on the Silver and Golden Cross Indexes:
Diamond Index:
- Diamond Scan Results: 4
- Diamond Dog Scan Results: 13
- Diamond Bull/Bear Ratio: .31
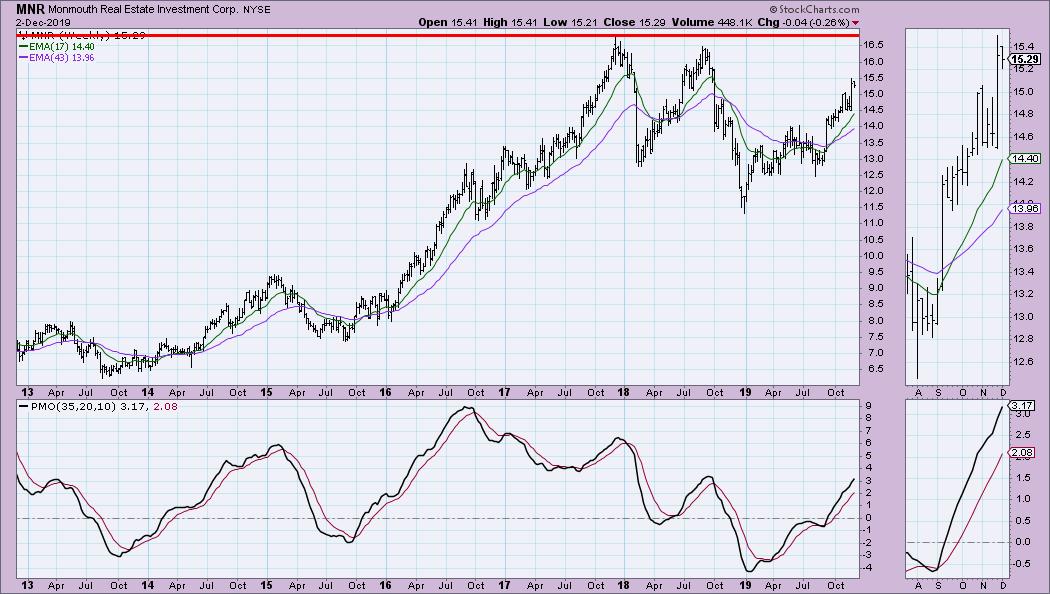
Monmouth Real Estate Investment Corp (MNR) - Earnings: 2/5 - 2/10/2020
While it is in a sector I'm not so fond of right now, I do like these charts on MNR. It was likely an earnings pop that triggered the breakout last week, but we had notice. The OBV had set up a nice positive divergence in relation to price lows. Right now, the breakout move is being consolidated. If it holds above the November top, I might consider an entry.
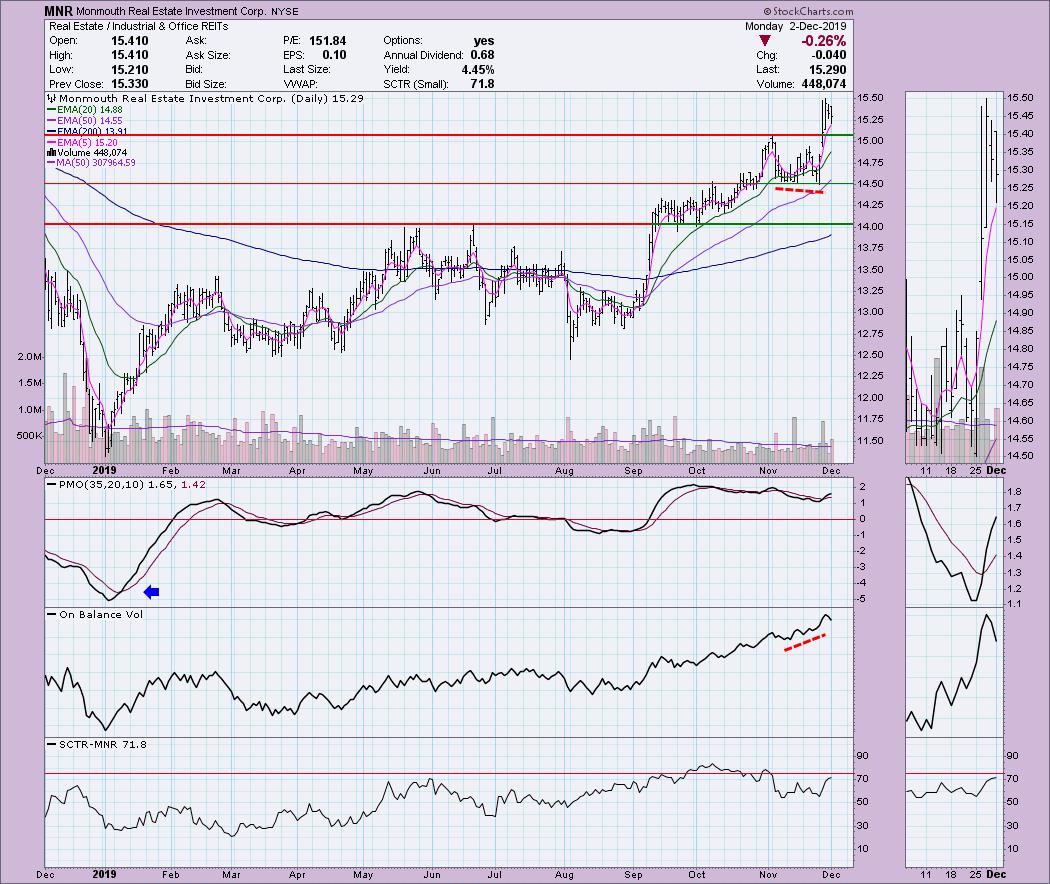
Plenty of upside potential for MNR. I don't really see any major overhead resistance until it starts getting close the 2017/18 tops. The PMO is rising strongly and is not overbought.
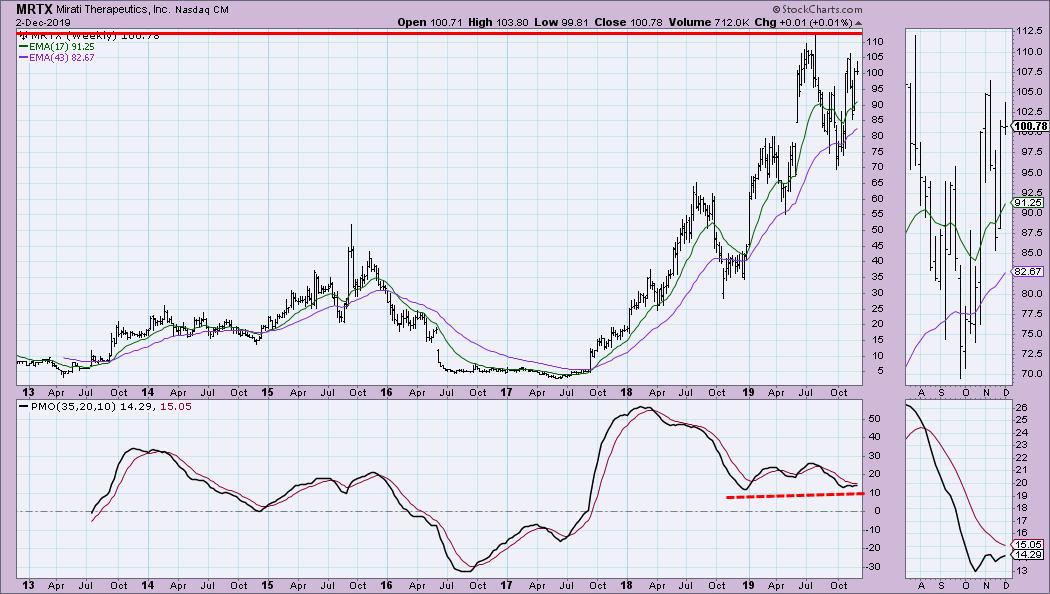
Mirati Therapeutics Inc (MRTX) - Earnings: 11/4/2019
This is a biotech stock, so be careful... they tend to be volatile and somewhat unpredictable. It's on a nice rally move following a correction last month. Volume is beginning to pick up on this rally; I'd consider a stop around $95 for protection on a pullback from this current rally.
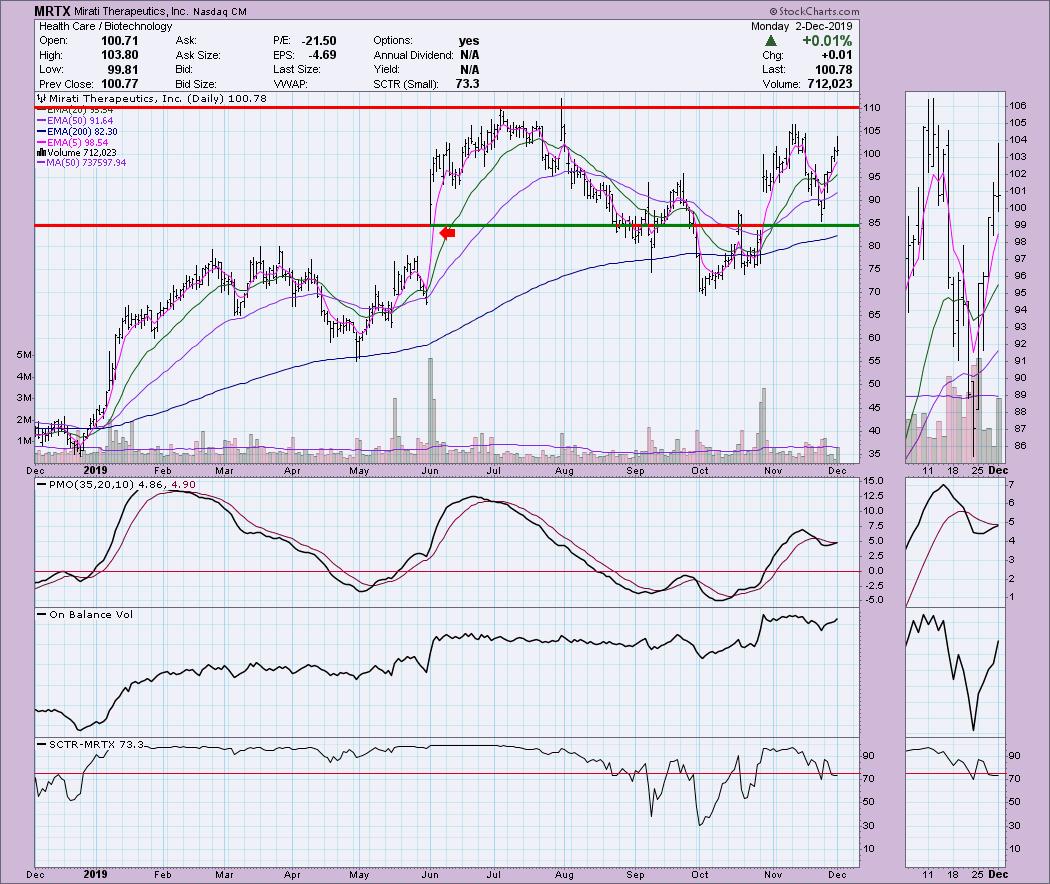
The weekly chart is okay as the weekly PMO is rising. We did see somewhat rising bottoms on the PMO during the current rising trend.
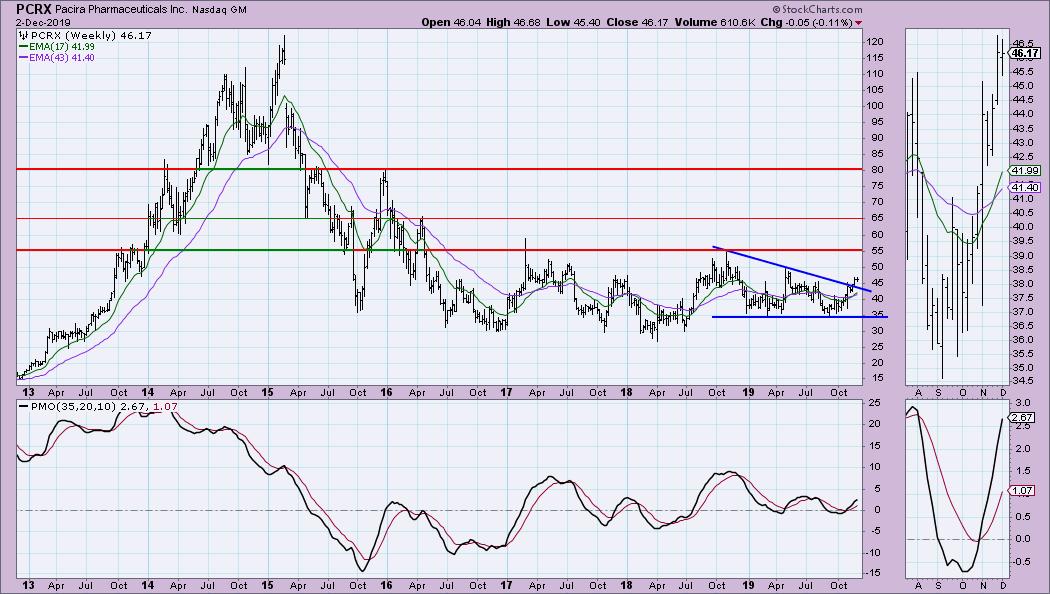
Pacira Pharmaceuticals Inc (PCRX) - Earnings: 2/26 - 3/2/2020
The breakout move is holding above the February/June/August tops. The 50-EMA just crossed above the 200-EMA, which moves PCRX into a bull market configuration. The PMO appears overbought, but we've seen it stretch higher. The OBV has been confirming this rally.
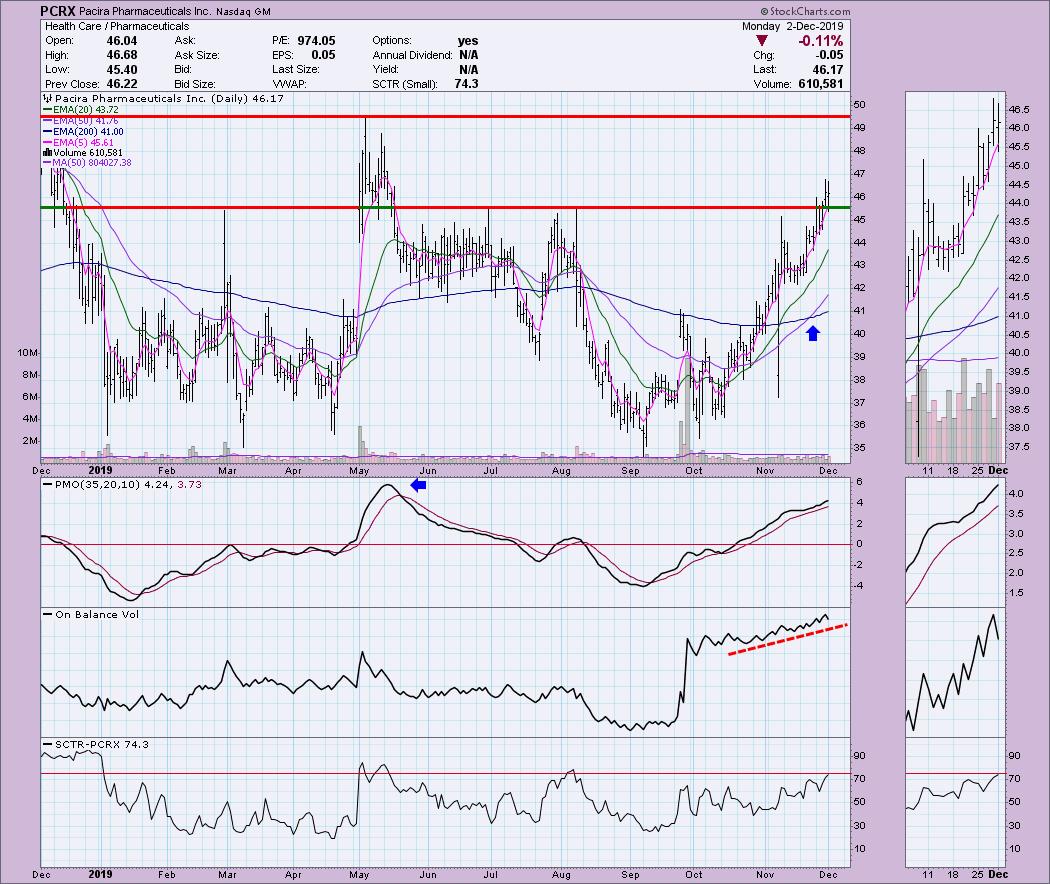
There is a bearish descending triangle on the weekly chart, but note that price broke out instead of breaking down. I find that especially bullish. Strong overhead resistance resides around $55.
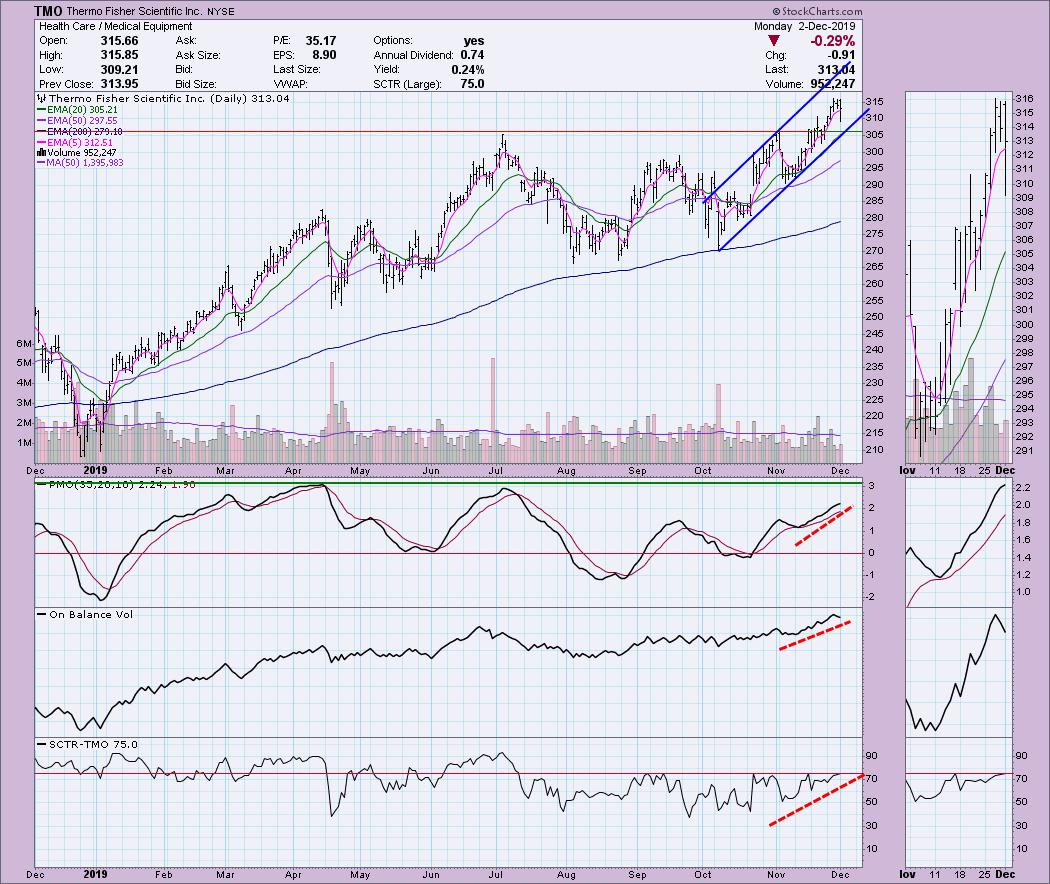
Thermo Fisher Scientific Inc (TMO) - Earnings: 1/28 - 2/3/2020
TMO remains in a nicely rising trend channel. It has broken out above previous resistance at the July and November tops. Today it pulled back, but didn't test the rising bottoms trend line, which I find positive. The PMO is only somewhat overbought. Notice that all of the indicators are confirming the current rally.
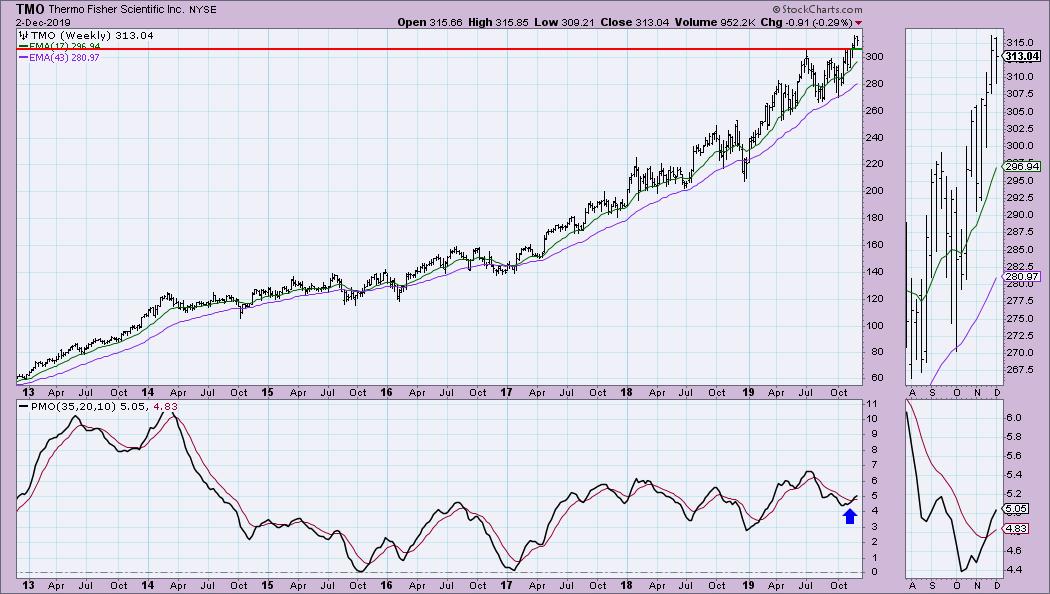
A nice weekly PMO BUY signal just arrived. The June price top needs to hold. Probably a good area to set a stop.
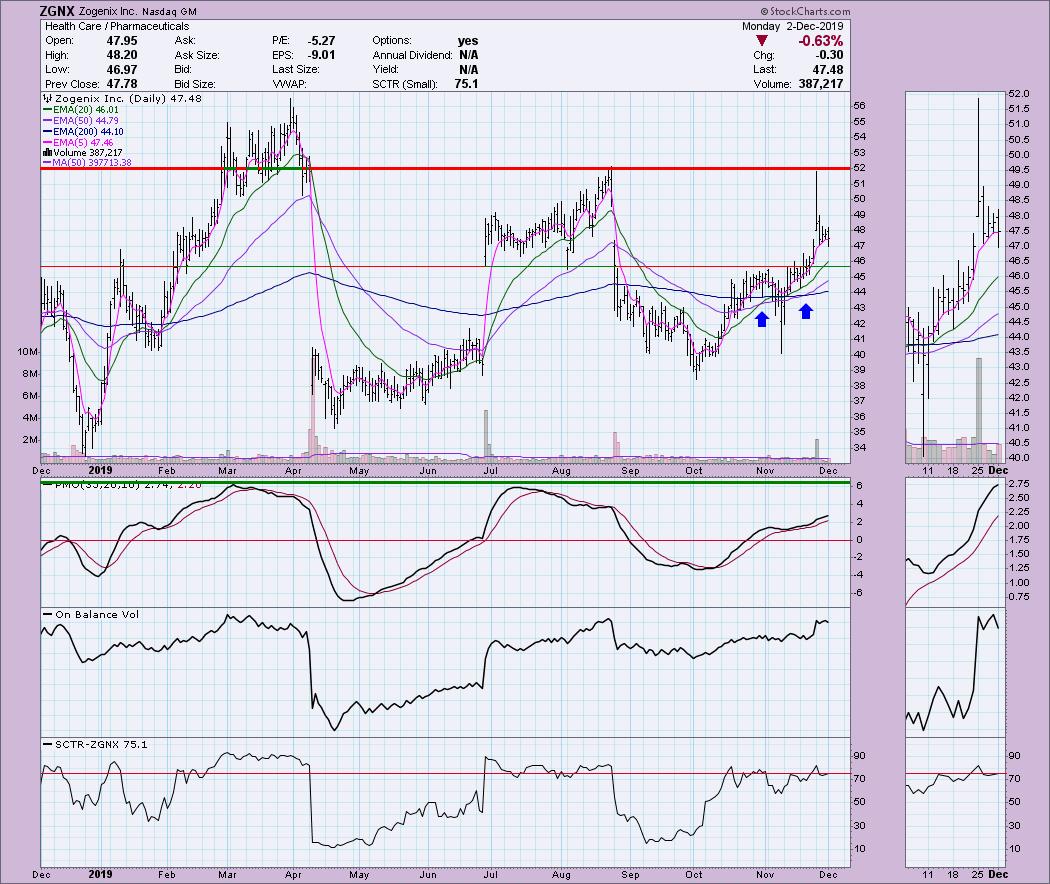
Zogenix Inc (ZGNX) - Earnings: 11/7/2019
Last month, ZGNX failed to overcome overhead resistance from the August top. However, it is poised to make another run. It may pull back further toward support around $46, but the PMO suggests it'll hold. The 20/50/200-EMAs have had positive crossovers, so the trend is in ZGNX's favor.
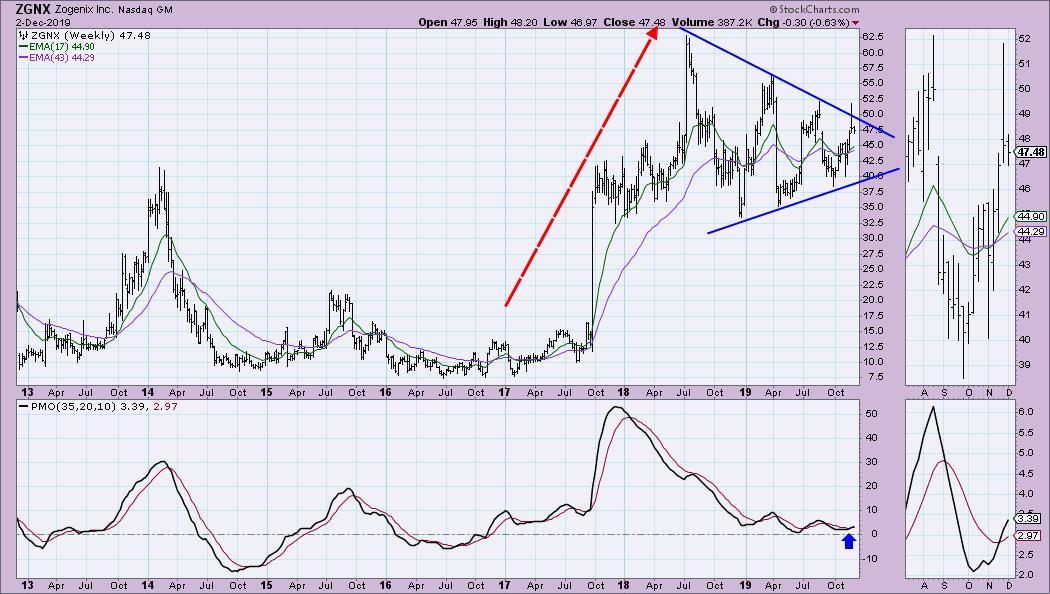
We can see that last week's breakout move was not sustained. However, a breakout to the upside is expected from this symmetrical triangle formation. Symmetrical triangles are continuation patterns. The prior trend was up, so a breakout to the upside is my expectation.
Full Disclosure: I do not own any of the stocks above and I'm not planning on adding any at this time. With today's pullback, I am going to be on alert and checking out my previous Diamond selections. I'm currently about 80% in cash.
Do NOT Miss This Event!
I will be presenting at the "Market Vision 2020" online conference on January 4th! It is sponsored by EarningsBeats.com and promises to be "THE" event to start the new year. We will have many of the commentators that you love presenting their "market view" for 2020, with John Murphy as the keynote speaker! For information on the event, sign up for the free emails, which will give you all the details as we get closer!

Erin Swenlin will be presenting at the The MoneyShow Las Vegas May 11-13, 2020! You'll have an opportunity to meet Erin and discuss the latest DecisionPoint news and Diamond Scans. The conference is free to attend or view online!
Watch the latest episode of DecisionPoint with Carl & Erin Swenlin LIVE on Mondays 5:00p EST or on the StockCharts TV YouTube channel here!
Technical Analysis is a windsock, not a crystal ball.
Happy Charting!
- Erin
erinh@stockcharts.com
NOTE: The stocks reported herein are from mechanical trading model scans that are based upon moving average relationships, momentum and volume. DecisionPoint analysis is then applied to get five selections from the scans. The selections given should prompt readers to do a chart review using their own analysis process. This letter is not a call for a specific action to buy, sell or short any of the stocks provided. There are NO sure things or guaranteed returns on the daily selection of "diamonds in the rough."
Helpful DecisionPoint Links:
DecisionPoint Shared ChartList and DecisionPoint Chart Gallery
Price Momentum Oscillator (PMO)
Swenlin Trading Oscillators (STO-B and STO-V)
**Don't miss DecisionPoint Commentary! Add your email below to be notified of new updates"**


