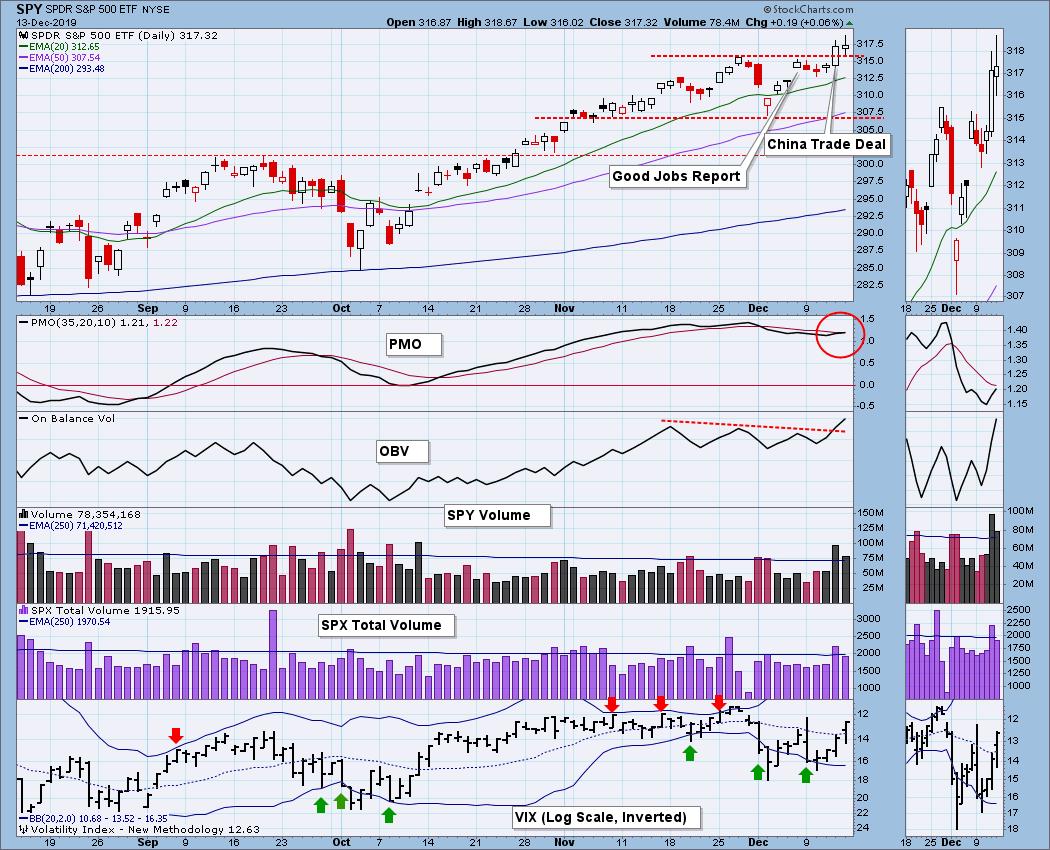
In the last two weeks the S&P 500 has advanced about +3.75% from its low, and about 1.5% of that move was due to two days of news-generated rallies -- the favorable jobs report last week, and apparent successful completion if Phase I of the China Trade Deal announced on Thursday. The problem is that there was no follow through rally on Friday because of rumors of Chinese quibbling about details. Nevertheless, new, all-time highs were made again this week. Is there any room for quibbling on the technicals? Let's look.
The DecisionPoint Weekly Wrap presents an end-of-week assessment of the trend and condition of the stock market (S&P 500), the U.S. Dollar, Gold, Crude Oil, and Bonds.
Watch the latest episode of DecisionPoint on StockCharts TV's YouTube channel here!
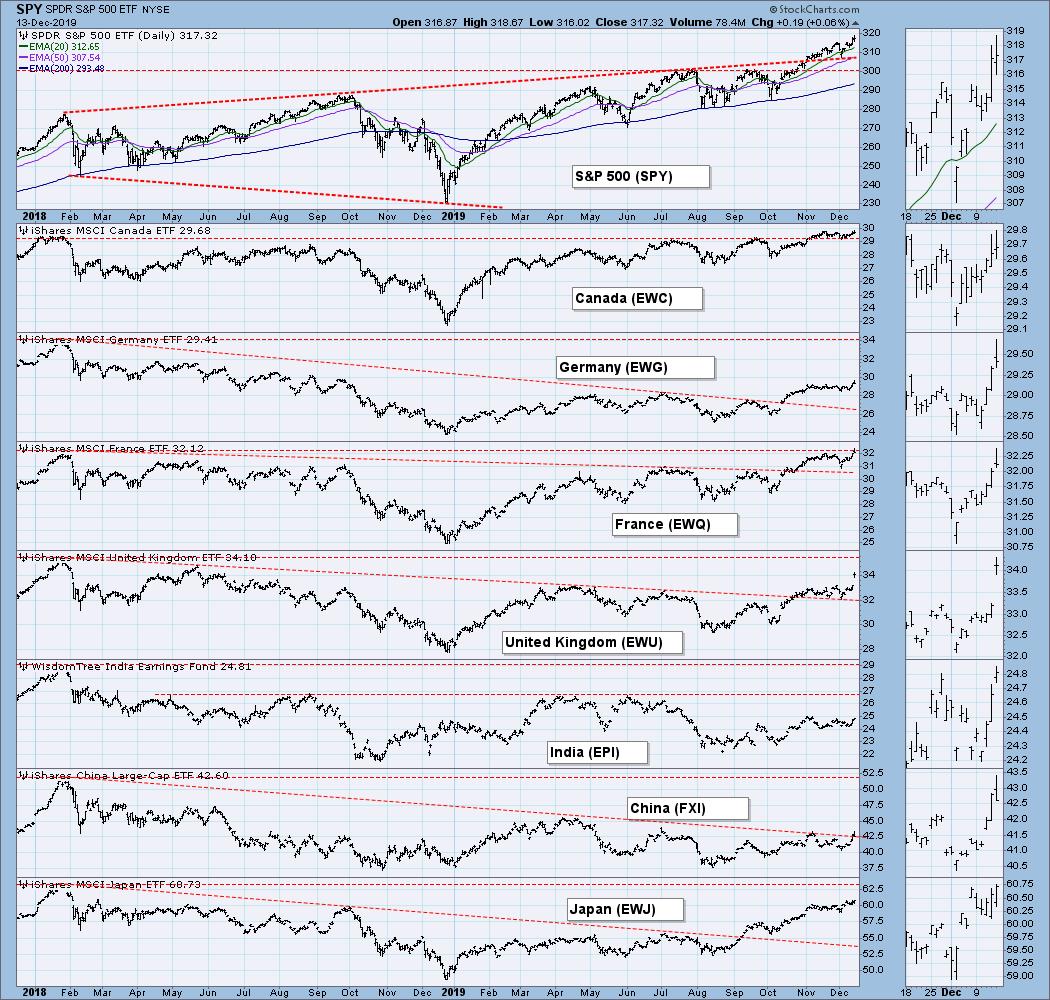
GLOBAL MARKETS
The U.S. still leads the globe.
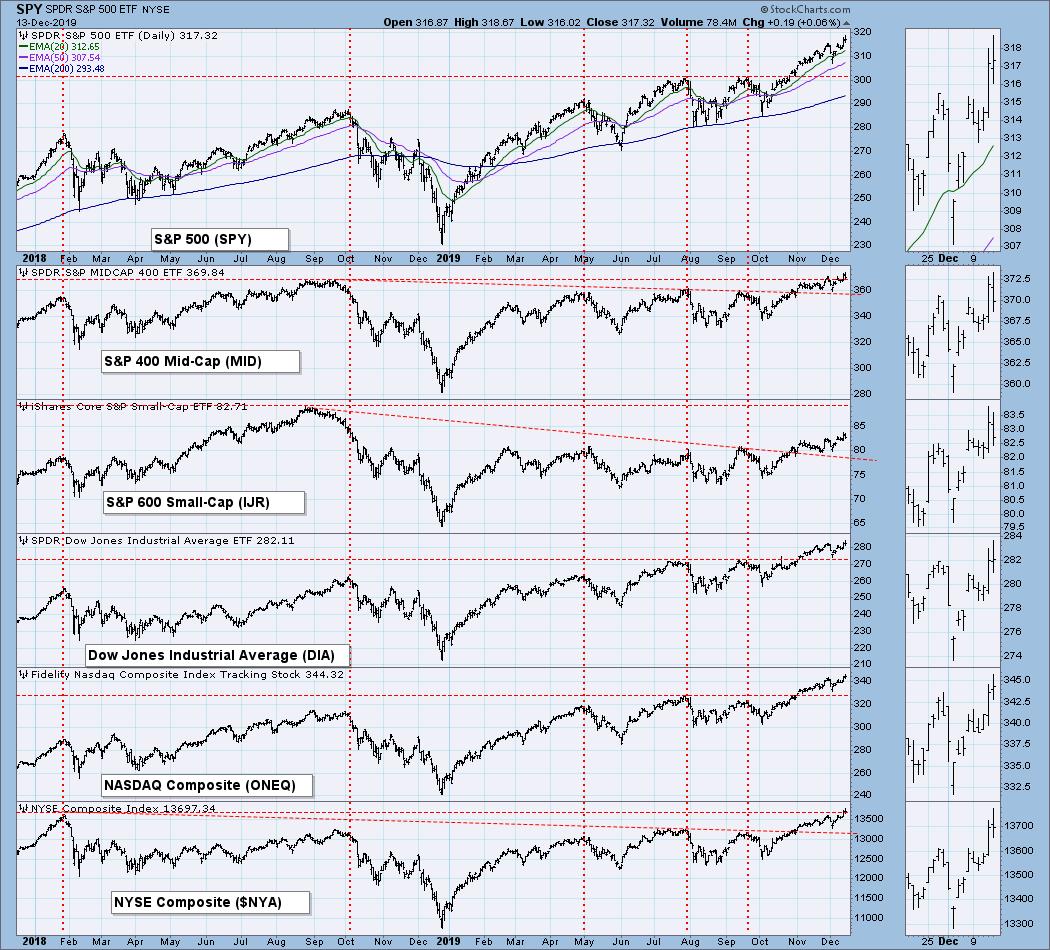
BROAD MARKET INDEXES
Te small caps still lag and need to rally about another seven percent to make new, all-time highs.
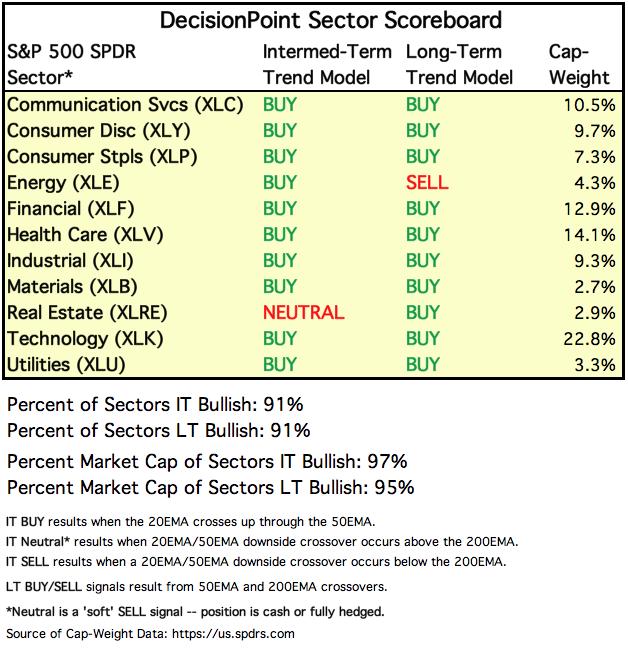
SECTORS
Each S&P 500 Index component stock is assigned to one, and only one, of 11 major sectors. This is a snapshot of the Intermediate-Term and Long-Term Trend Model signal status for those sectors.
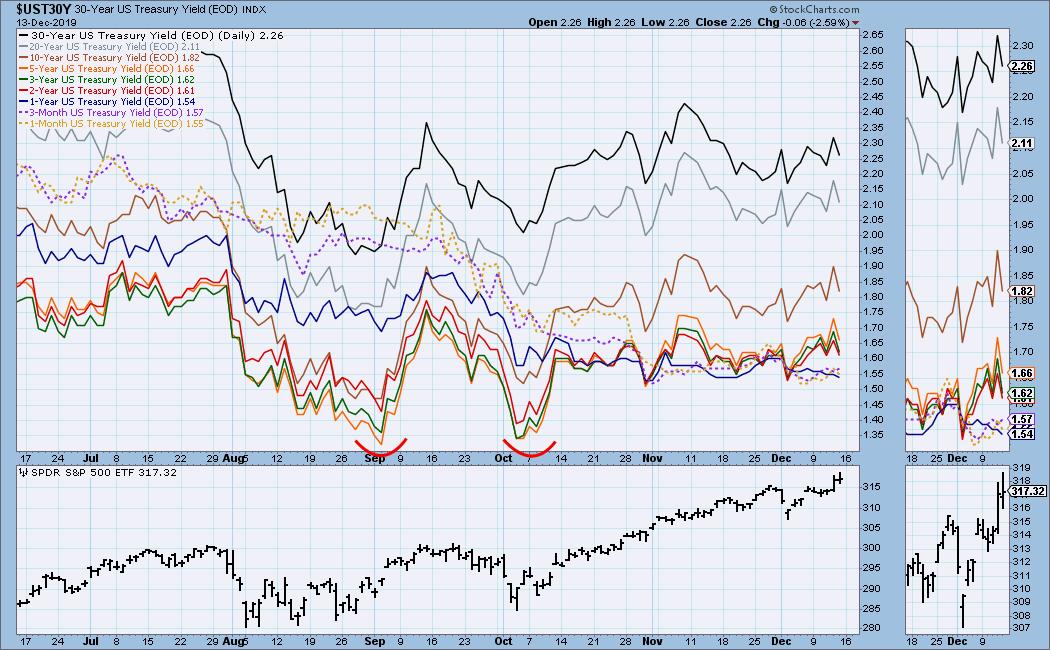
INTEREST RATES
This chart is included so we can monitor rate inversions. In normal circumstances the longer money is borrowed the higher the interest rate that must be paid. When rates are inverted, the reverse is true.
STOCKS
IT Trend Model: BUY as of 9/6/2019
LT Trend Model: BUY as of 2/26/2019
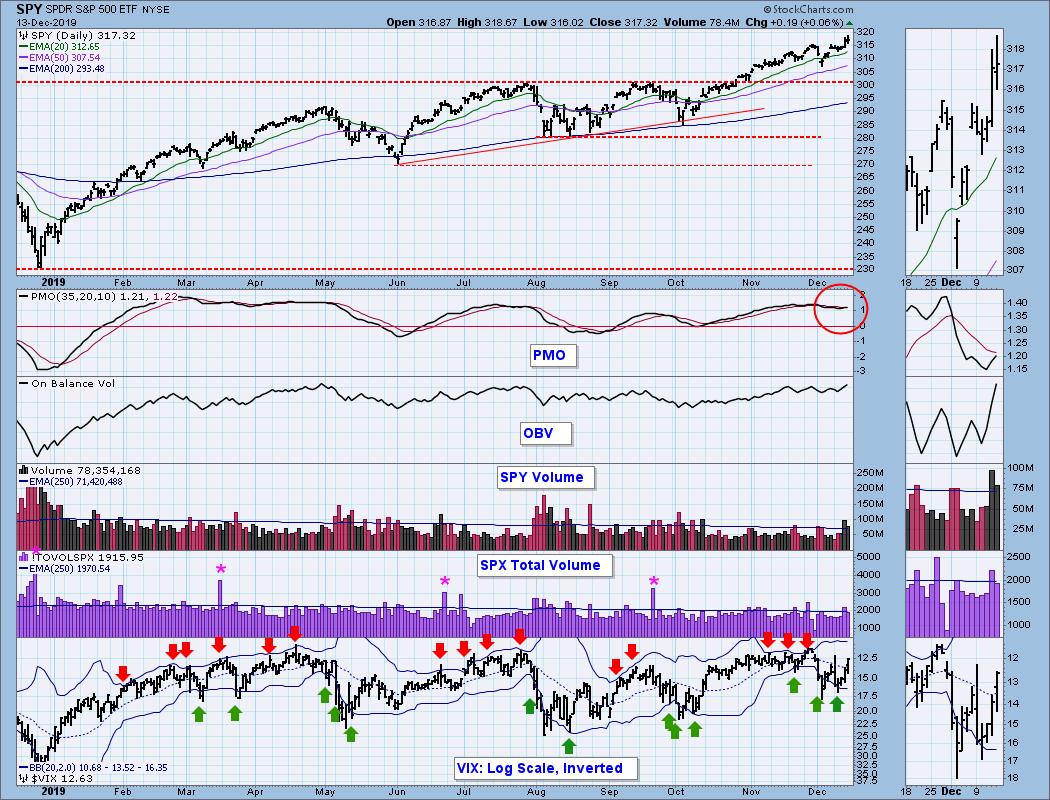
SPY Daily Chart: [[comments]]
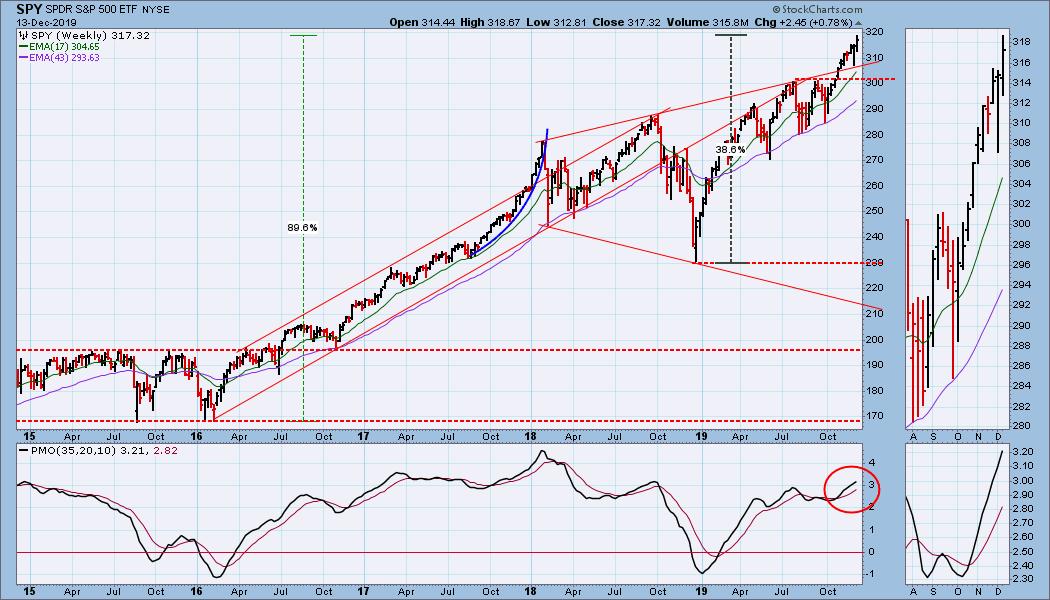
SPY Weekly Chart: [[comments]]
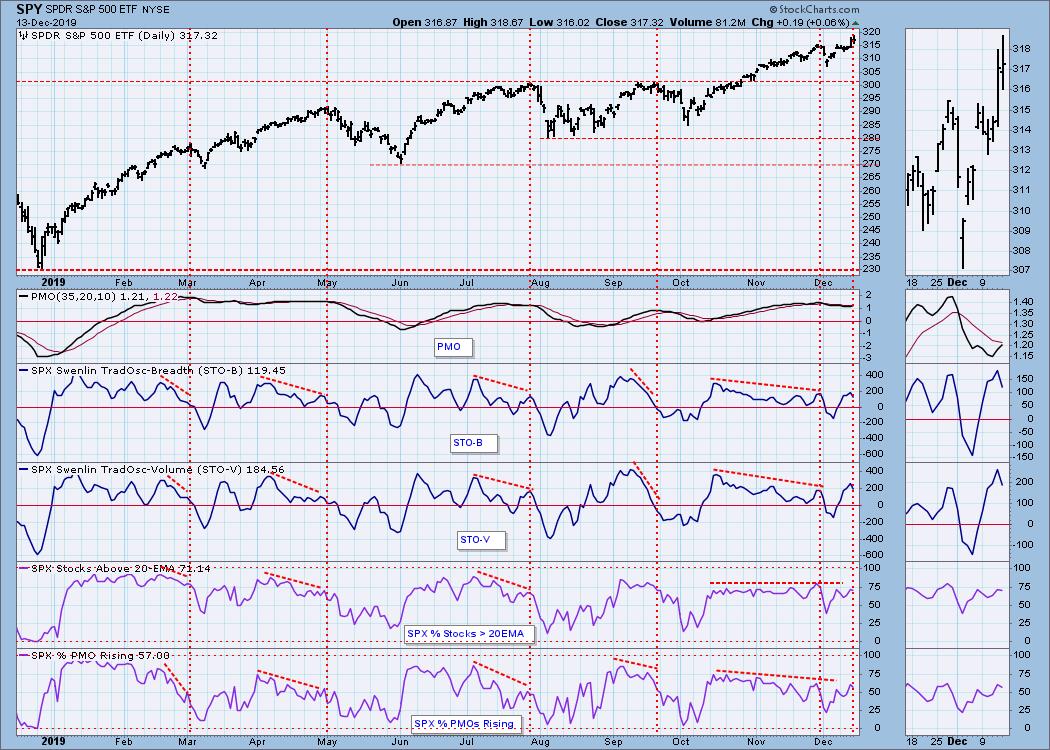
Climactic Market Indicators: With spikes on all breadth and volume indicators, we definitely had a climax day on Thursday, and at the time I interpreted it as an initiation climax, but the market's failed follow through attempt on Friday gave me second thoughts. To clarify, the market was up in the morning, but fizzled by the close.
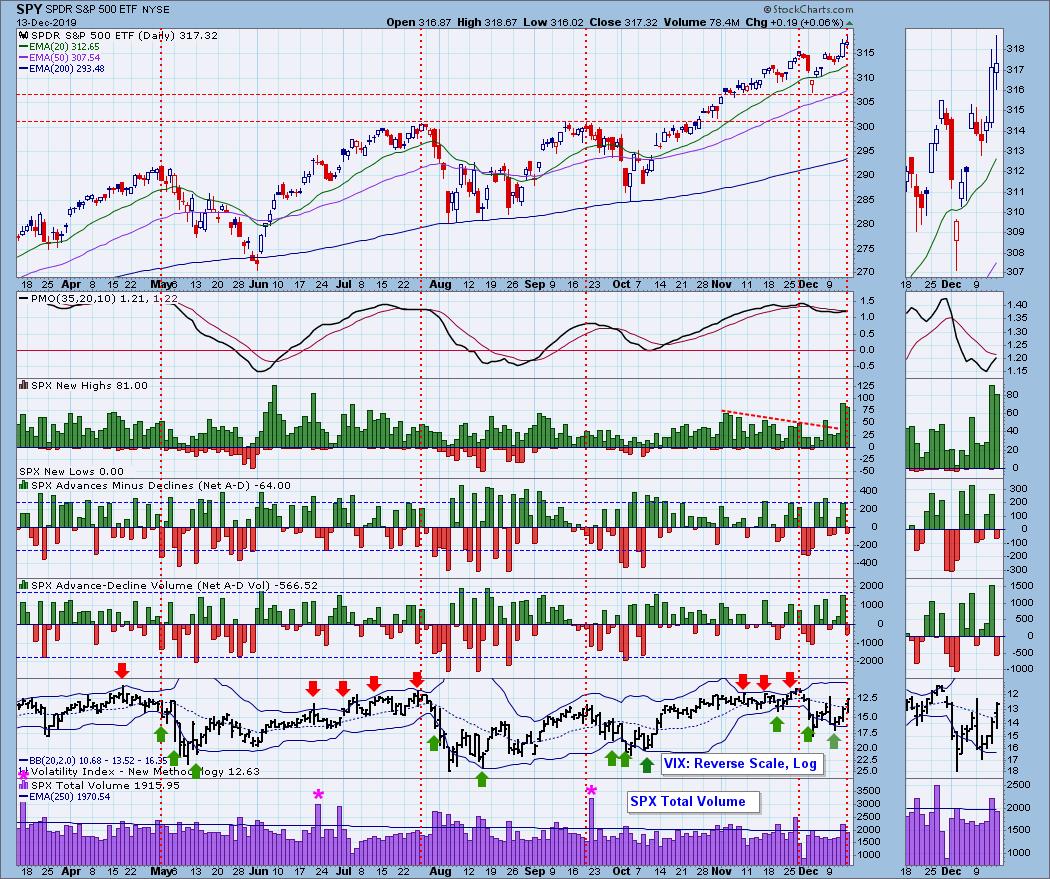
Short-Term Market Indicators: Since mid-October these indicators have maintained a fairly narrow range. Currently, they have topped near the top of the range, and will allow for a small price decline before they are oversold.
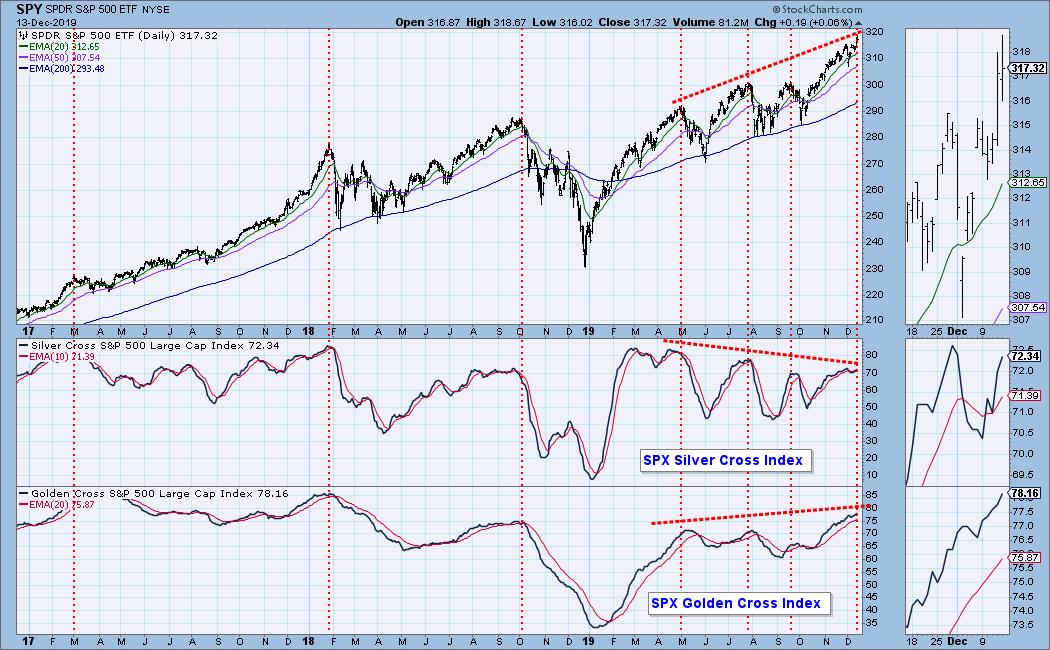
Intermediate-Term Market Indicators: The Golden Cross Index (percent stocks where 50EMA is above 200EMA) is robust and at its highest level since the 2018 price low. The Silver Cross Index (percent stocks where 20EMA is above 50EMA) is not "robust," and its series of lower tops forms a negative divergence.
The indicators below are rising after bottoming in modestly overbought territory. There is room for them to accommodate continued price advance, but they will become very overbought soon.
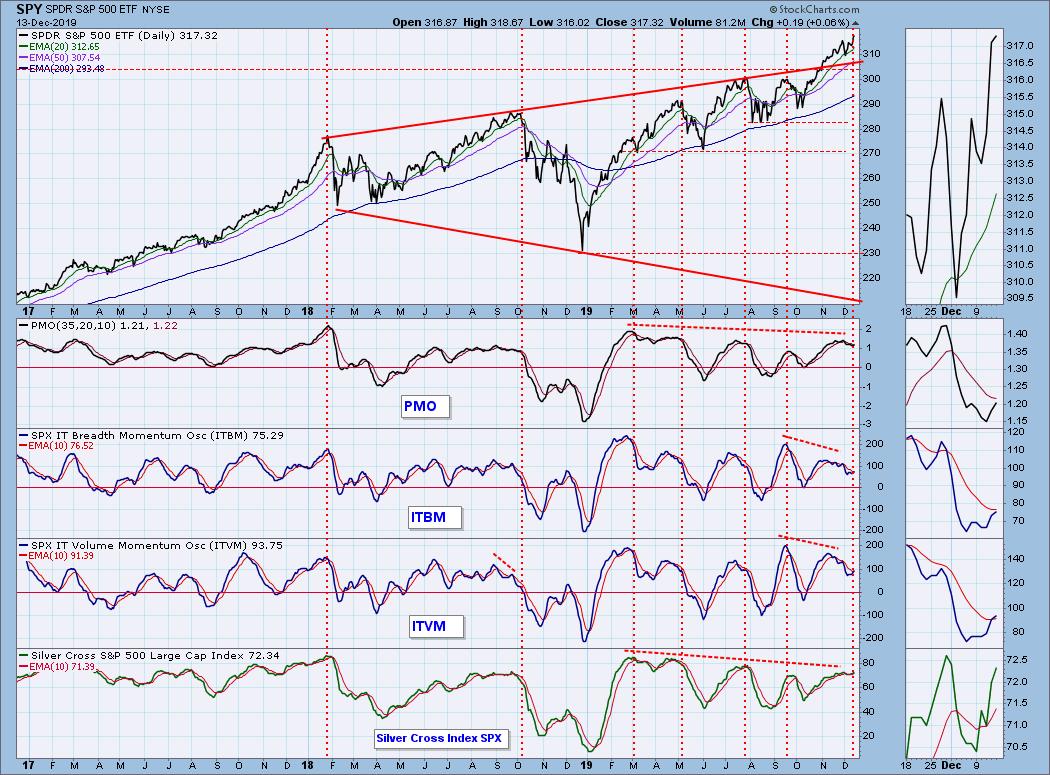
CONCLUSION: Next week is an end-of-quarter option expiration week, so I expect very high volume on Friday and low volatility toward the end of the week. The negative divergences evident on the chart above cause me some concern, but the market shows no inclination to enter a serious decline, and it seems likely to me that itwill continue higher at a slow but steady pace until January.
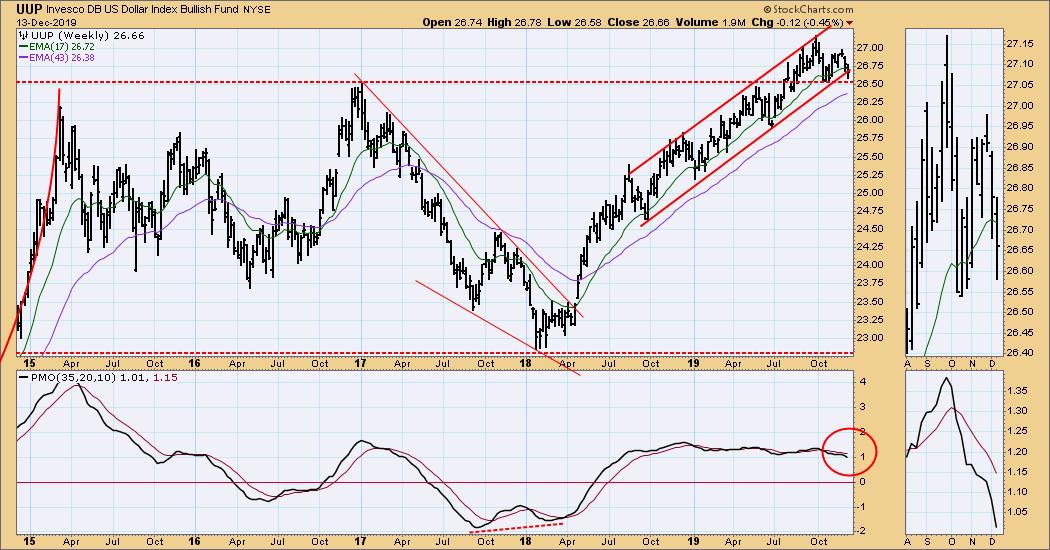
DOLLAR (UUP)
IT Trend Model: NEUTRAL as of 12/11/2019
LT Trend Model: BUY as of 5/25/2018
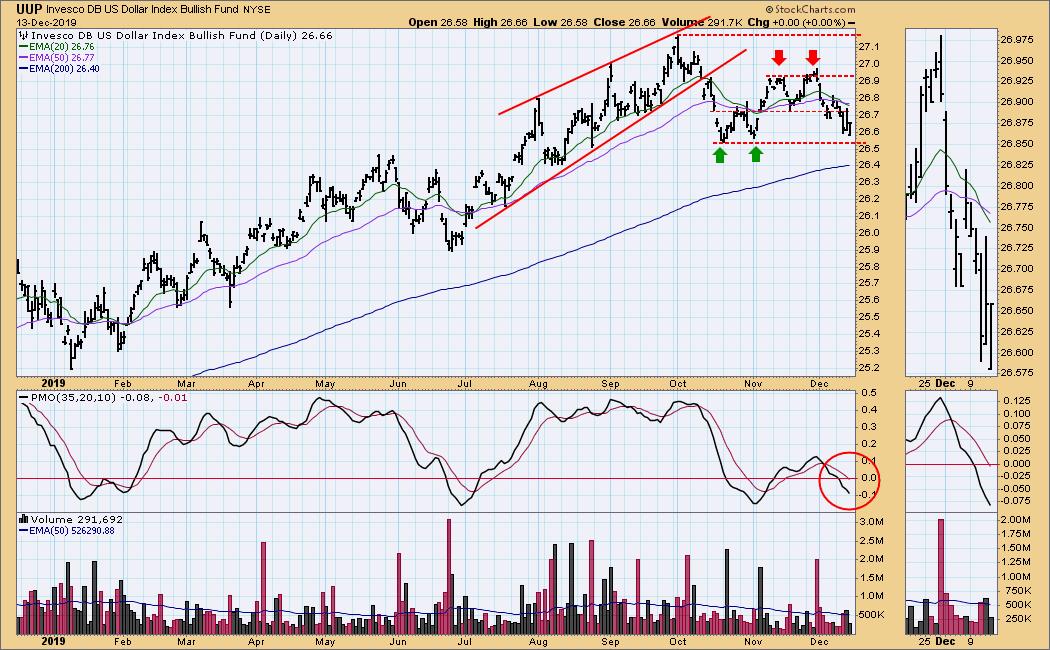
UUP Daily Chart: the October/November double bottom executed and reached the minimum upside projection. Subsequently, a double top has set the top of a trading range. The daily PMO is near the one-year oversold level, so the trading range may hold.
UUP Weekly Chart: UUP has broken down through the bottom of a one-year rising trend channel. The fact that the last attempt to reach the top of the channel failed was bearish, and price has since broken down through the bottom of the channel. However, the primary support is the long-term horizontal support line. If that fails, it would be a serious issue.
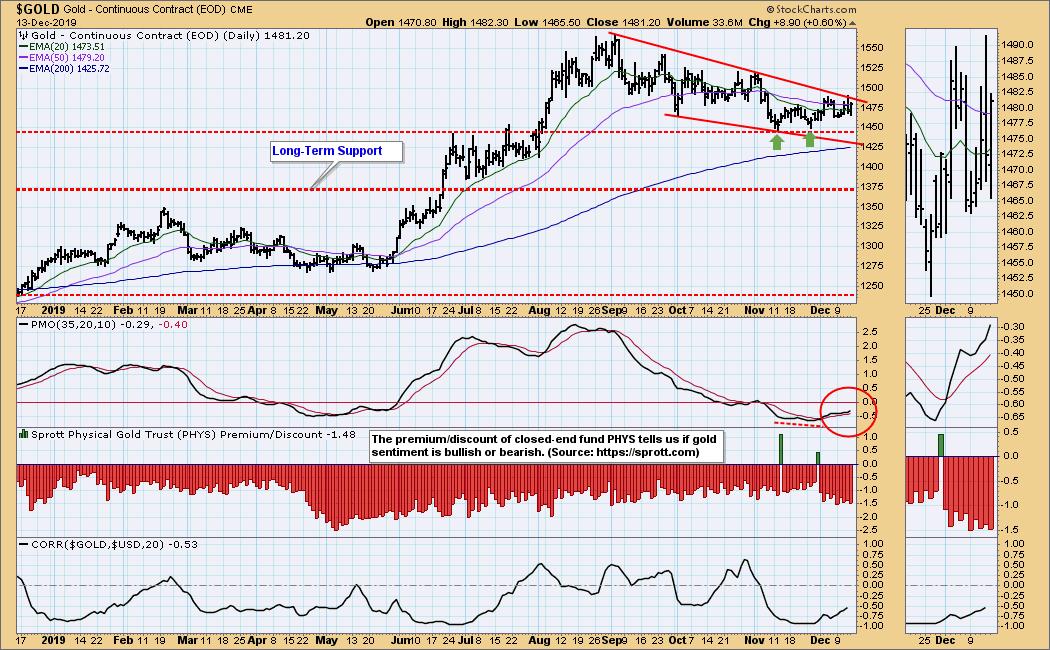
GOLD
IT Trend Model: NEUTRAL as of 11/8/2019
LT Trend Model: BUY as of 1/8/2019
GOLD Daily Chart: Last month gold found support at 1445 with a double bottom. Price has formed a bullish falling wedge, but it is not very tight (barely discernible convergence of the top and bottom) and looks more like a declining trend channel. At any rate, gold began pressing against the top of the formation on Thursday, and the chart looks modestly bullish to me.
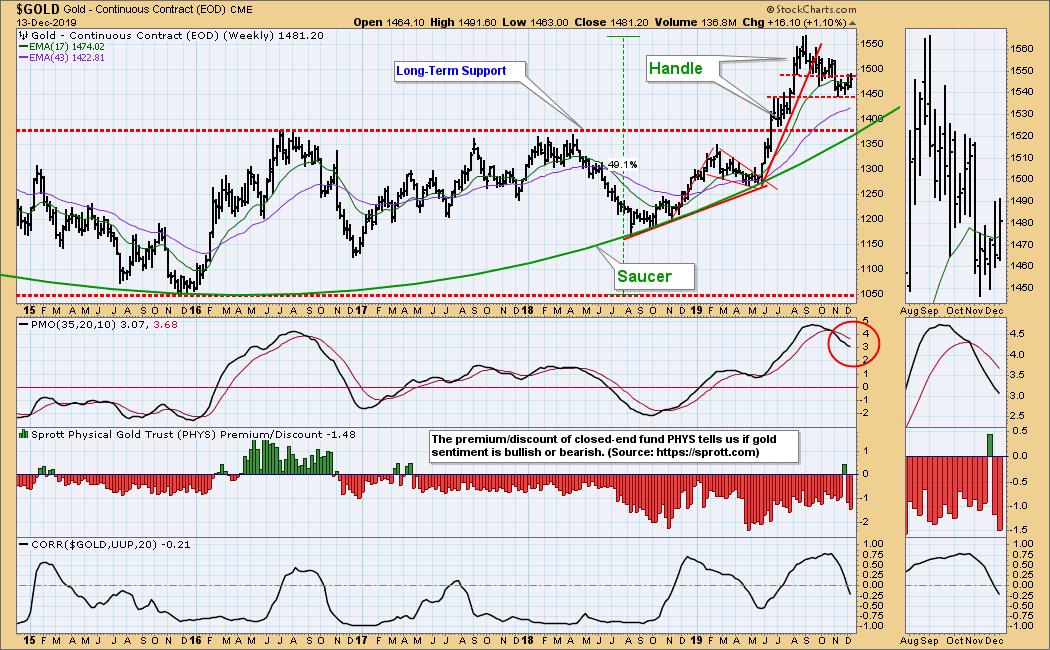
GOLD Weekly Chart: In this time frame we can see part of a bullish saucer with handle, the handle forming well above important long-term support at 1375. The weekly PMO is coming down off overbought levels. I don't think the 1375 support will be challenged, but there is a large net short position (commercials) that needs to be relieved before the upside is clear.
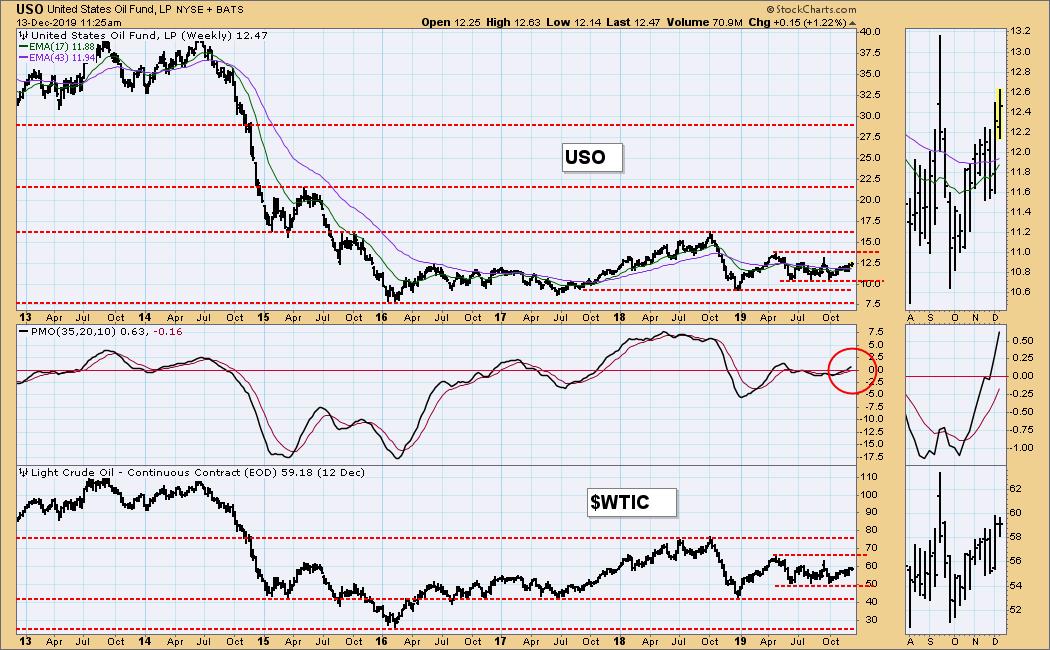
CRUDE OIL (USO)
IT Trend Model: BUY as of 11/6/2019
LT Trend Model: SELL as of 6/4/2019
USO Daily Chart: USO is rising within a trading range, and my expectation is that it will remain within that range.
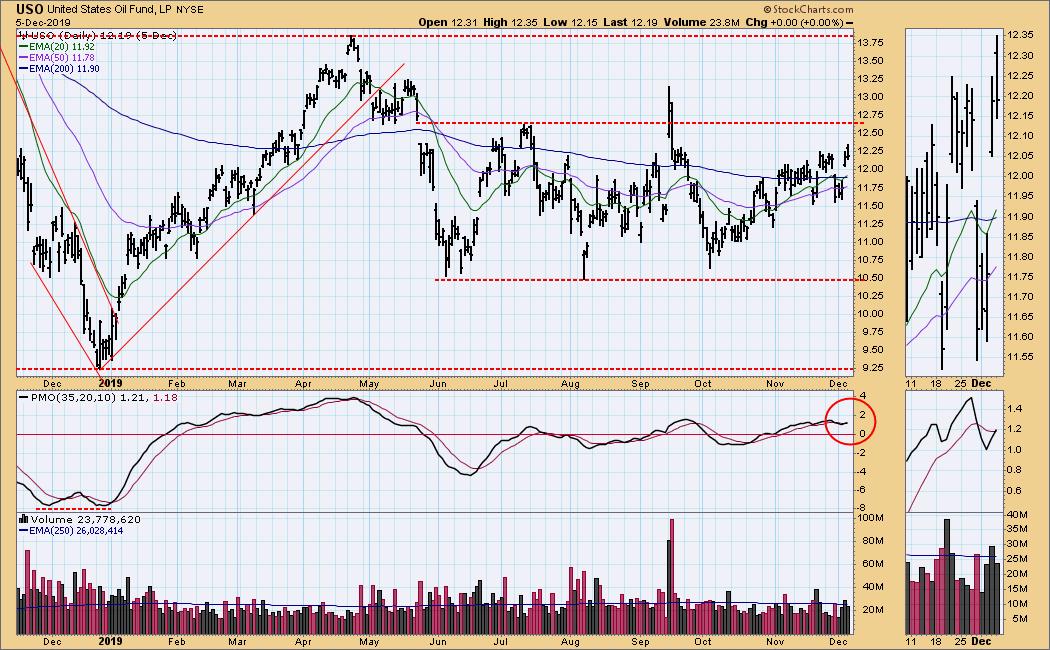
USO Weekly Chart: The trading range for WTIC is 42 to 76.
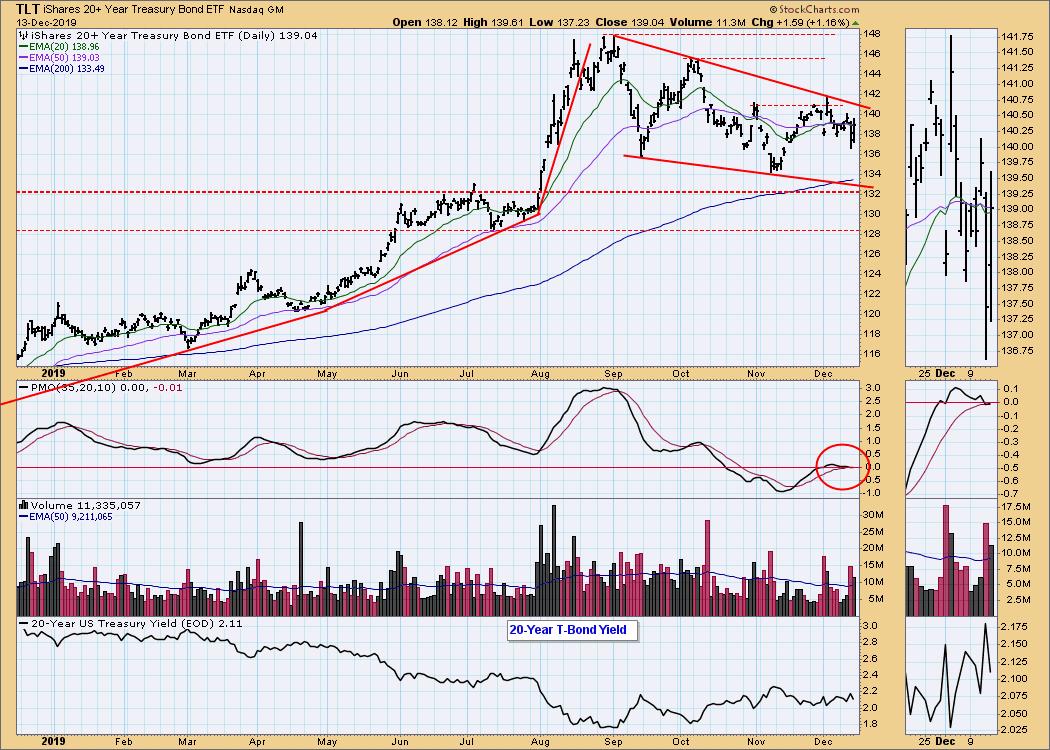
BONDS (TLT)
IT Trend Model: NEUTRAL as of 12/12/2019
LT Trend Model: BUY as of 1/2/2019
TLT Daily Chart: On Wednesday the 20EMA crossed up through the 50EMA, and the IT Trend Model changed from NEUTRAL to BUY. On Thursday the reverse happened, so we are back to NEUTRAL. Because of sideways price movement, those EMAs are virtually identical, so minor price fluctuations will result in more whipsaw signal changes until price breaks one way or the other. The falling wedge formation implies an ultimate upside resolution, but a trading range between 132 and 148 should hold until the Fed changes rates again.
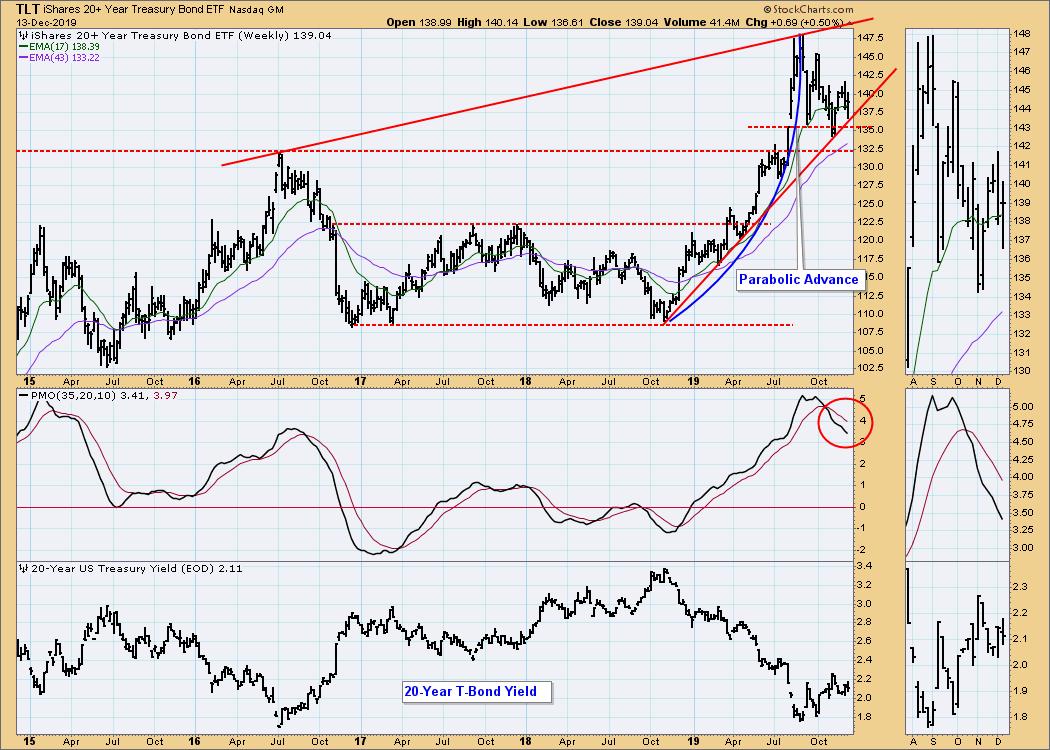
TLT Weekly Chart: Price collapsed after a parabolic advance, and the decline has been stopped by a rising trend line.
**Don't miss any of the DecisionPoint commentaries! Go to the "Notify Me" box toward the end of this blog page to be notified as soon as they are published.**
Technical Analysis is a windsock, not a crystal ball.
Happy Charting! - Carl
NOTE: The signal status reported herein is based upon mechanical trading model signals, specifically, the DecisionPoint Trend Model. They define the implied bias of the price index based upon moving average relationships, but they do not necessarily call for a specific action. They are information flags that should prompt chart review. Further, they do not call for continuous buying or selling during the life of the signal. For example, a BUY signal will probably (but not necessarily) return the best results if action is taken soon after the signal is generated. Additional opportunities for buying may be found as price zigzags higher, but the trader must look for optimum entry points. Conversely, exit points to preserve gains (or minimize losses) may be evident before the model mechanically closes the signal.
Helpful DecisionPoint Links:
DecisionPoint Shared ChartList and DecisionPoint Chart Gallery
Price Momentum Oscillator (PMO)
Swenlin Trading Oscillators (STO-B and STO-V)


