
Today I decided to revisit my my Dad (Carl)'s Scan, a very simple combination of rising Price Momentum Oscillator and negative configuration of the price EMAs. The one problem with this scan is that it finds "beat down" stocks that are in the process of reversing. Consequently, the weekly charts aren't much to write home about. However, a rising weekly PMO may take time to develop and these stocks could be ready to make that intermediate-term change. In any case, I thought these looked like promising diamonds in the short term.
Don't forget, on Thursdays I look at reader-requested symbols, so shoot me an email at erinh@stockcharts.com. I read every email I receive and try to answer them all! Your insight helps me to tailor my commentary to what my readers and viewers want to hear about.
Welcome to DecisionPoint Daily Diamonds, wherein I highlight five "diamonds in the rough." These are selected from the results of my DecisionPoint scans, which search for stocks that could benefit from the trend and condition of the market. Remember, these are not recommendations to buy or sell, but are the most interesting of the stocks that surfaced in my scans. My objective is to save you the work of the initial, tedious culling process, but you need to apply your own analysis to see if these stocks pique your interest as well. There are no guaranteed winners here!
Current Market Outlook:
Market Trend: Currently, we have Trend Model BUY signals in all three timeframes on the DP Scoreboard Indexes.
Market Condition: After a pause, the market is continuing higher. While it can be considered overbought, we must remember that, in a bull market, overbought conditions can persist.
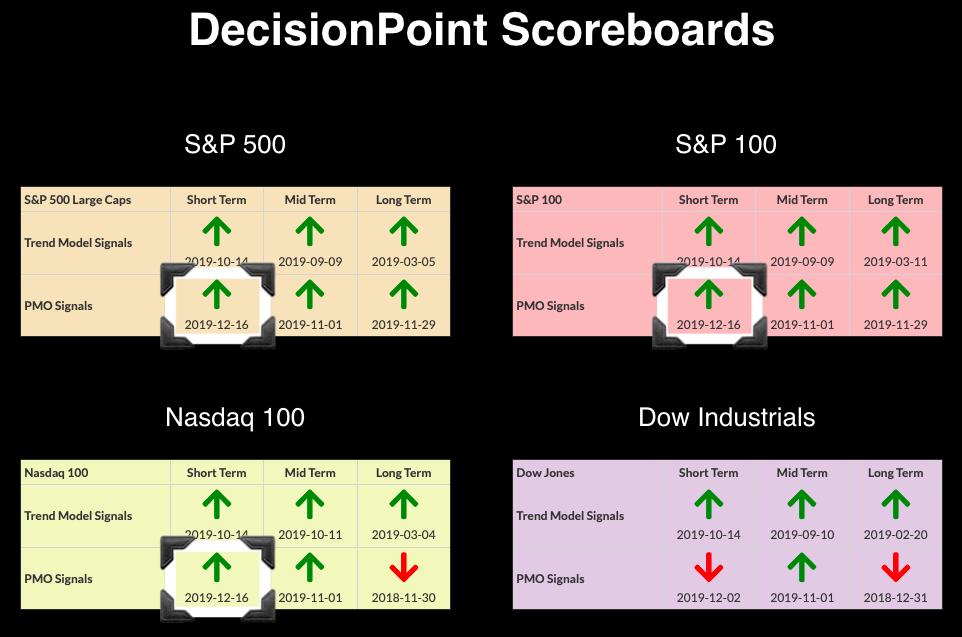
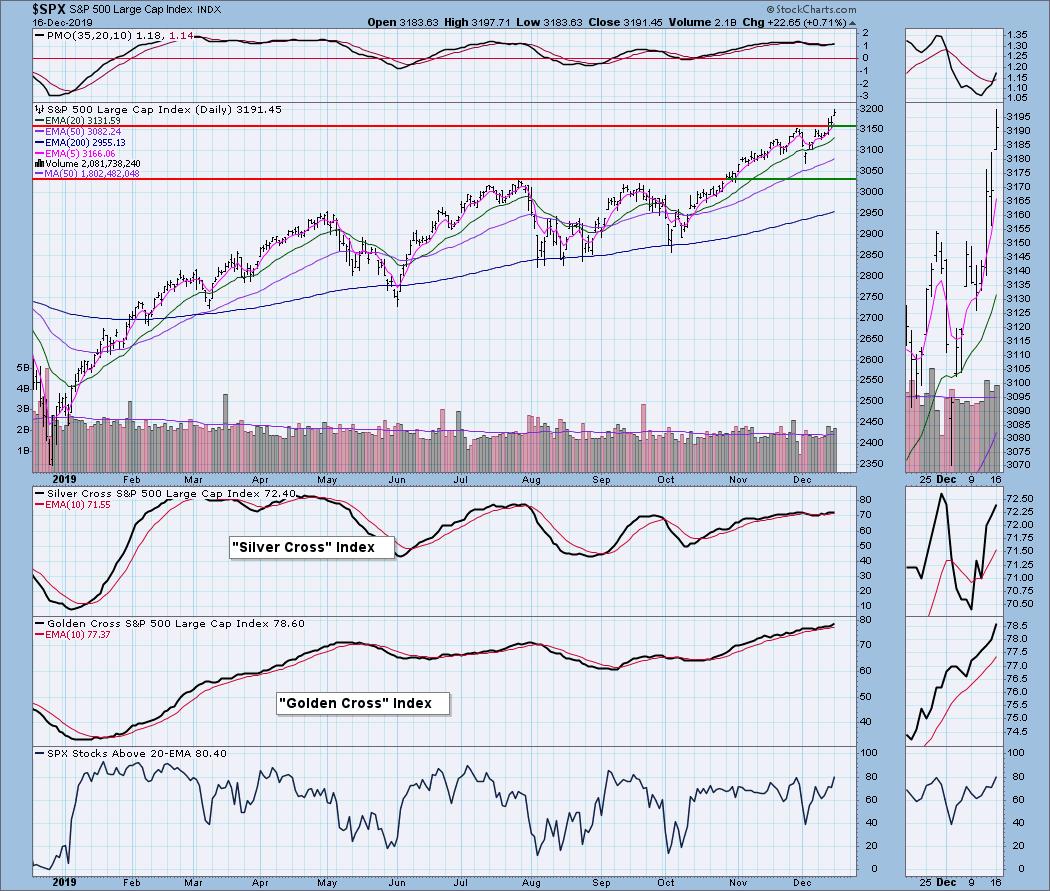
Market Environment: It is important to consider the odds for success. The Silver Cross Index measures the percentage of stocks on IT Trend Model BUY signals (20-EMA > 50-EMA), while the Golden Cross Index measures the percentage of stocks on LT Trend Model BUY signals (50-EMA > 200-EMA). Here are the current percentages on the Silver and Golden Cross Indexes:
Diamond Index:
- Diamond Scan Results: 31
- Diamond Dog Scan Results: 9
- Diamond Bull/Bear Ratio: 3.44
GOGO Inc (GOGO) - Earnings: 2/19 - 2/24/2020
A double-bottom has formed on GOGO right along support at the October low. The OBV is mostly trending up and the SCTR is improving. If the double-bottom executes with a breakout above the confirmation line, the expected upside target would be right at overhead resistance at the November top.
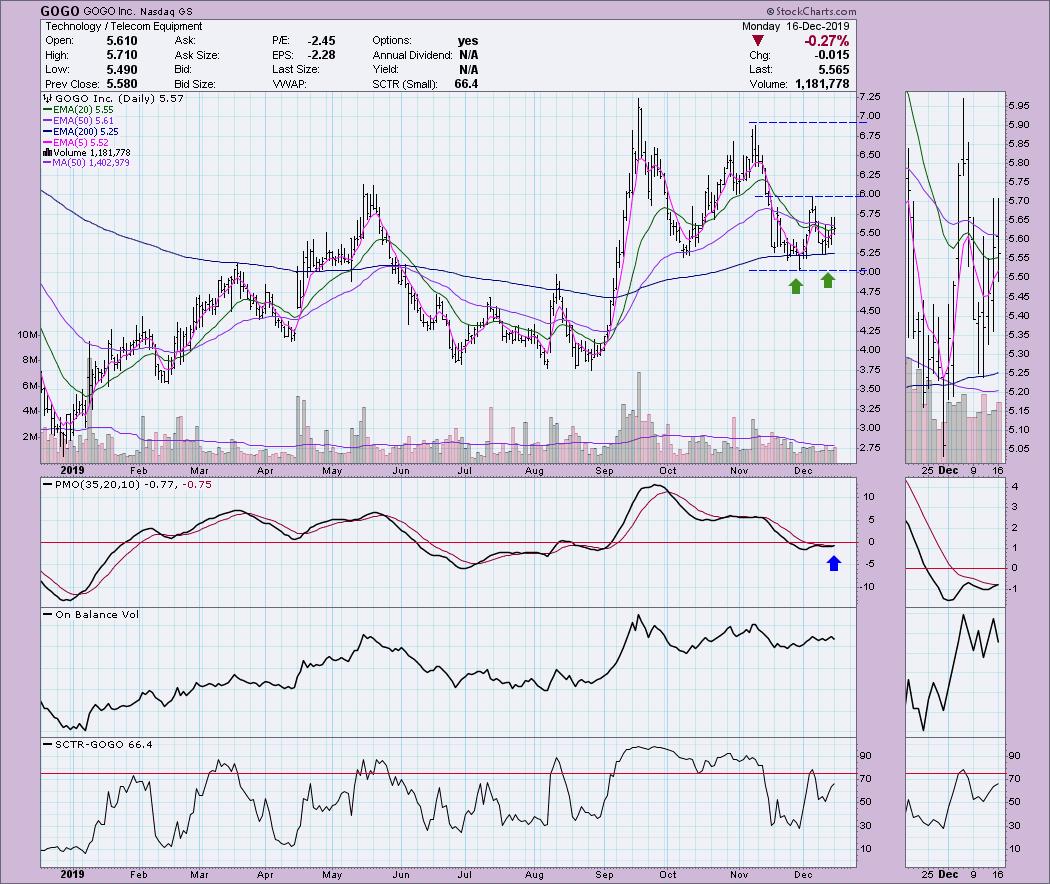
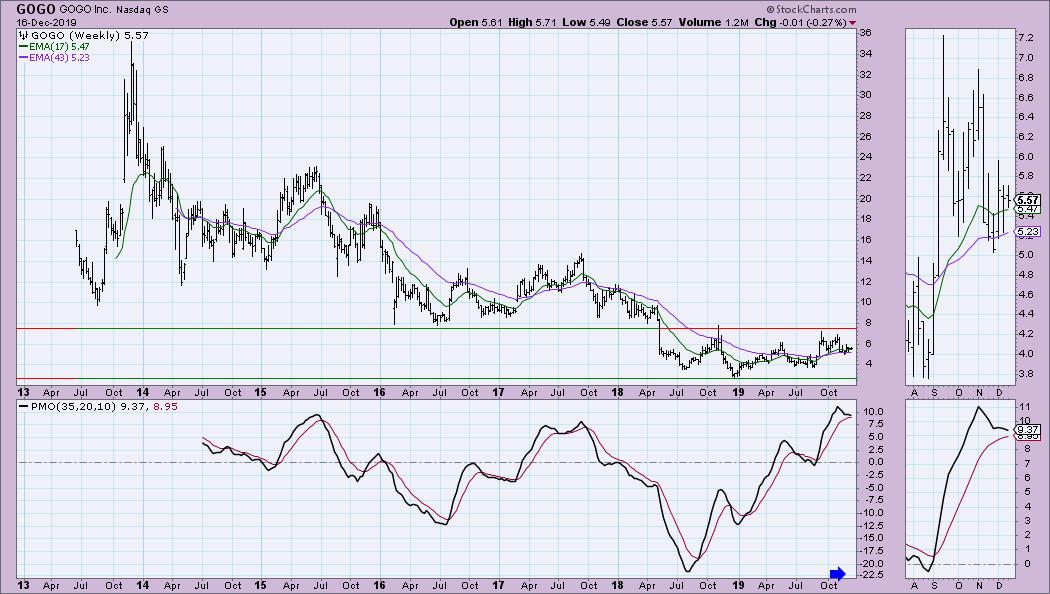
While GOGO looks good on the daily chart, it is showing a topping PMO that is still on a BUY signal. I note that the bottom of the PMO range is about -22.5, this tells me that the PMO is not that overbought with a reading of 9.37. Overhead resistance is going to be tough to penetrate at around the $8 mark.
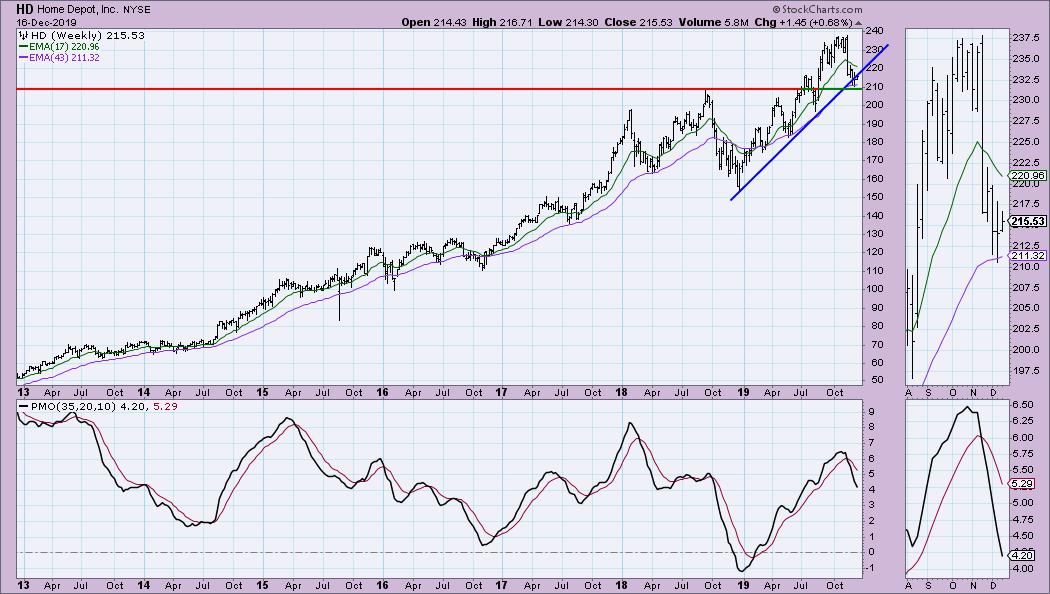
Home Depot Inc (HD) - Earnings: 2/25/2020
This diamond actually came from my "Momentum Sleepers" scan. I am looking at this one for a possible BUY this week. We have a very short-term bullish falling wedge that is in the process of executing. I believe that $220 could pose a problem given the October low at that price. I very much like the positive divergence between the OBV bottoms and price bottoms.
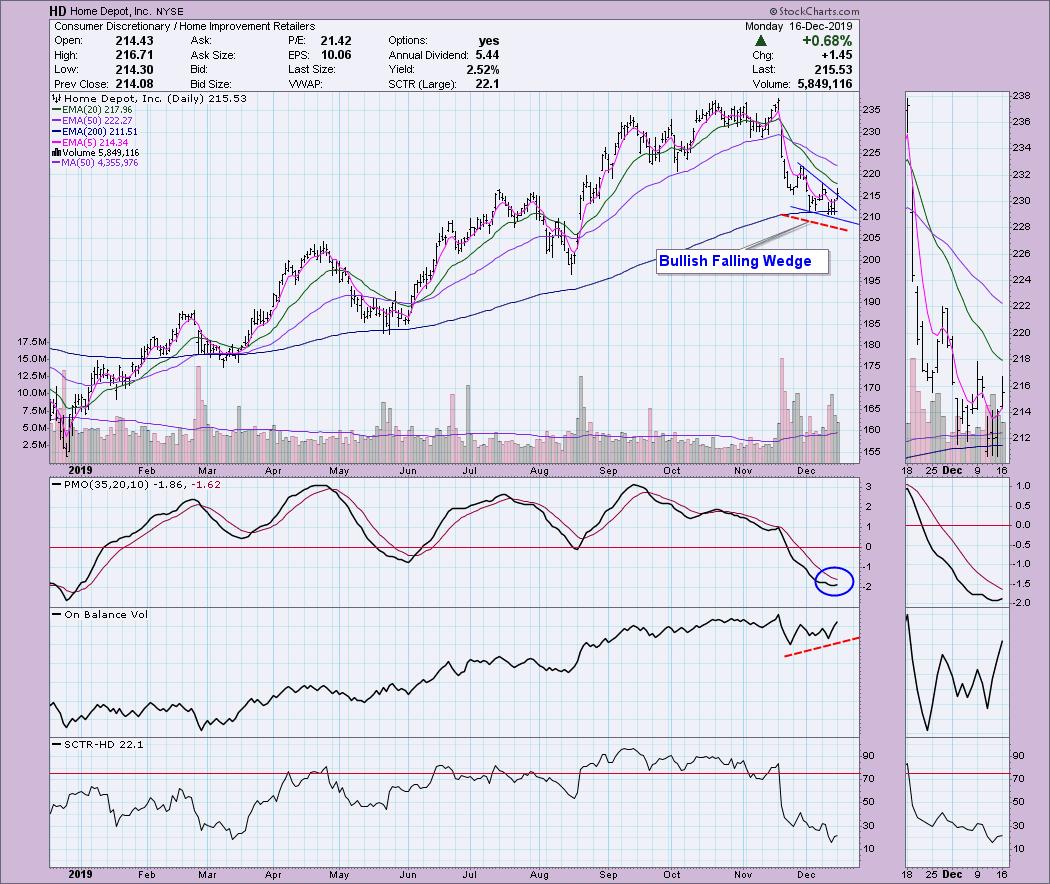
While the intermediate-term rising bottoms trend line was broken, price is trying to bounce off the 2018 high. The weekly PMO is a problem, which is why I will be watching this one closely should I get in this week.
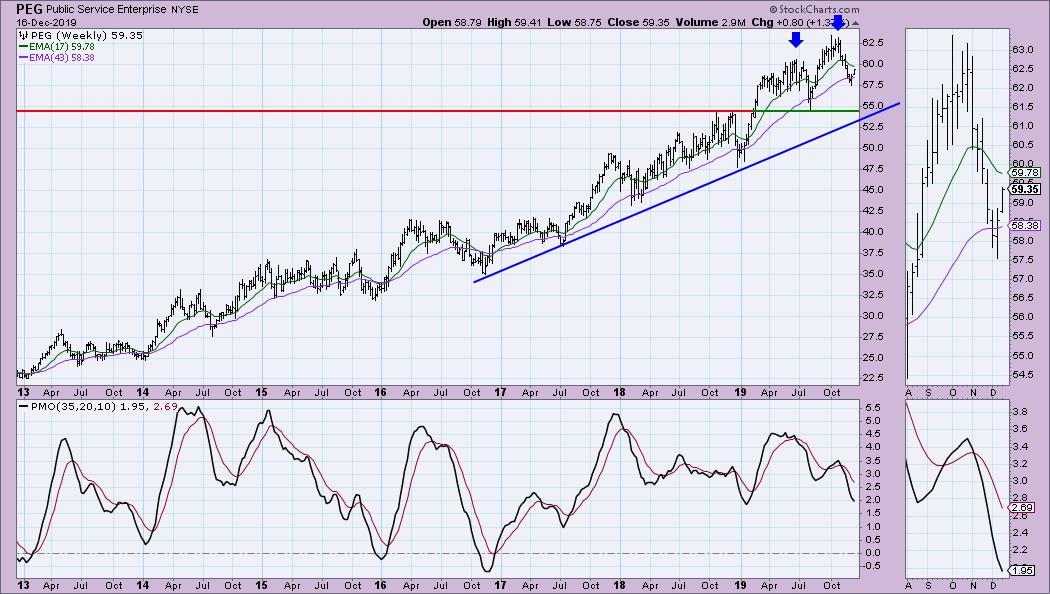
Public Service Enterprise Inc (PEG) - Earnings: 2/25 - 3/2/2020
Price broke out from a steep declining trend today. The PMO is about to trigger a crossover BUY signal. OBV is trending higher along with price; we are also starting to see improvement in the SCTR.
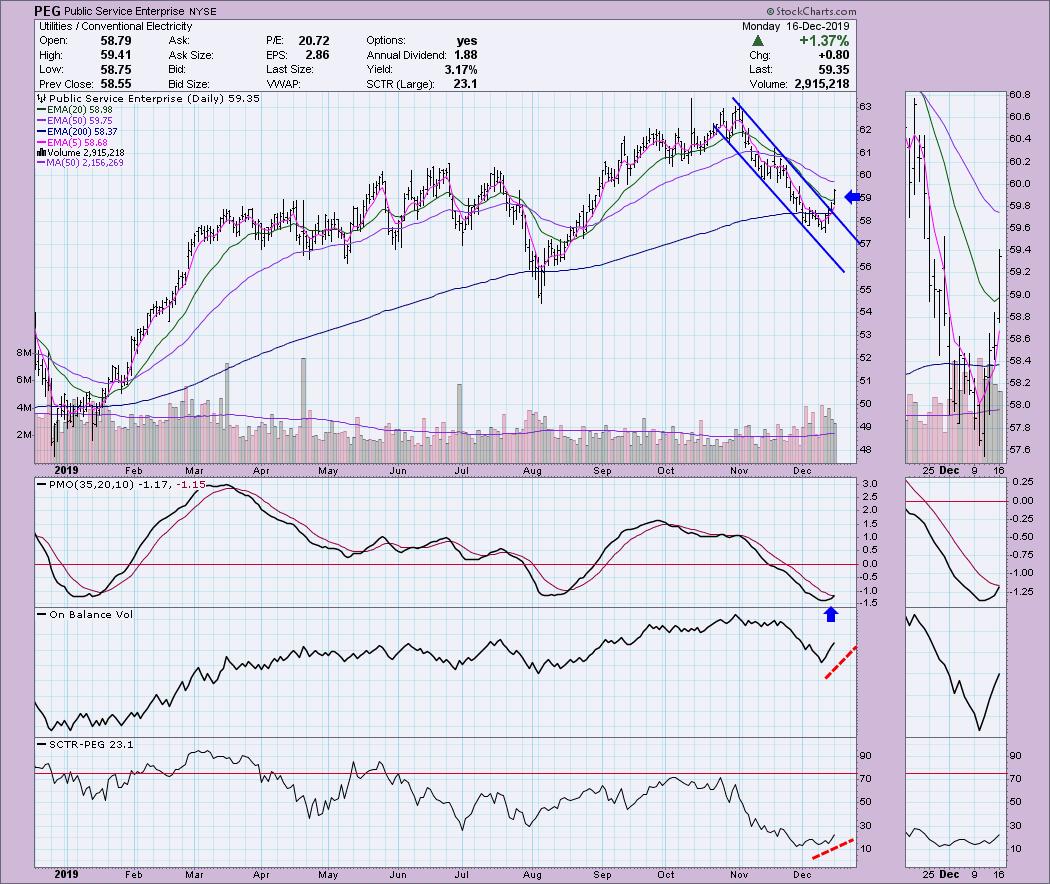
The weekly chart on this one is a little troublesome. I think you could make a case for a double-top, but ultimately I would look at $55 as being the strong area of support. The PMO is trying to decelerate and could bottom in the next few weeks.
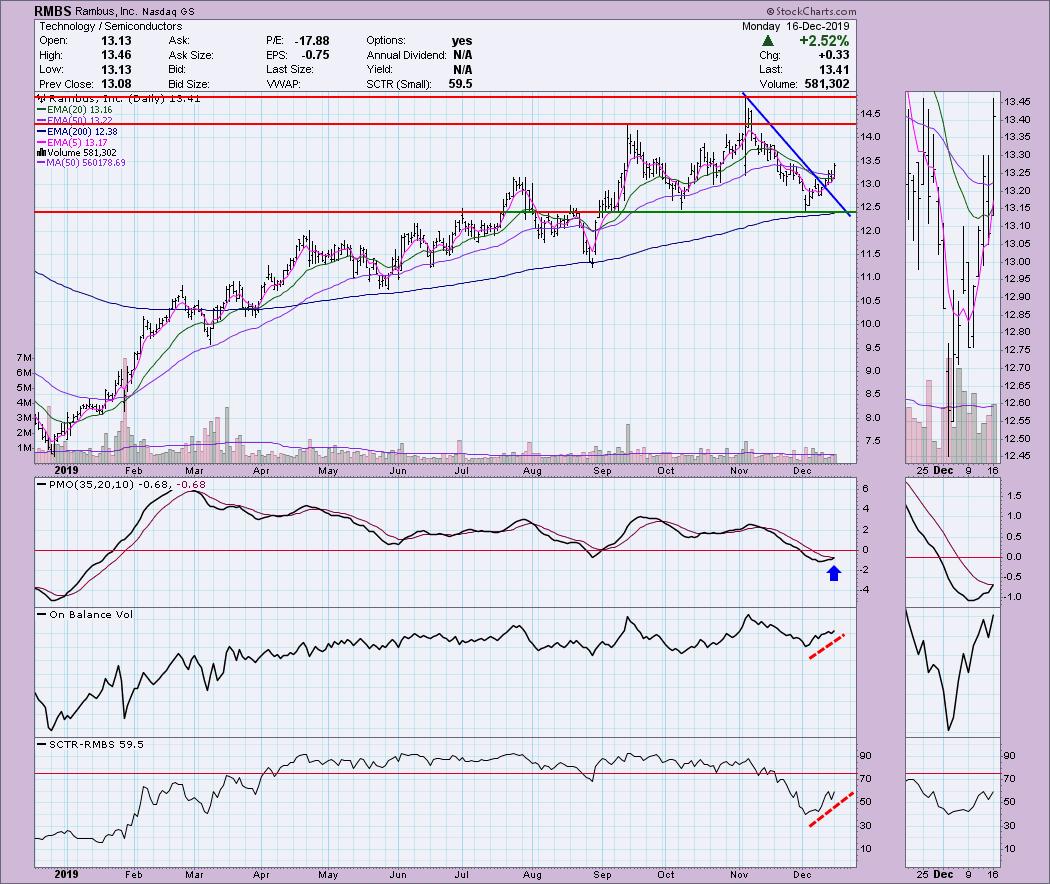
Rambus Inc (RMBS) - Earnings: 1/27 - 1/31/2020
RMBS has broken out from a declining trend and managed to find support right on the October low. The PMO will generate a BUY signal tomorrow. The OBV and SCTR are confirming this breakout.
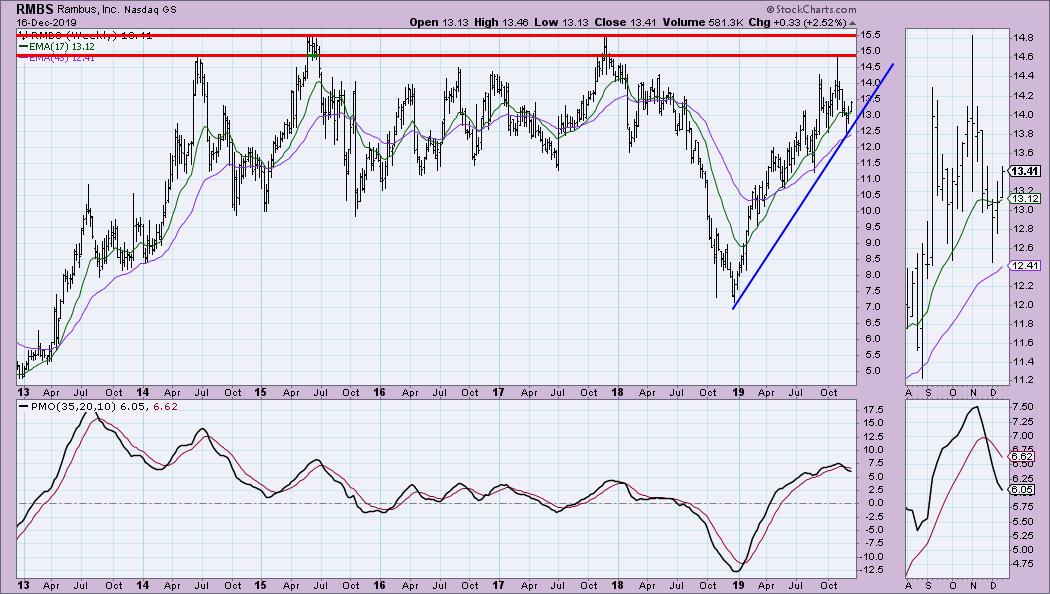
A rising trend is continuing and, although the PMO has topped, it is beginning to decelerate. Overhead resistance doesn't really hit until about $15. $15.50 is the strongest area of resistance.
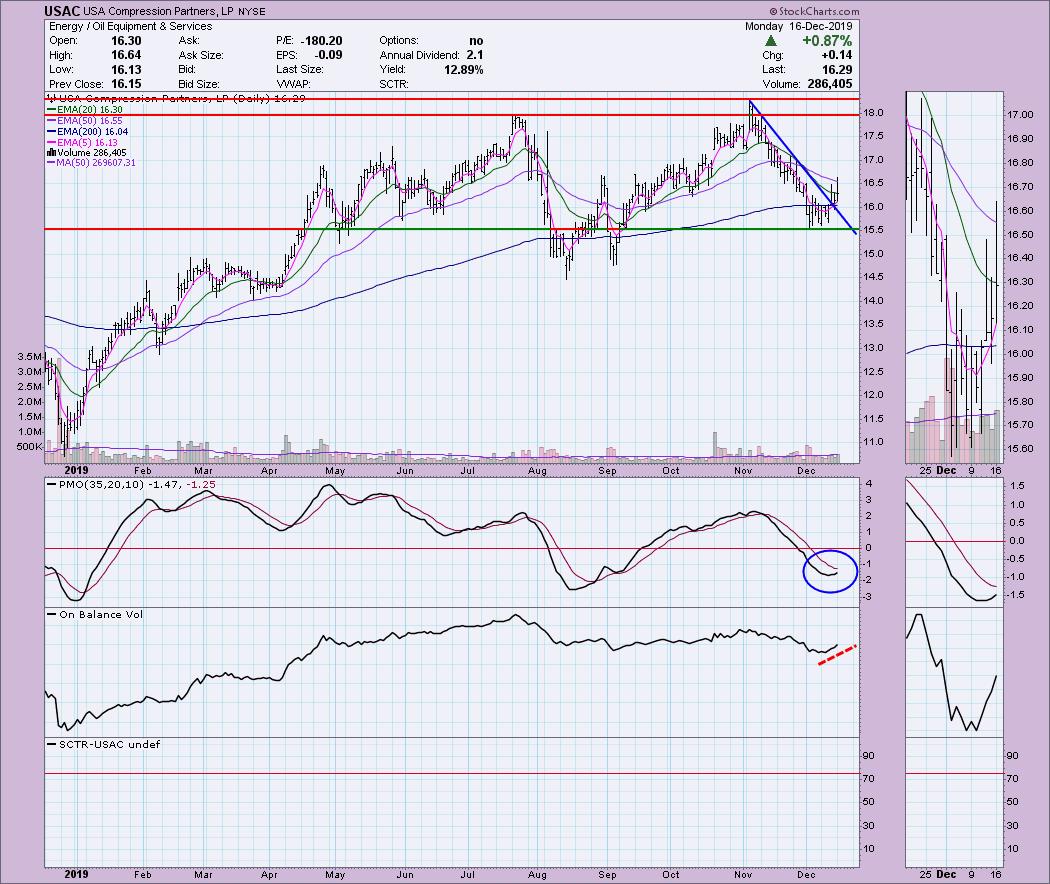
USA Compression Partners LP (USAC) - Earnings: 2/17 - 2/21/2020
Here we have another breakout from a declining trend. The PMO has scooped up nicely. The OBV is confirming the new rising trend. We don't calculate the SCTR for USAC at this time.
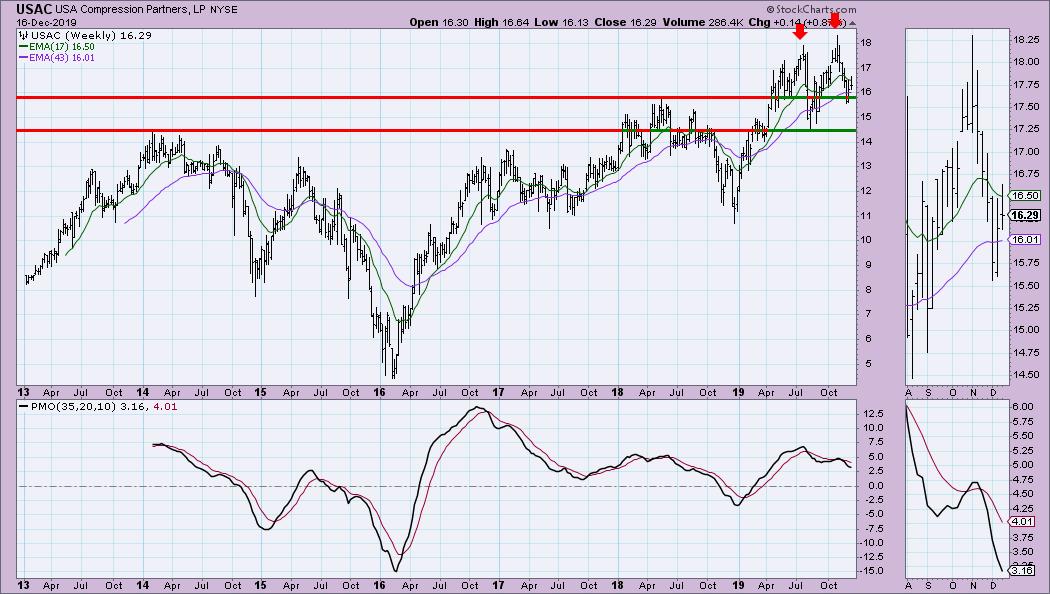
The weekly picture isn't that bullish. I do a double-top formation, but notice that price just bounced off support at the 2018 top. I don't think we will see a move back down that would break that support. The PMO is on a SELL signal, but I suspect we will deceleration after this week in possible anticipation of a bottom.
Full Disclosure: I do not own any of the stocks presented, but I have to say that many of these are on my watchlist for adding. It is going to be time for me to re-enter cautiously this week. I am 80% cash.
Market Vision 2020 - Sign Up for Details
I am so excited to participate in "Market Vision 2020", an online financial conference on Saturday, January 4, 2020 to kick off the new year. Make sure you're subscribed to the Market Vision 2020 newsletter in order to receive the latest updates on the event (and save a lot of money if you decide to attend!). *Click Here* to subscribe to the free newsletter. There will be lots of giveaways and free educational events for everyone who follows along – don't be left out!

Erin Swenlin will be presenting at the The MoneyShow Las Vegas on May 11-13, 2020! You'll have an opportunity to meet Erin and discuss the latest DecisionPoint news and Diamond Scans. The conference is free to attend or view online!
Watch the latest episode of DecisionPoint with Carl & Erin Swenlin LIVE on Mondays 5:00p EST or on the StockCharts TV YouTube channel here!
Technical Analysis is a windsock, not a crystal ball.
Happy Charting!
- Erin
erinh@stockcharts.com
NOTE: The stocks reported herein are from mechanical trading model scans that are based upon moving average relationships, momentum and volume. DecisionPoint analysis is then applied to get five selections from the scans. The selections given should prompt readers to do a chart review using their own analysis process. This letter is not a call for a specific action to buy, sell or short any of the stocks provided. There are NO sure things or guaranteed returns on the daily selection of "diamonds in the rough."
Helpful DecisionPoint Links:
DecisionPoint Shared ChartList and DecisionPoint Chart Gallery
Price Momentum Oscillator (PMO)
Swenlin Trading Oscillators (STO-B and STO-V)
**Don't miss DecisionPoint Commentary! Add your email below to be notified of new updates"**


