This will be the last free issue of the DecisionPoint ALERT. Last fall StockCharts.com changed its business model regarding our free content, and Erin and I need to embrace the subscription model if we are to continue doing what we do. Our new DecisionPoint.com website launched yesterday, and we invite you to become subscribers to the DecisionPoint Alert, where we analyze the market trend and condition, and DecisionPoint Diamonds, where Erin scans for stocks that will ride that tide. The DecisionPoint Alert will be a daily publication, with me writing the DP Alert Weekly Wrap on Fridays, and Erin working the beat the rest of the week. Erin will write the DecisionPoint Diamonds, to identify opportunities presenting themselves, about three days weekly.
To clarify, we will still be providing free content to StockCharts.com, but not in the quantity we previously did.
Everything old is new again? Our long-time readers will remember the old decisionpoint.com website where we published for many years, and the new site will again feature our commentary and analysis. Many thanks to StockCharts.com for developing and hosting our new website, and for getting us launched into our new enterprise.
We invite you to look us over and consider becoming a subscriber. For a limited time we are offering discounts for charter subscriptions.Click here!
Now, let's get on with the analyzing.
The DecisionPoint Alert Weekly Wrap presents an end-of-week assessment of the trend and condition of the stock market (S&P 500), the U.S. Dollar, Gold, Crude Oil, and Bonds.
Watch the latest episode of DecisionPoint on StockCharts TV's YouTube channel here!
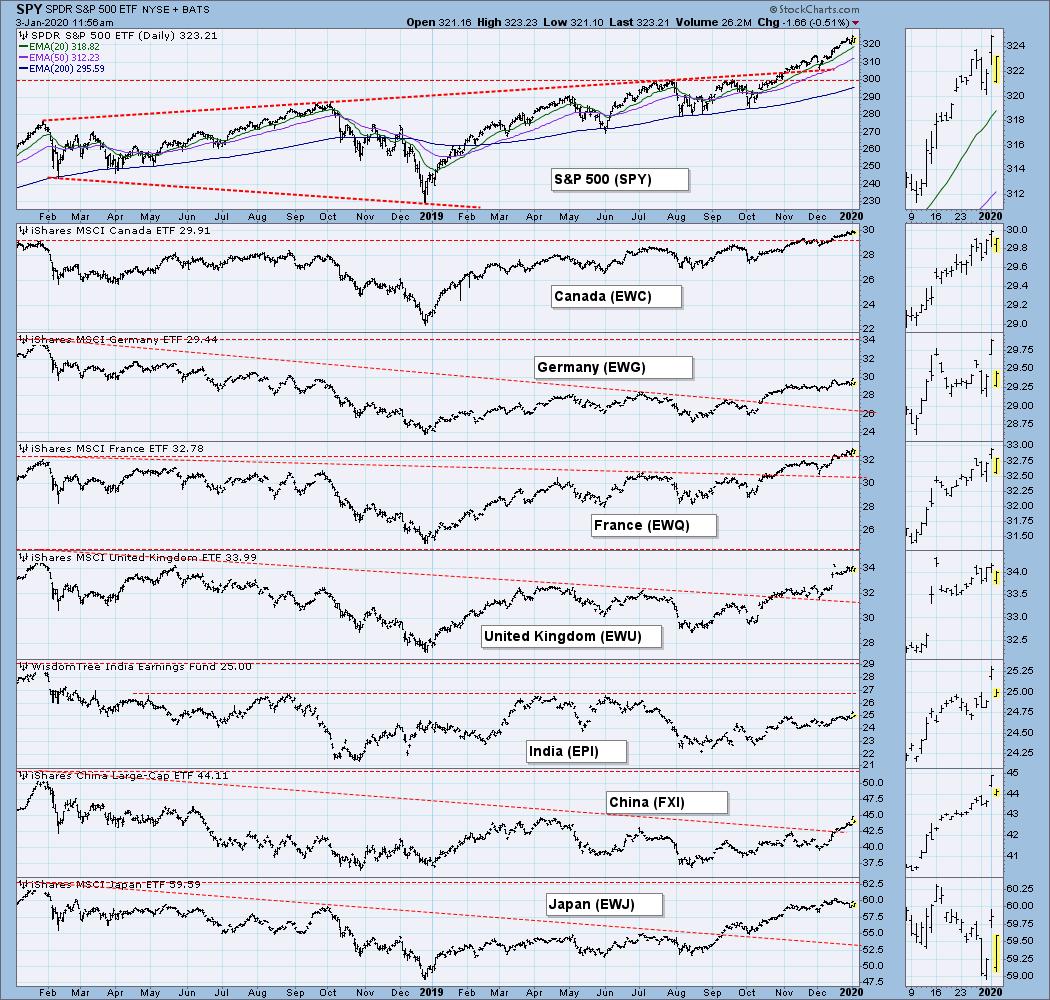
GLOBAL MARKETS
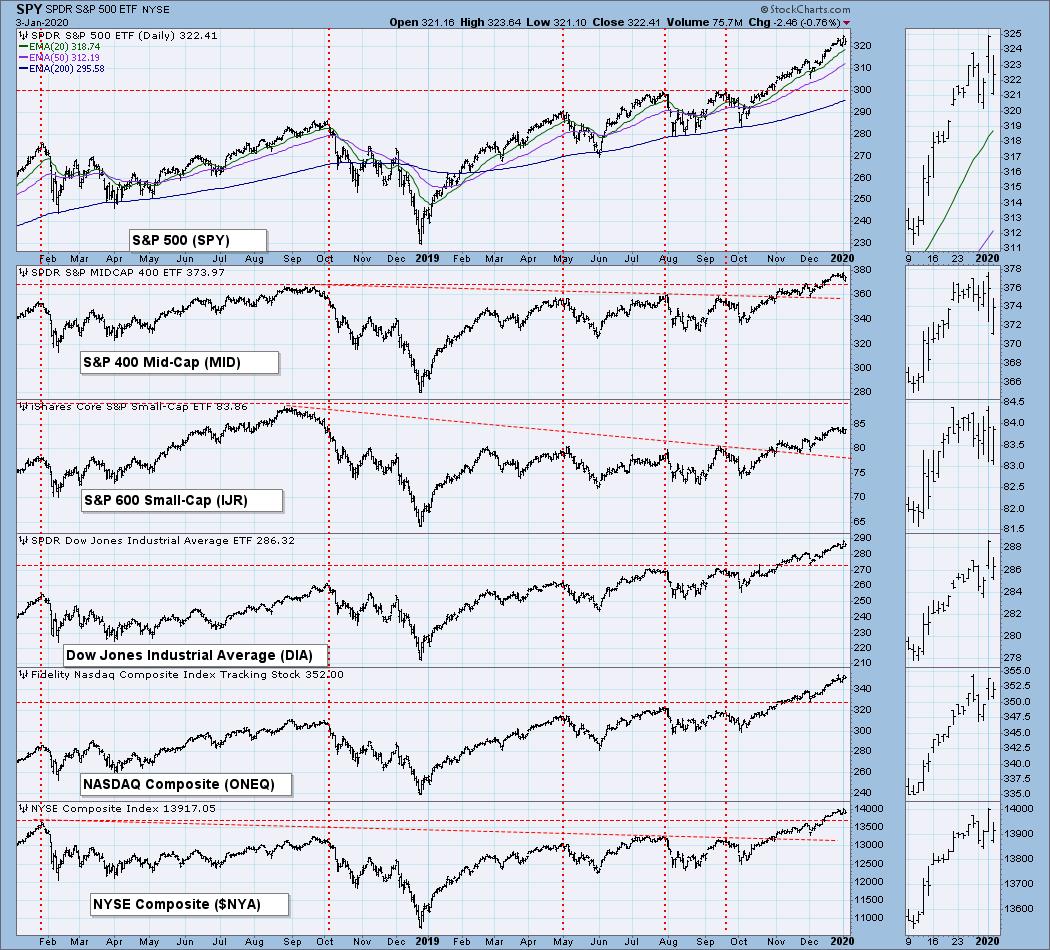
BROAD MARKET INDEXES
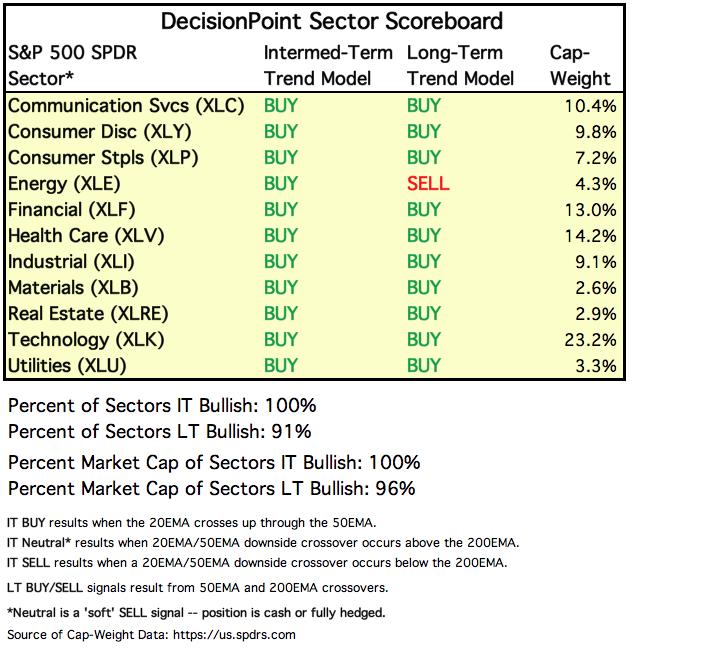
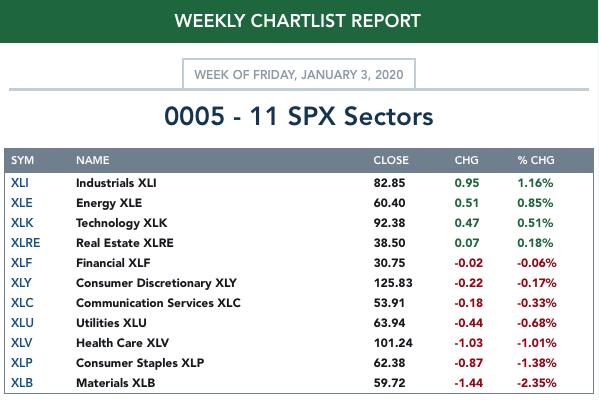
SECTORS
Each S&P 500 Index component stock is assigned to one, and only one, of 11 major sectors. This is a snapshot of the Intermediate-Term (Silver Cross) and Long-Term (Golden Cross) Trend Model signal status for those sectors.
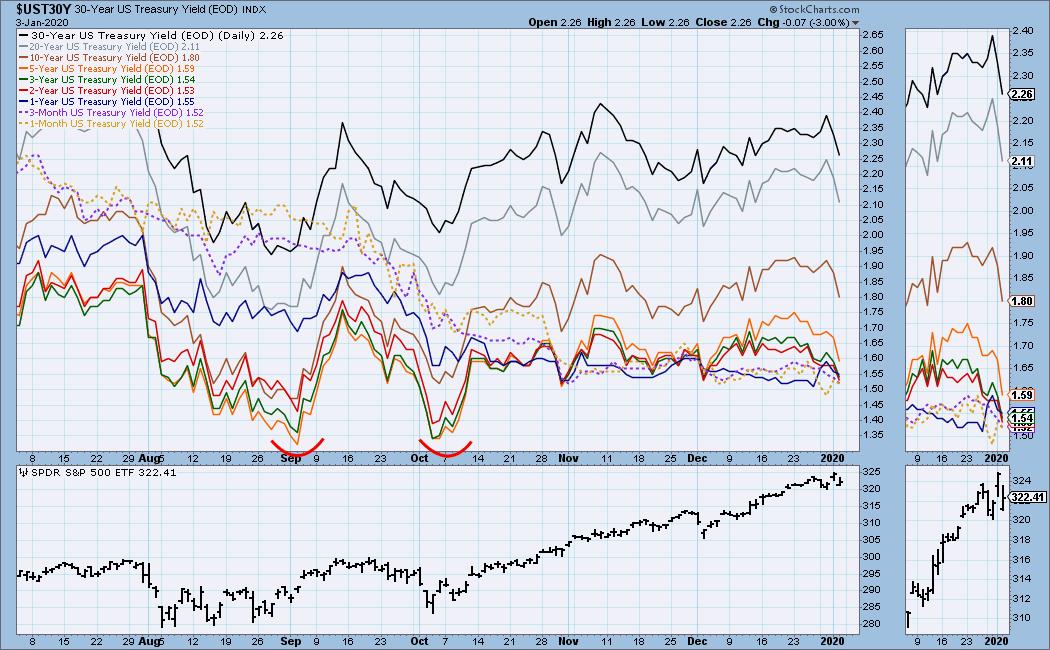
INTEREST RATES
This chart is included so we can monitor rate inversions. In normal circumstances the longer money is borrowed the higher the interest rate that must be paid. When rates are inverted, the reverse is true.
STOCKS
IT Trend Model: BUY as of 9/6/2019
LT Trend Model: BUY as of 2/26/2019
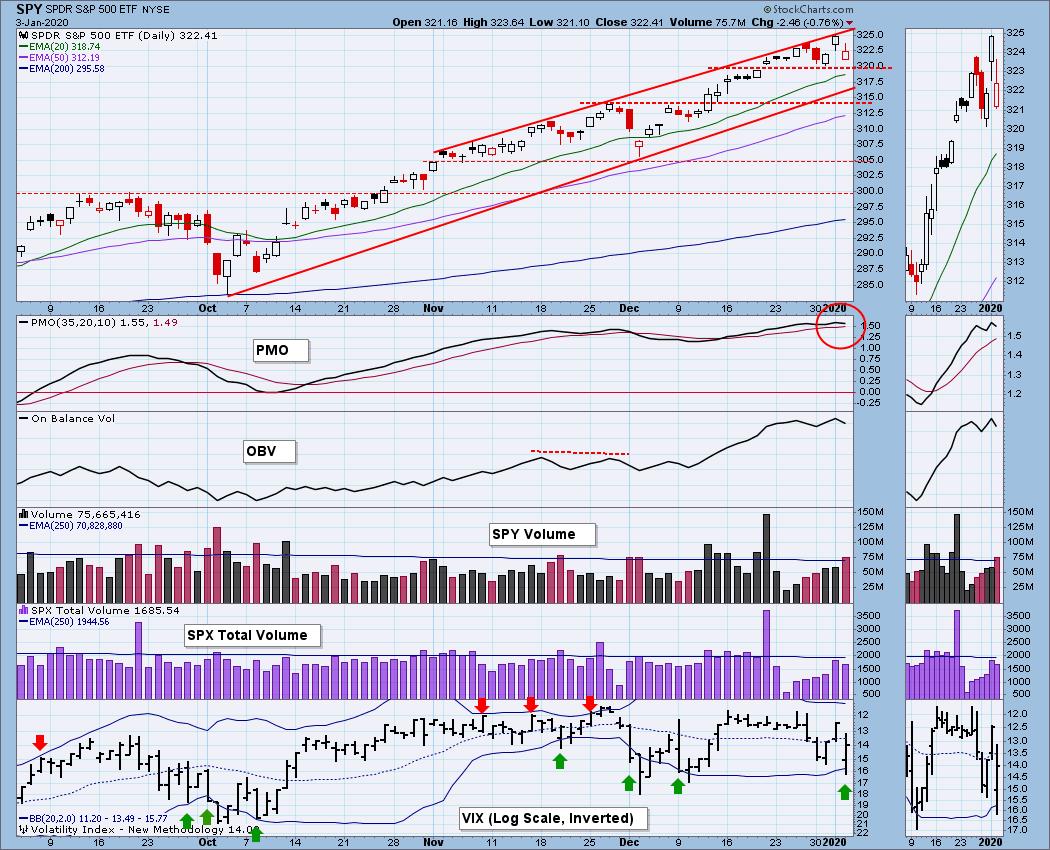
SPY Daily Chart: It was kind of choppy for a holiday week, but the net change for the week was less than one percent, and the range was less than two percent. A surge to new highs on Thursday was followed by some selling on Friday due to the air strike in Iraq which killed a high-level terrorist. The market recovered from the Friday lows but still closed down. Frankly, the small loss was probably due to internal pressures, not the military action.
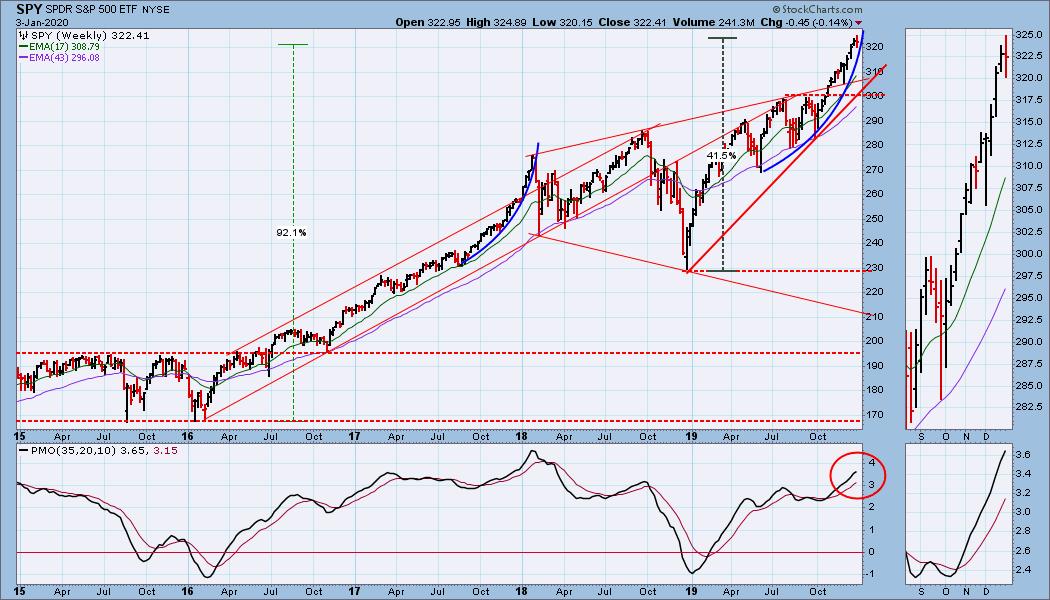
SPY Weekly Chart: I'm still coaxing a current parabolic advance, but it is not yet as severe as we saw in early-2018. And I see some similarity with the move to the mid-2018 price top, but steeper.
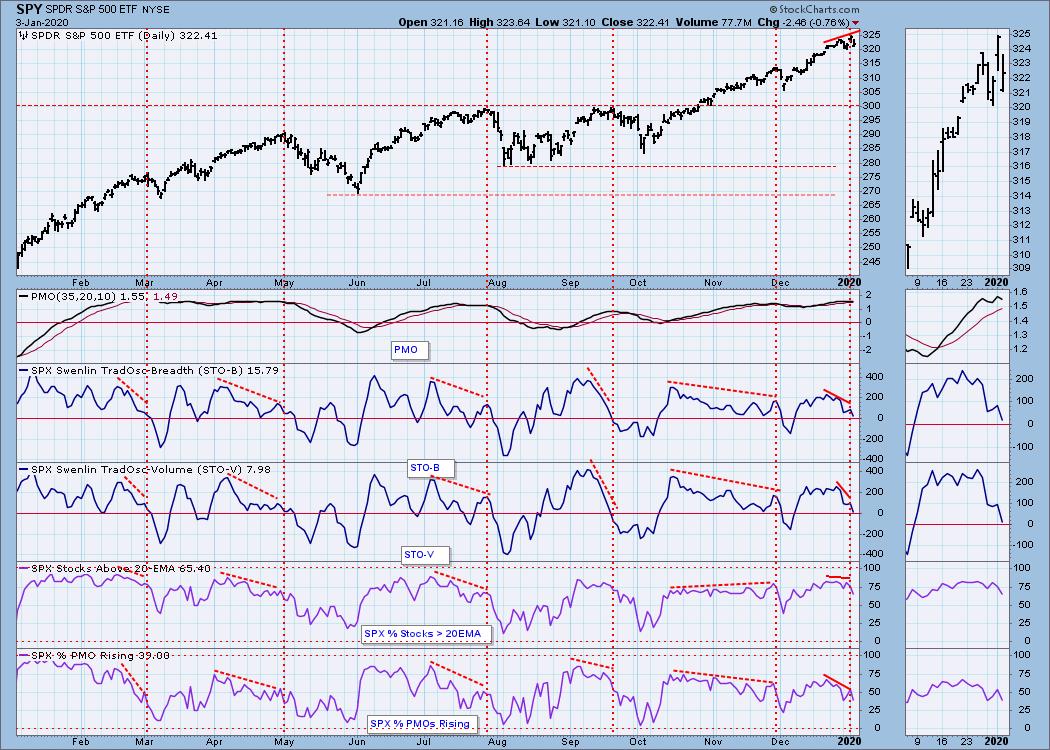
Climactic Market Indicators: There were no climactic days this week, but the VIX penetrated the lower Bollinger Band, which is a BUY signal in the very short term.
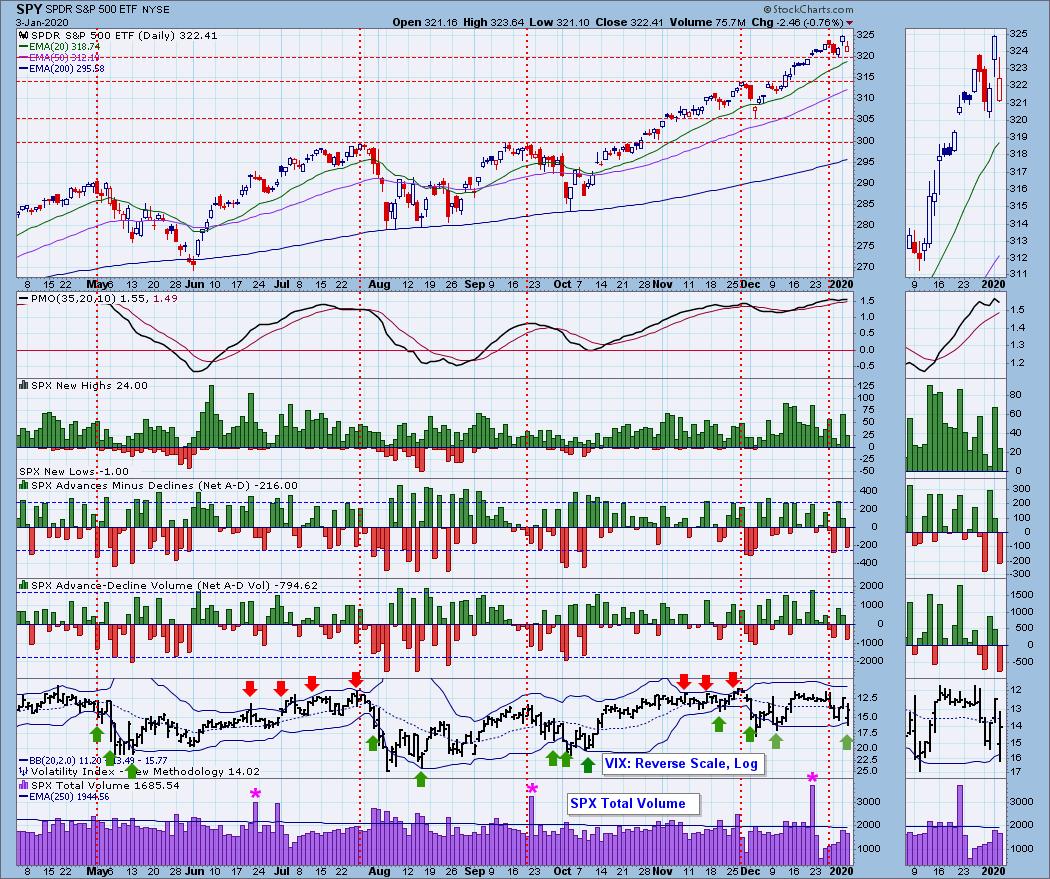
Short-Term Market Indicators: In the last week we can see very short-term negative divergences developing and highlighting underlying weakness in this time frame. For this reason I think Friday's pullback after Thursday's blowoff was justified on strictly technical grounds. News exacerbated the move intraday, but it wasn't necessarily responsible for the entire move.
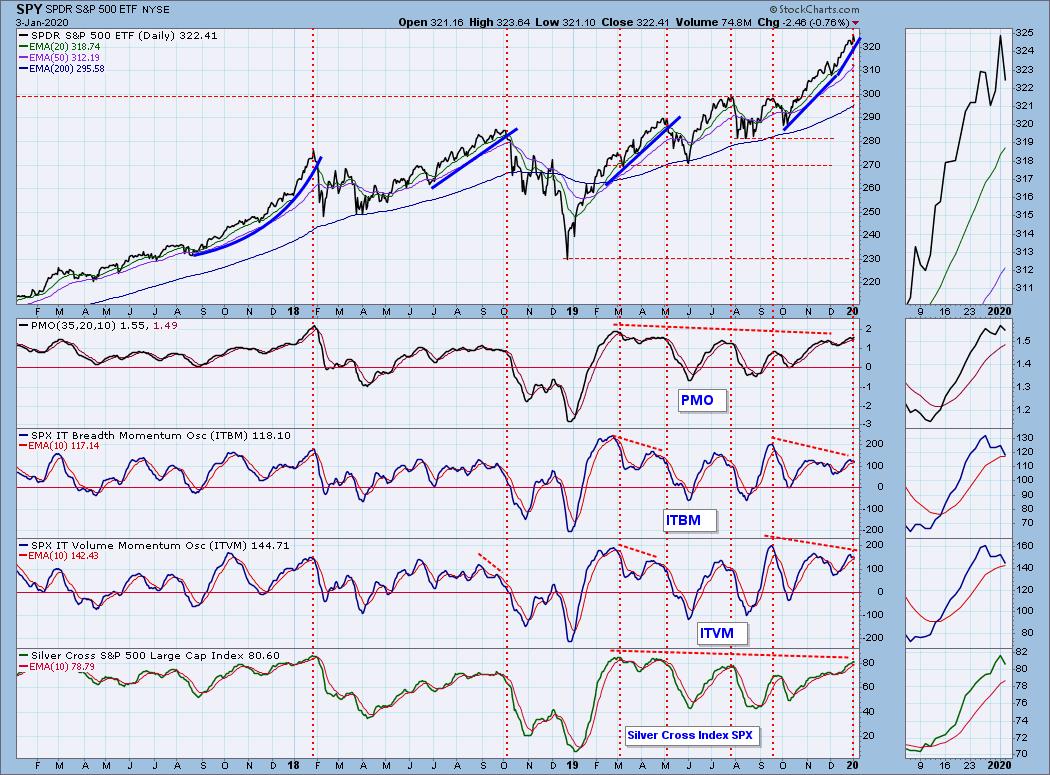
Intermediate-Term Market Indicators: Both the Golden and Silver Cross Indexes are overbought, and they topped today.
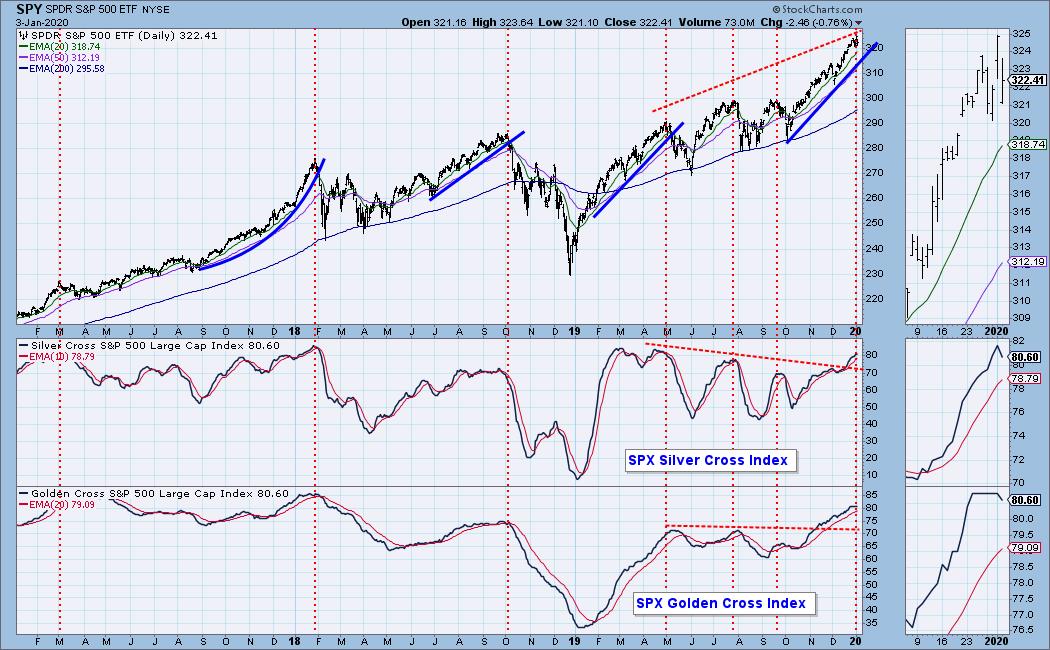
All these indicators are overbought and have topped. Note that the rising trend line drawn from the October low is steeper than the angle of the trend lines to the other important tops shown, with the exception of the 2017/18 parabolic.
CONCLUSION: The trend of the market is UP, and the condition is OVERBOUGHT. Additionally, the angle of ascent from the beginning of December is quite steep and is, in my opinion, not sustainable. Friday's airstrike news was also responsible for positive reactions in gold, crude, and bonds. It remains to be seen just how much current news will affect the markets beyond today. I suspect very little, but we shall see. I continue to have concern about how over-extended the market is technically. A decline of -5% to -10% would alleviate some of the pressure, but the trend has to break first. I keep hearing predictions of a melt up, but that's just shows how extremely bullish sentiment has gotten.
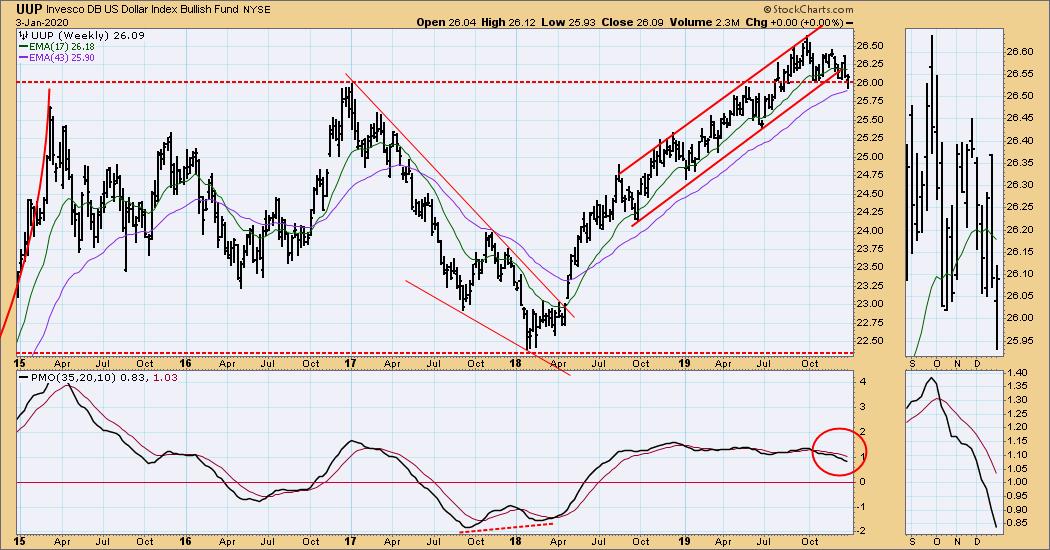
DOLLAR (UUP)
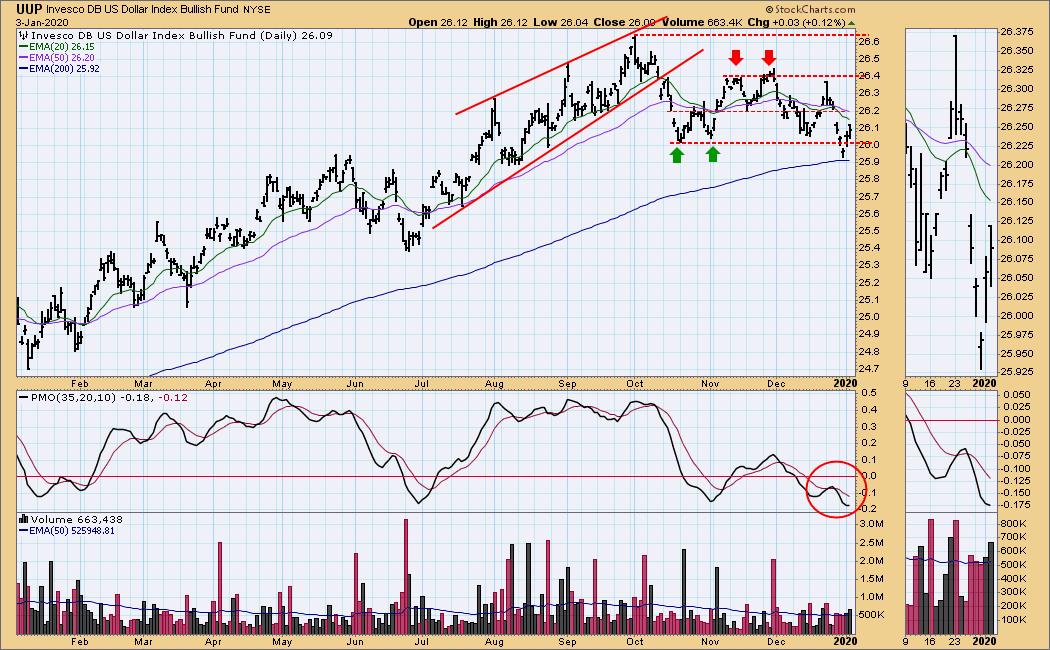
IT Trend Model: NEUTRAL as of 12/11/2019
LT Trend Model: BUY as of 5/25/2018
UUP Daily Chart: UUP continued an advance that began yesterday, but I'm not seeing any news impact hear.
UUP Weekly Chart: UUP is testing the long-term support, but it is holding so far.
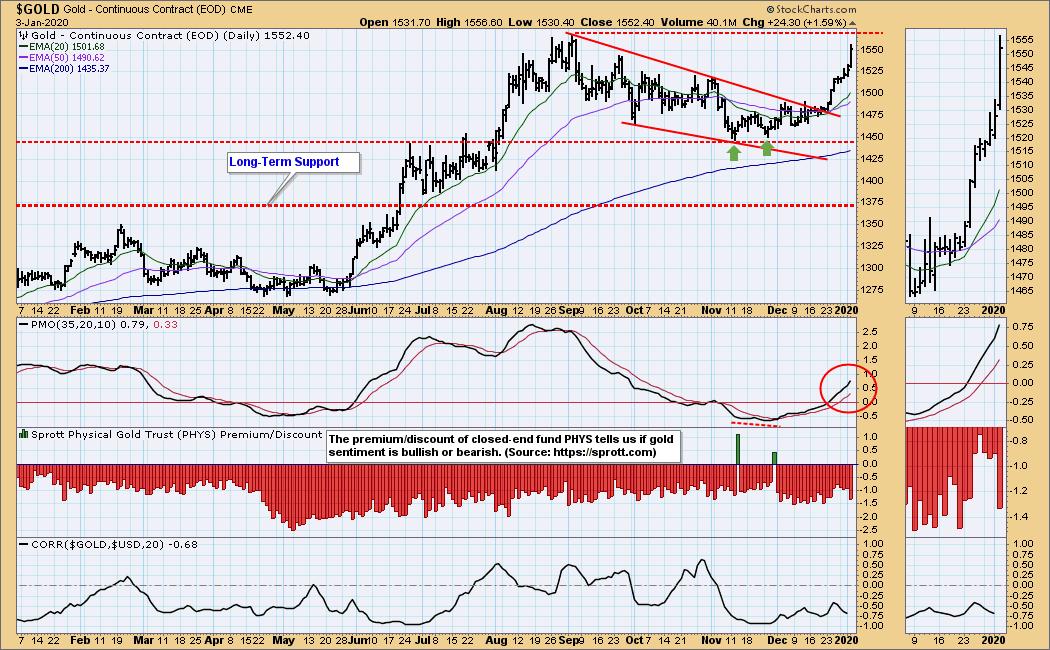
GOLD
IT Trend Model: BUY as of 12/26/2019
LT Trend Model: BUY as of 1/8/2019
GOLD Daily Chart: Gold broke out of the falling wedge two weeks ago, but today's advance was the most enthusiastic one-day move since the breakout.
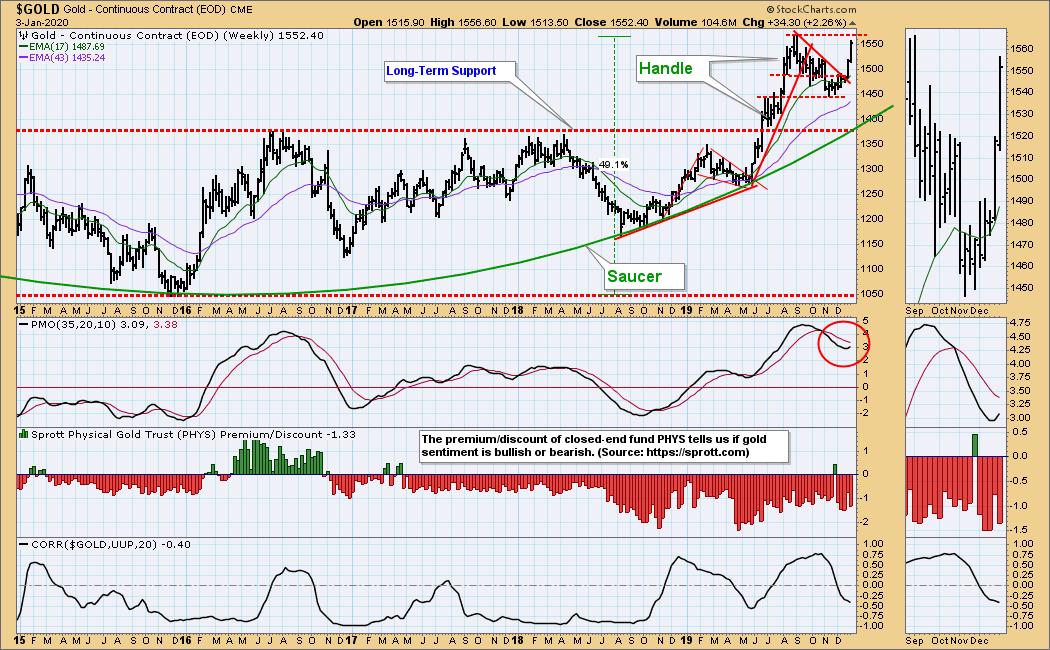
GOLD Weekly Chart: I think we can agree that the handle on the saucer has been completed. Gold is now approaching horizontal resistance drawn across the September top, but the PMO is rising. Other than the fact that the commercials have a large short position on gold, this is a very bullish chart.
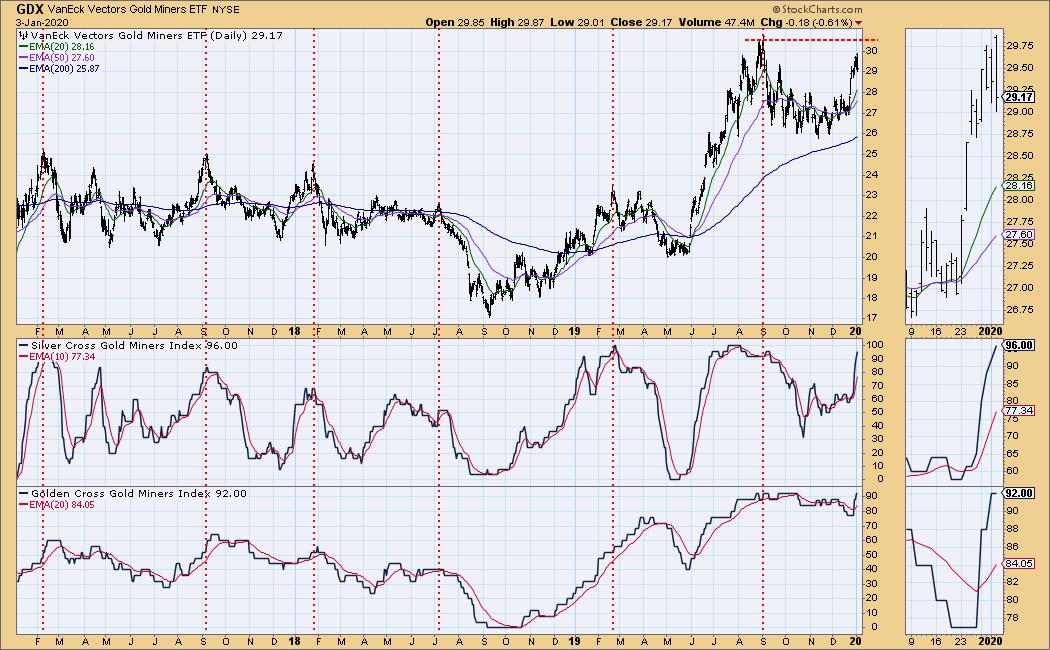
GOLD MINERS Golden and Silver Cross Indexes: GDX is approaching overhead resistance, and the Golden and Silver Cross Indexes are approaching the very top of their ranges. We can see that historically those indexes don't stay at the max readings for very long, so we can expect some GDX pullback.
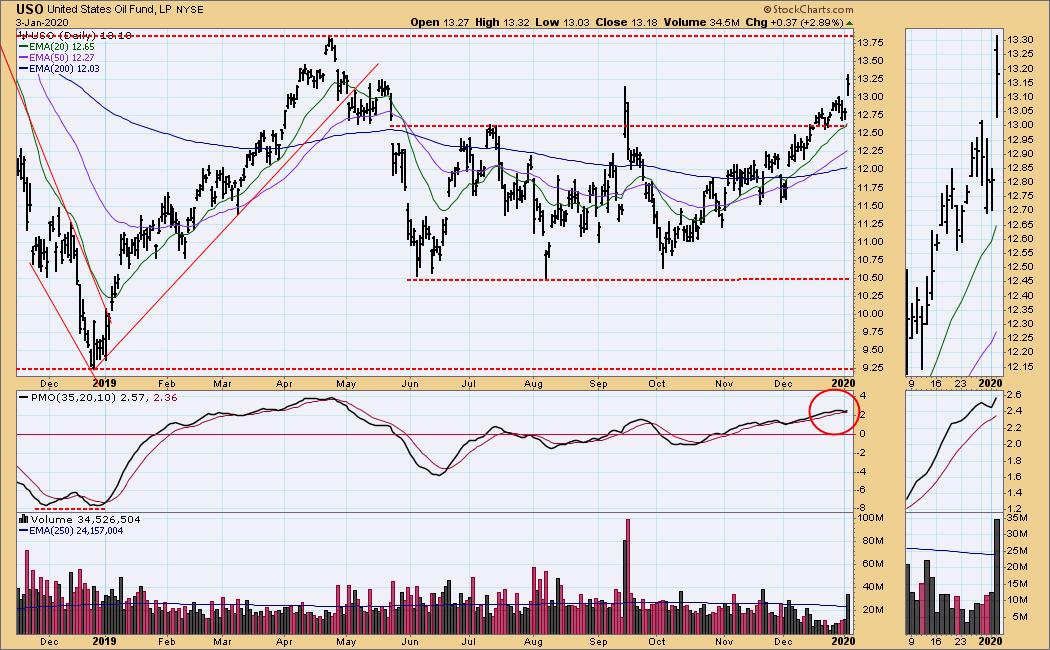
CRUDE OIL (USO)
IT Trend Model: BUY as of 11/6/2019
LT Trend Model: BUY as of 12/16/2019
USO Daily Chart: An advance of nearly +3% today is not surprising in consideration of the news, notice that price closed well off the day's highs.
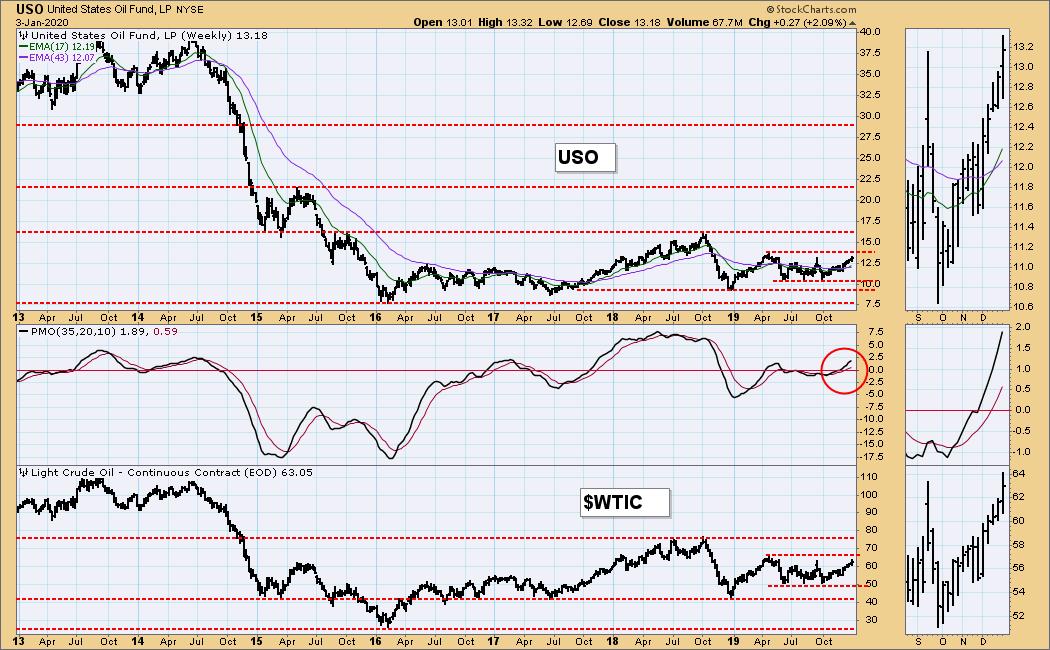
USO Weekly Chart: In spite of today's price jump, WTIC remains within the 42 to 76 trading range, which I expect to hold.
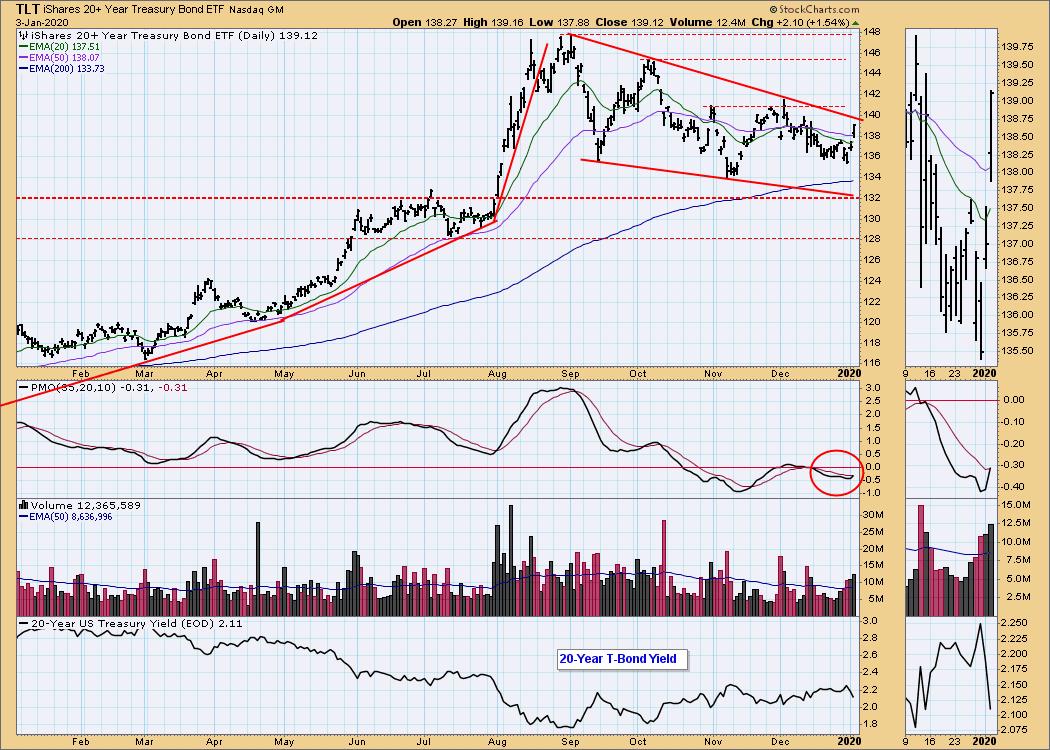
BONDS (TLT)
IT Trend Model: NEUTRAL as of 12/12/2019
LT Trend Model: BUY as of 1/2/2019
TLT Daily Chart: A flight to safety gave bonds a boost today. Ultimately, I expect TLT to break out of the falling wedge formation, but the resistance at 148 shouldn't be penetrated without some news.
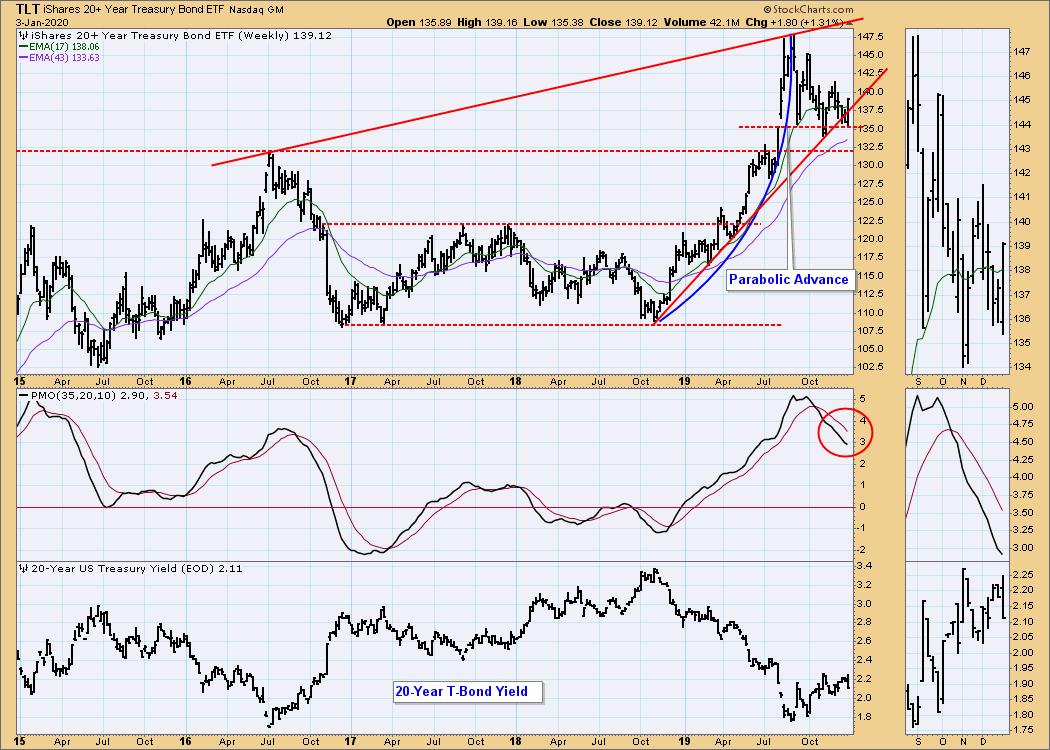
TLT Weekly Chart: TLT got back above the rising trend line, but more important the horizontal support has held.
**Don't miss any of the DecisionPoint commentaries! Go to the "Notify Me" box toward the end of this blog page to be notified as soon as they are published.**
Technical Analysis is a windsock, not a crystal ball.
Happy Charting! - Carl
NOTE: The signal status reported herein is based upon mechanical trading model signals, specifically, the DecisionPoint Trend Model. They define the implied bias of the price index based upon moving average relationships, but they do not necessarily call for a specific action. They are information flags that should prompt chart review. Further, they do not call for continuous buying or selling during the life of the signal. For example, a BUY signal will probably (but not necessarily) return the best results if action is taken soon after the signal is generated. Additional opportunities for buying may be found as price zigzags higher, but the trader must look for optimum entry points. Conversely, exit points to preserve gains (or minimize losses) may be evident before the model mechanically closes the signal.
Helpful DecisionPoint Links:
DecisionPoint Shared ChartList and DecisionPoint Chart Gallery
Price Momentum Oscillator (PMO)
Swenlin Trading Oscillators (STO-B and STO-V)
AP


