As I sat in the jury room today waiting for my panel to be called, I watched from my phone the crazy market action. It just figured I'd be stuck there without my giant display screen to decipher charts. Since Carl's article today was called "We Were Warned," I decided today's DP Alert would be "Part II," as I'm going to show you a plethora of negative divergence warnings that we have been harping about to our subscribers.
We've decided to post today's DP Alert in the free area given the "unexpected" pullback today. Neither Carl nor I expected the voracity or percentage decline, but we did expect lower prices given all of the negative divergences showing up on our indicator charts. Our subscribers had already been "alerted" of the possible danger ahead.
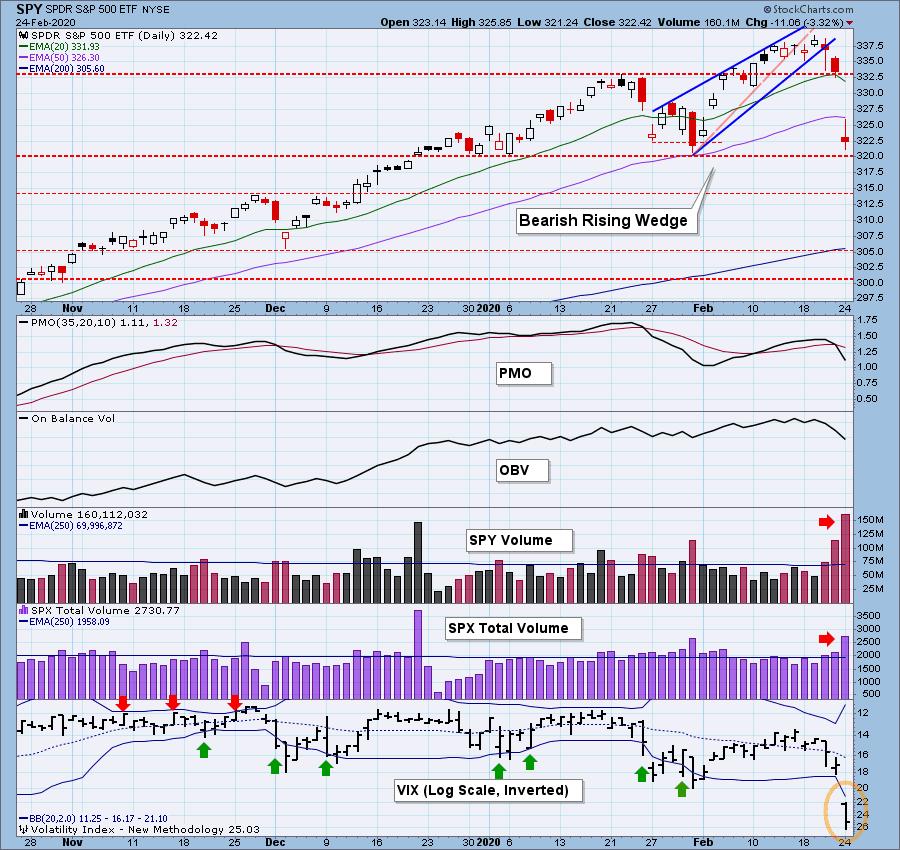
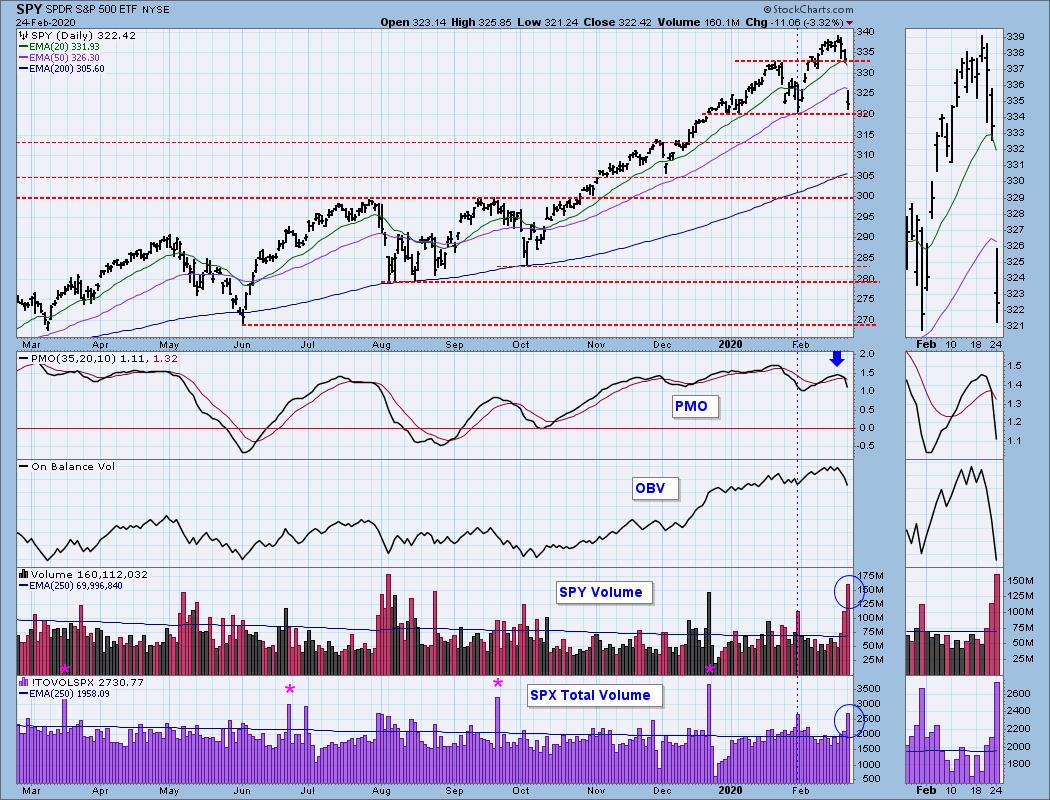
The 4-month candlestick chart below is one we have been watching closely as the short-term bearish rising wedge executed on Friday. I had been looking for a decline to about 320-325 on the SPY, but not all in one day! This does seem an area where we could find strong support, especially given the VIX bar, which was outside of the Bollinger Bands all day.
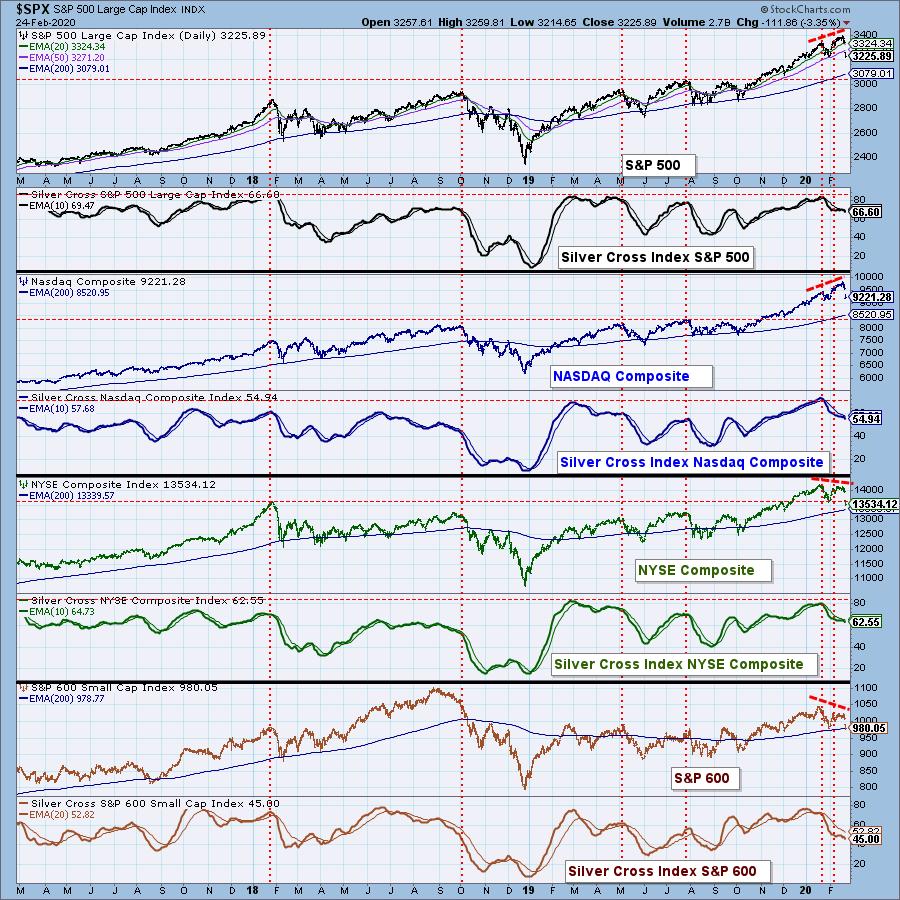
Notice the negative divergences on the NYSE and S&P 600 in comparison to the tech-heavy NASDAQ and broad SPX. This has been bothering me for some time.
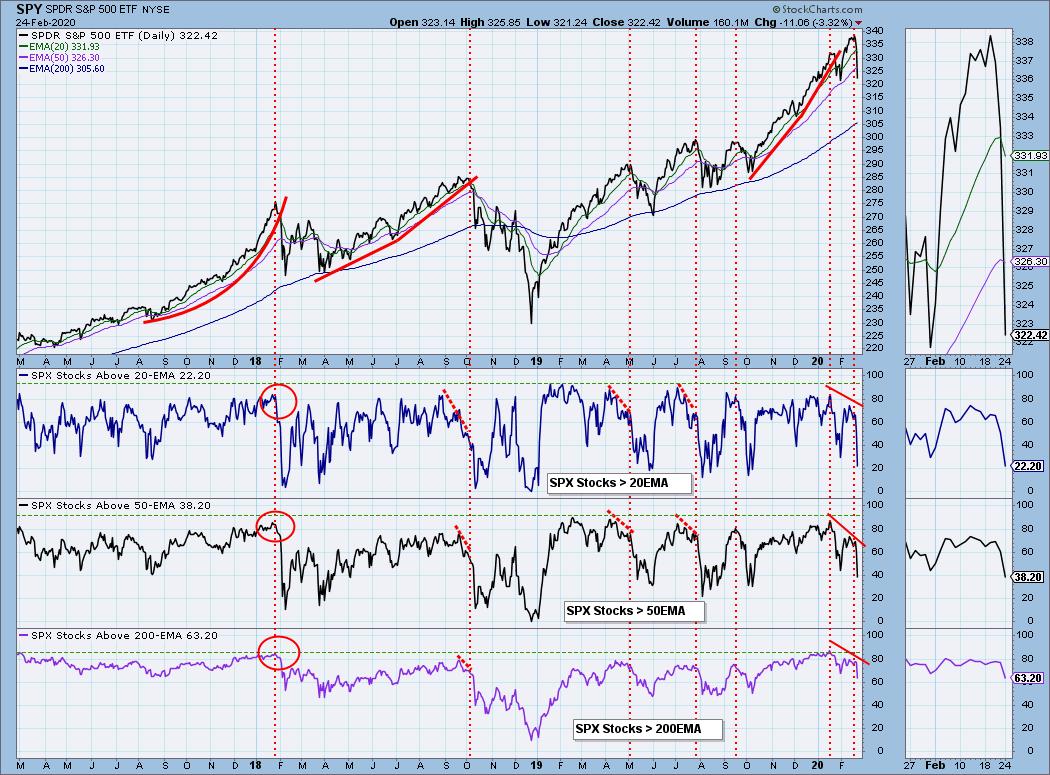
Even before today's drop, we were watching new all-time highs being set while, at the same time, components in the index were losing support at their 20/50/200-EMAs. I wrote on 2/6 and on 2/10 how the "big guys" were running up the market without their brethren.
Onto our daily rundown....
TODAY'S Broad Market Action:
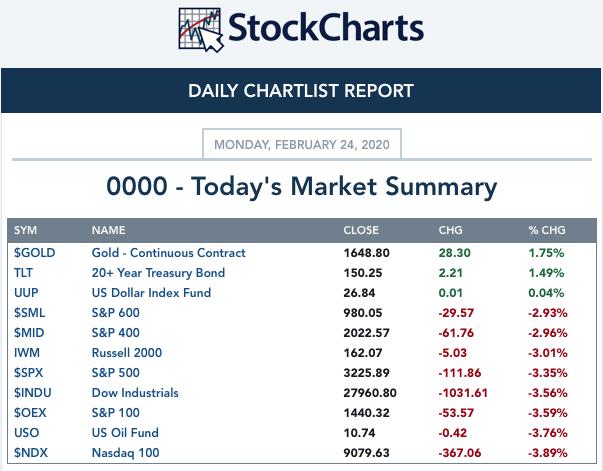
Top 10 from ETF Tracker:
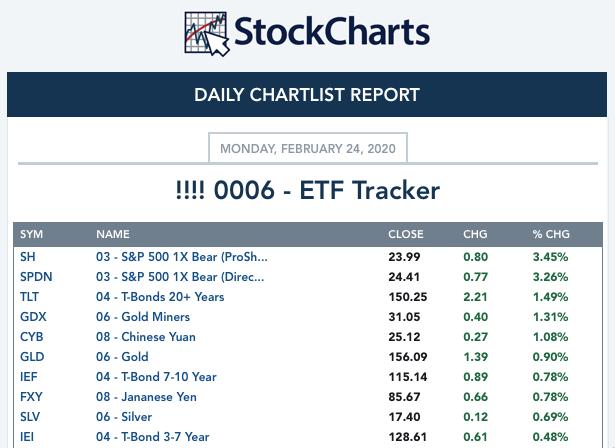
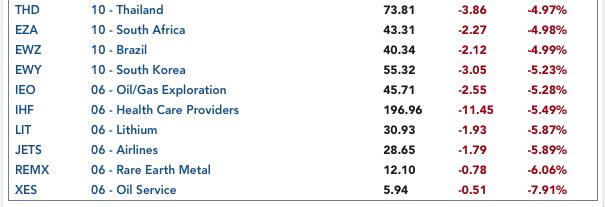
Bottom 10 from ETF Tracker:
On Friday, the DecisionPoint Alert Weekly Wrap presents an assessment of the trend and condition of the stock market (S&P 500), the U.S. Dollar, Gold, Crude Oil and Bonds. Monday through Thursday, the DecisionPoint Alert daily report is abbreviated and covers changes for the day.
Watch the latest episode of DecisionPoint on StockCharts TV's YouTube channel here!
SECTORS
SIGNALS:
Each S&P 500 Index component stock is assigned to one, and only one, of eleven major sectors. This is a snapshot of the Intermediate-Term (Silver Cross) and Long-Term (Golden Cross) Trend Model signal status for those sectors.
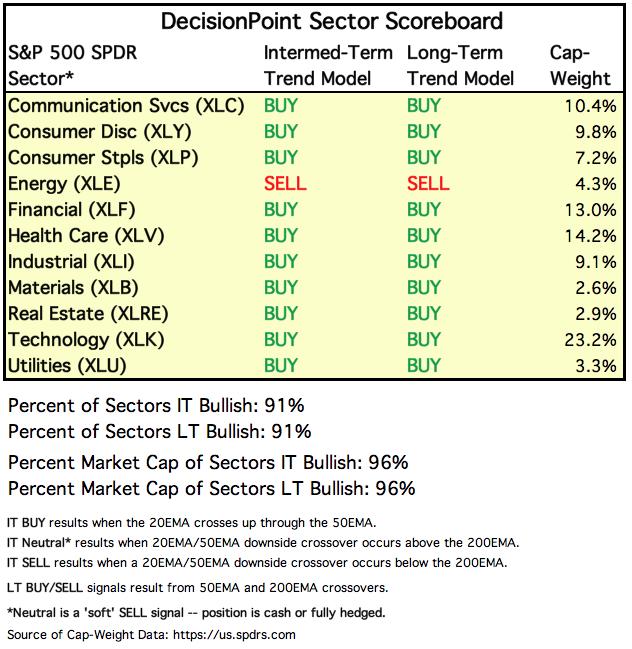
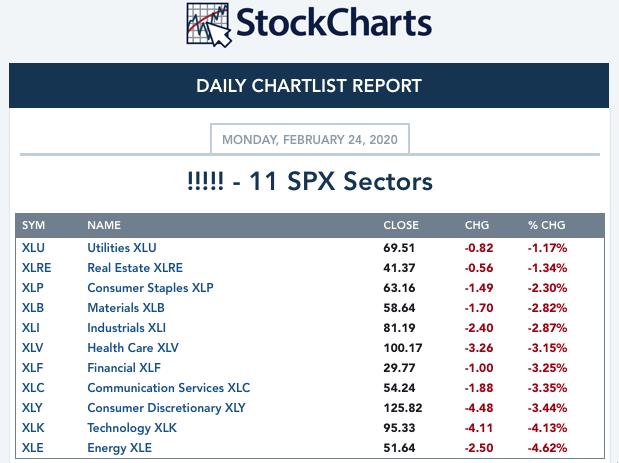
TODAY'S RESULTS:
STOCKS
IT Trend Model: BUY as of 9/6/2019
LT Trend Model: BUY as of 2/26/2019
SPY Daily Chart: As you may have noticed above, there were no "winning" sectors today, only a least-terrible at the top. Notice the three "top" sectors were defensive groups. I have been leaning toward Utilities in some of my recent Diamonds Reports (I present five "diamonds in the rough" Tue/Wed/Thur for our subscribers). The drop was severe today and it took many of our indicators down with it. Volume today was climactic. I marked the last time we saw this amount of volume and it came at a price bottom. The question becomes whether we have a selling exhaustion or selling initiation. Let's look at the indicators.
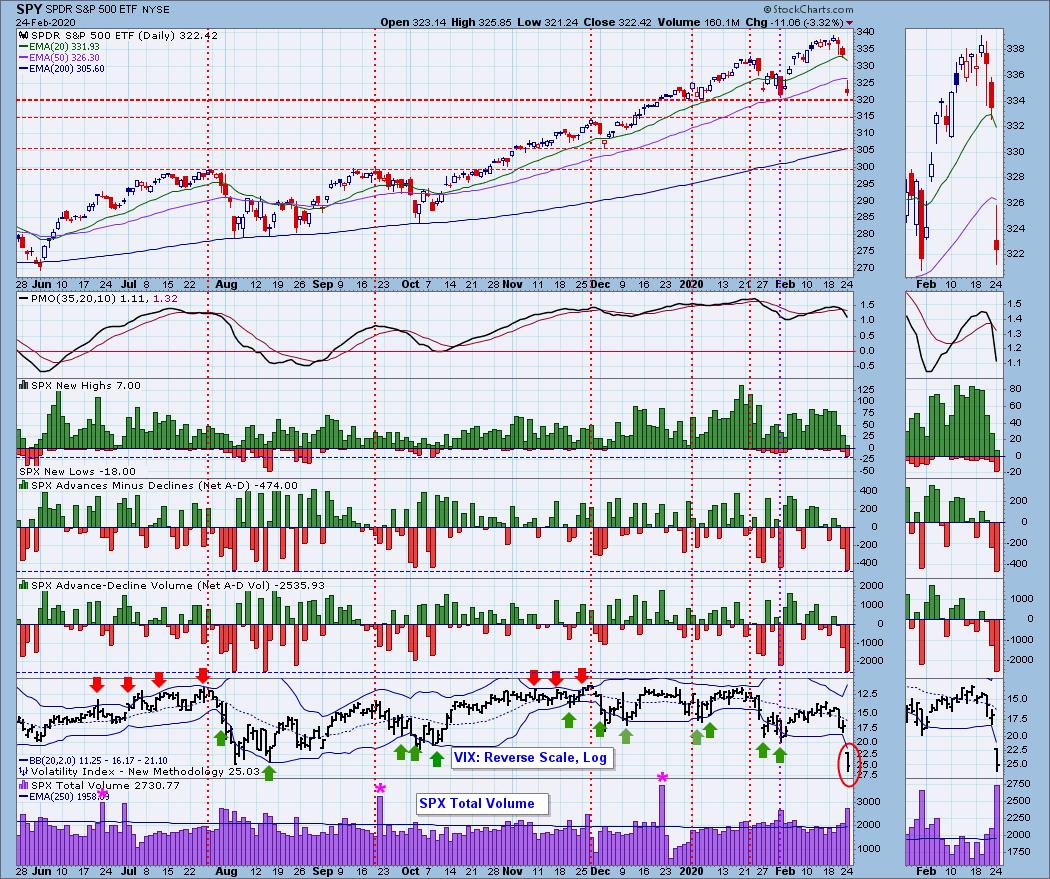
Climactic Market Indicators: Most definitely, we have climactic readings to discuss today. Breadth readings haven't been this high (to the low side) since August of last year. Readers of the DP Alert can tell you that I have been looking at August as a possible scenario when the VIX Bollinger Bands were squeezing last month. That should give you an idea of what I believe is ahead. Yes, these are extreme to the downside; I suspect we will see a bounce off 320 because of that. However, like August, I think we are in for a rocky ride sideways at best. In August, we didn't have the specter of the coronavirus, so price could fall further. Should this area of support not hold, I'd look for a drop to the 200-EMA, as we saw in August and October. There is support at 315, but I'd be looking at 305.
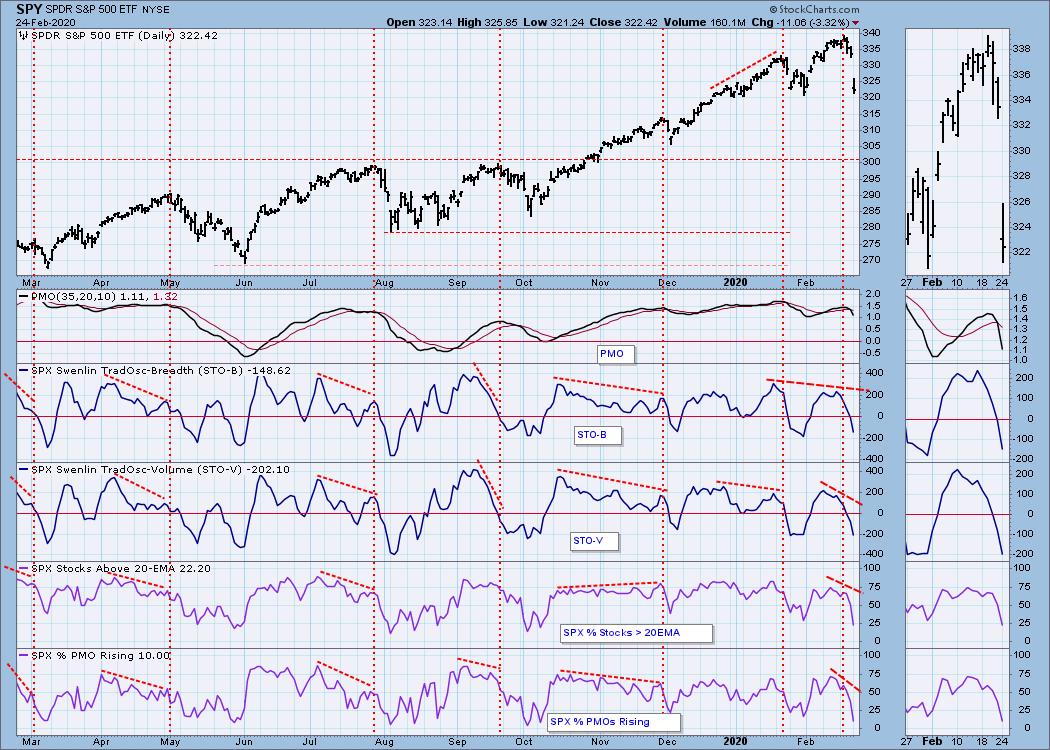
Short-Term Market Indicators: The ST trend is DOWN and the market condition is OVERSOLD based upon the Swenlin Trading Oscillator (STO) readings. Both STOs dropped into oversold territory today. This is generally good, but they're continuing to fall. The negative divergences were stark.
Intermediate-Term Market Indicators: The Silver Cross Index (% of SPX stocks 20EMA > 50EMA) and the Golden Cross Index (percent of SPX stocks 50EMA > 200EMA) have been flashing negative divergences as well.
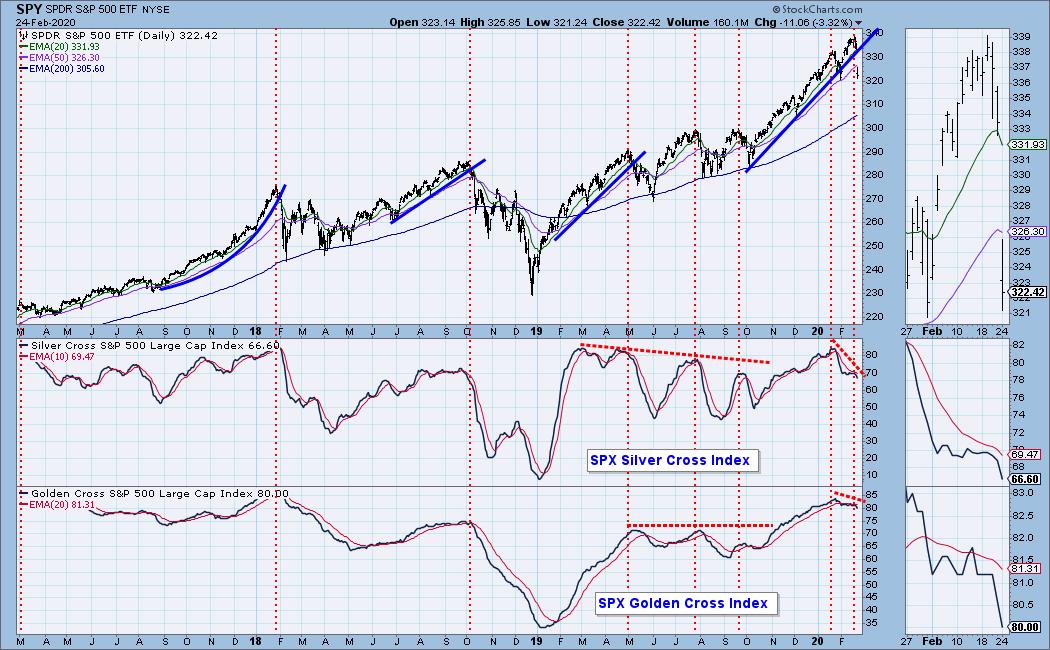
The IT trend is UP and the market condition is NEUTRAL based upon the ITBM and ITVM readings, and SOMEWHAT OVERBOUGHT based upon the PMO and Silver Cross/Golden Cross Index readings. I was really fine with the IT indicators as they were still rising and not overbought, but they topped into a negative divergence Friday and negative crossovers today.
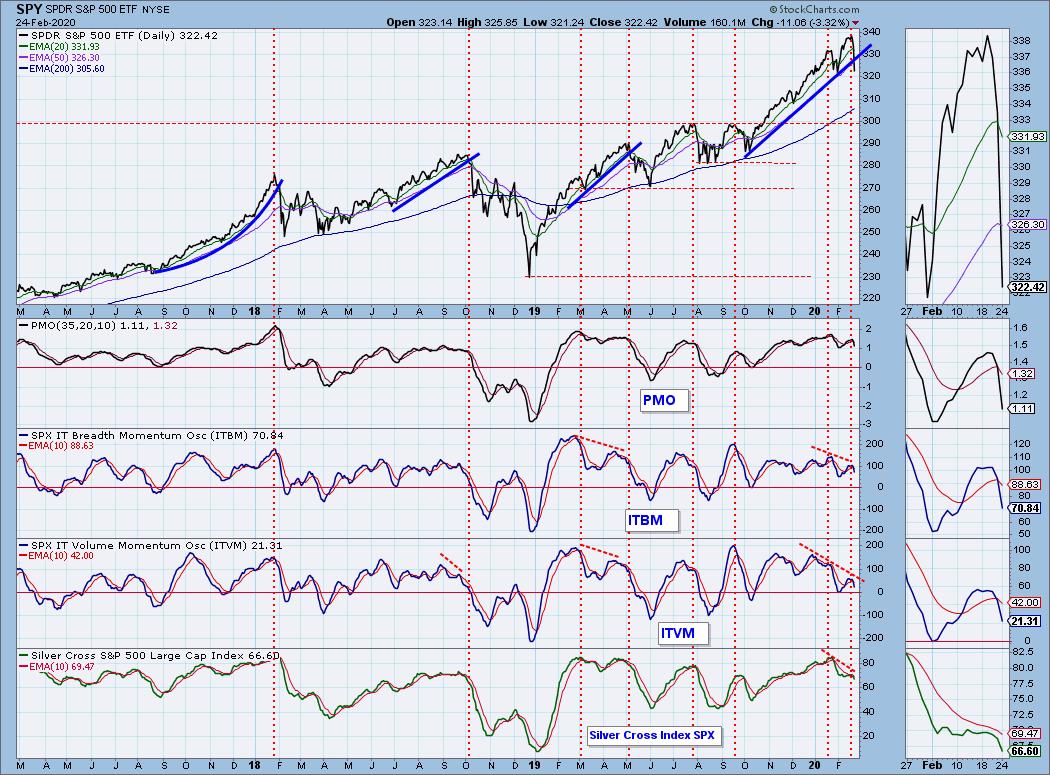
CONCLUSION: The ST is DOWN and IT trend is UP. Market condition based on ST and IT indicators is OVERSOLD to MODERATELY OVERBOUGHT. Given the unbelievable amount of negative divergences, it really has been telegraphed to DecisionPoint subscribers that a decline was nearing. The good news is that I do think we will briefly see a bounce off this support area between 315-320. I wouldn't look for an easy ride back up. I think the market environment will remain volatile for another few weeks. Now onto the "Big Four"....

As investors we want to accomplish two basic things: (1) determine the trend and condition of the market, and (2) select stocks that will ride that tide. The DecisionPoint Alert helps with the first step, and DecisionPoint Diamonds helps with the second. Go to DecisionPoint.com and SUBSCRIBE TODAY! (Charter Subscriber Discounts Available!).
DOLLAR (UUP)
IT Trend Model: BUY as of 1/22/2020
LT Trend Model: BUY as of 5/25/2018
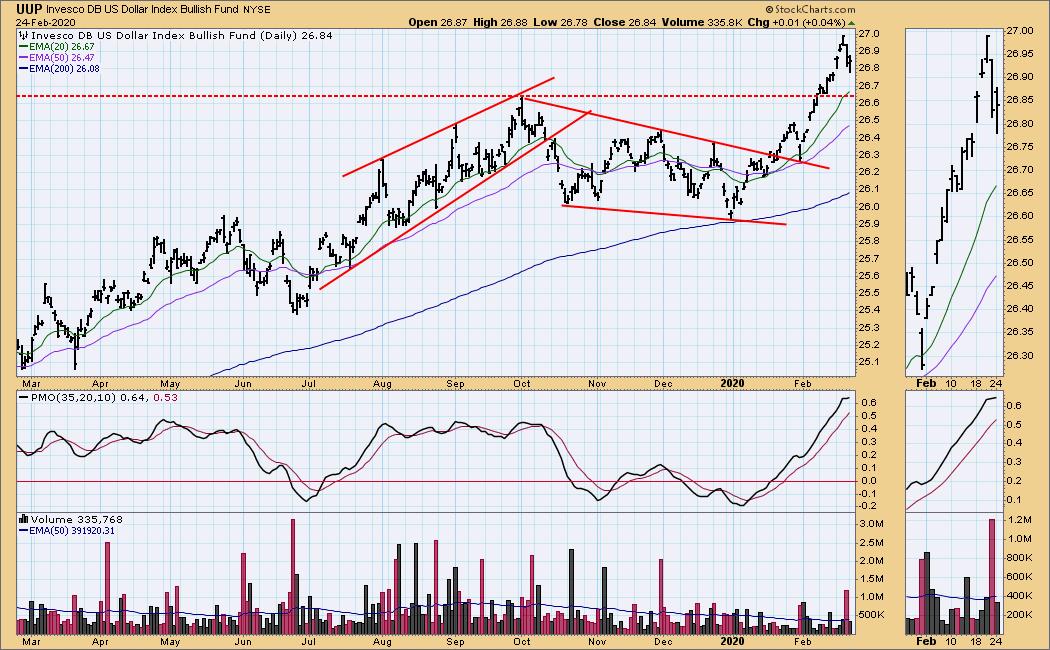
UUP Daily Chart: The Dollar pulled back on Friday and was in the process of doing the same today, but it managed to close slightly higher for the day. The PMO is trying to top in somewhat overbought territory (its normal range is -1.25 to +1.25). Support is around 26.65. At this point, I'm looking for a test of that support area.
GOLD
IT Trend Model: BUY as of 12/26/2019
LT Trend Model: BUY as of 1/8/2019
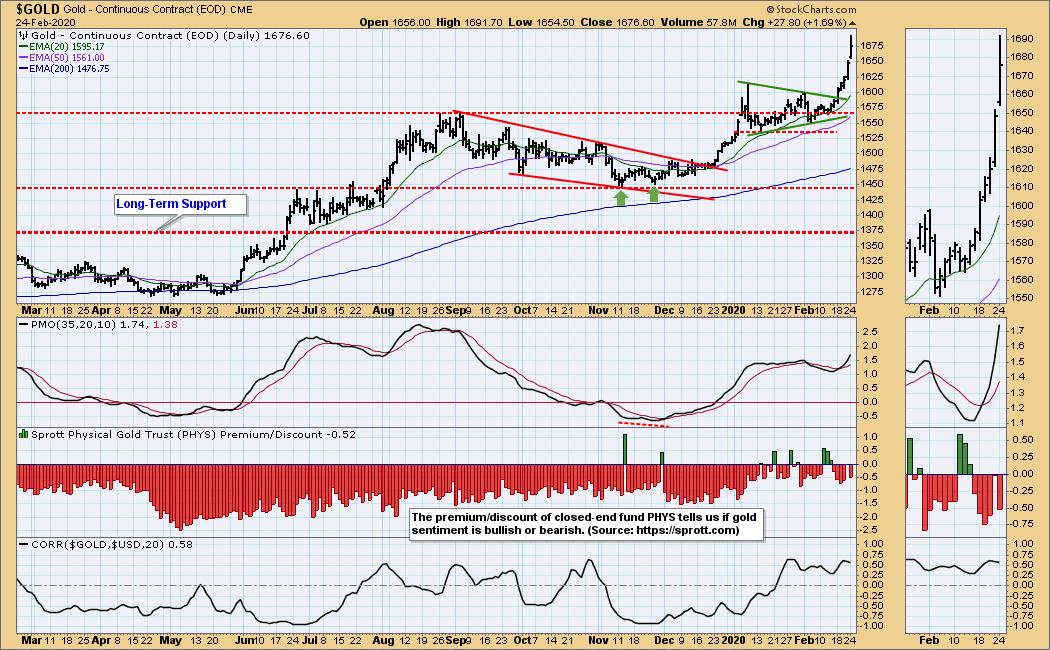
GOLD Daily Chart: Gold is now in a short-term parabolic rise. I suspect it will continue higher given that it is often considered a safe haven in volatile markets. Given the coronavirus uncertainty and now market uncertainty, I expect to see Gold continue higher, but I don't think it can continue on this vertical rise. We might see a pause if there is a market bounce.
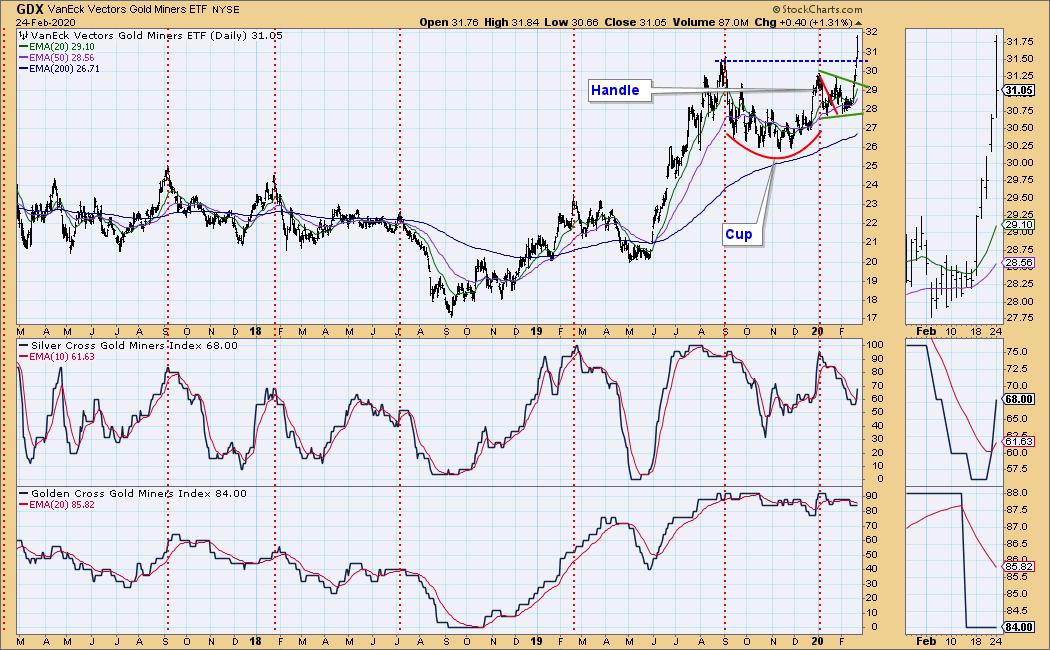
GOLD MINERS Golden and Silver Cross Indexes: The complex cup-and-handle pattern has executed and Miners are off! I liked the rally we were beginning to see, but the Silver Cross Index hadn't really turned around. Now it has. I believe new support has been set at the 2019 high and should hold for some time.
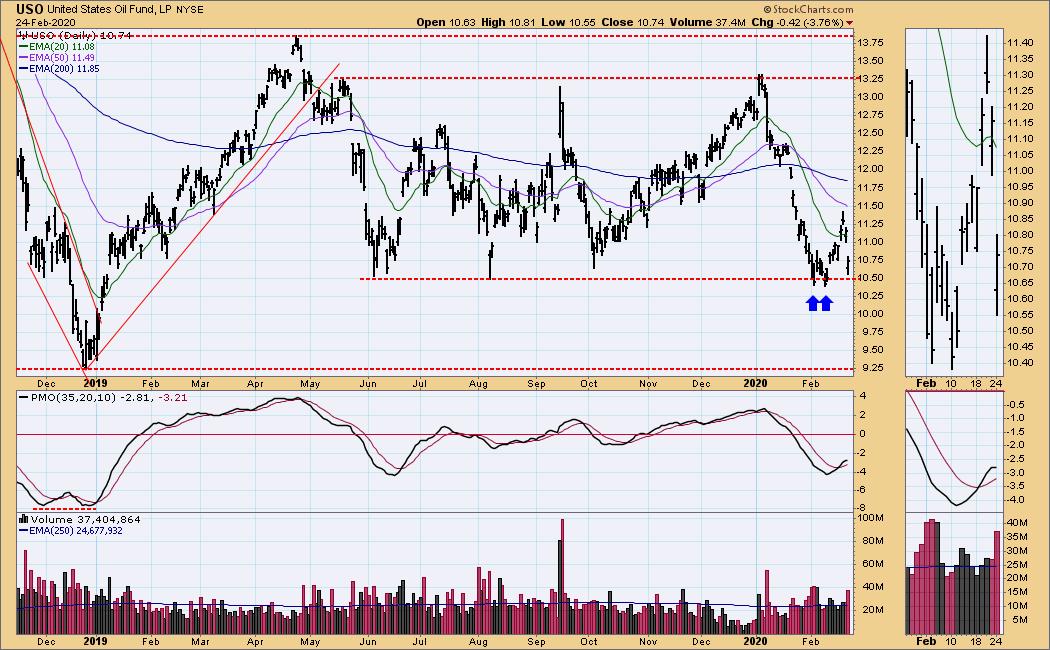
CRUDE OIL (USO)
IT Trend Model: Neutral as of 1/27/2020
LT Trend Model: BUY as of 12/16/2019
USO Daily Chart: Well, so much for the rally in Oil. The good news is that we are now back on support at the bottom of the current trading range. That said, we could see a breakdown here, since we did see lower prices in December of 2018.
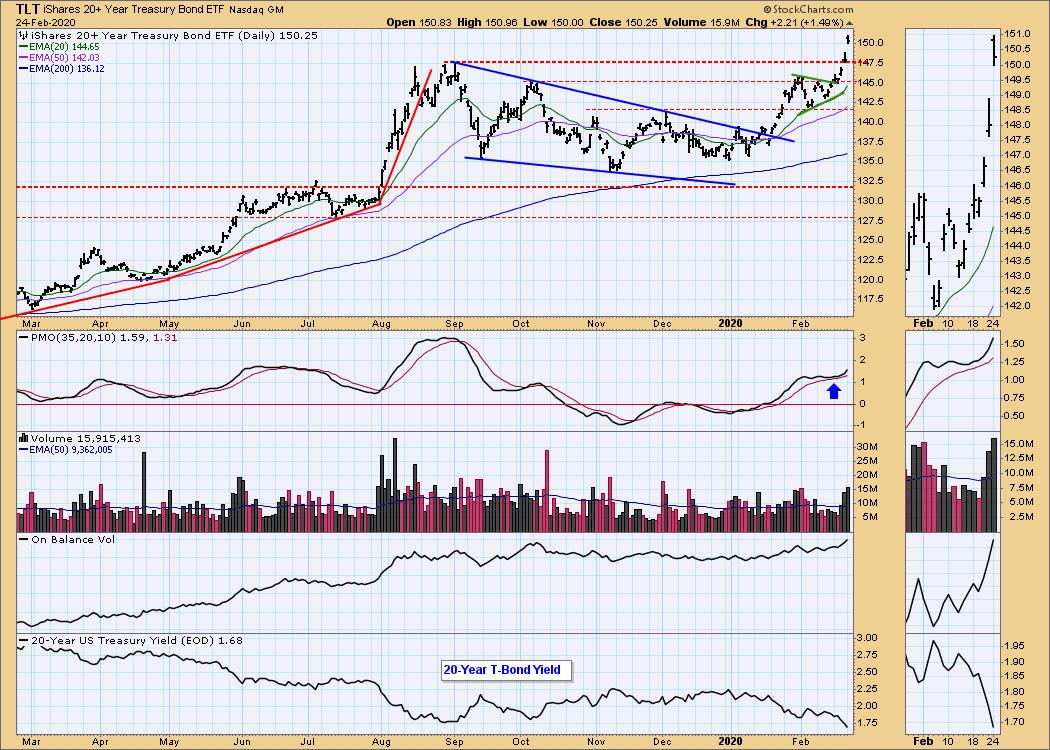
BONDS (TLT)
IT Trend Model: BUY as of 1/22/2020
LT Trend Model: BUY as of 1/2/2019
TLT Daily Chart: TLT looks a little like the Gold chart. Symmetrical triangle had an upside breakout and now we have a short-term parabolic rally with vertical price movement. A pullback to the 2019 top is reasonable, but volume and the PMO are suggesting even higher prices than we have now.
Have you subscribed the DecisionPoint Diamonds yet? DP does the work for you by providing handpicked stocks/ETFs from exclusive DP scans! Add it with a discount! Contact support@decisionpoint.com for more information!
Technical Analysis is a windsock, not a crystal ball.
Happy Charting! - Erin
Email: erin@decisionpoint.com

Erin Swenlin will be presenting at the The MoneyShow Las Vegas May 11-13, 2020! You'll have an opportunity to meet Erin and discuss the latest DecisionPoint news and Diamond Scans. The conference is free to attend or view online!
NOTE: The signal status reported herein is based upon mechanical trading model signals, specifically the DecisionPoint Trend Model. These define the implied bias of the price index based upon moving average relationships, but they do not necessarily call for a specific action. They are information flags that should prompt chart review. Further, they do not call for continuous buying or selling during the life of the signal. For example, a BUY signal will probably (but not necessarily) return the best results if action is taken soon after the signal is generated. Additional opportunities for buying may be found as price zigzags higher, but the trader must look for optimum entry points. Conversely, exit points to preserve gains (or minimize losses) may be evident before the model mechanically closes the signal.
Helpful DecisionPoint Links (Can Be Found on DecisionPoint.com Links Page):
DecisionPoint Shared ChartList and DecisionPoint Chart Gallery
Price Momentum Oscillator (PMO)
Swenlin Trading Oscillators (STO-B and STO-V)


