I have often thought of using technical analysis as being somewhat like being the pilot of a paddle wheel steamer on the Mississippi River in the 1800s. He watched for eddies, roiling, churning and waves to warn of the possible dangers and help guide the boat safely to its destination. The lead article on Friday's DecisionPoint Alert Weekly Wrap illustrates the concept. Let me emphasize that this is not an "I told you so" commentary. We had no idea that there would be a down day like we just experienced, but we did see clues that warned of probable weakness. The following is a reprint of the lead to Friday's commentary. (The chart has been updated to include today's market action.)
DecisionPoint.com maintains a chart list for our subscribers that is composed of the 11 S&P SPDR Sectors, and every day I review and update the annotations to those charts. One thing I noticed in the last few weeks is the negative divergences developing in the Technology Sector (XLK) chart. To begin, there was a small pullback after the January price top, then there was another short rally to new, all-time highs this month; however, we can see that four of the indicators declined during that rally: (1) OBV showed that volume was drying up; (2) the Silver Cross Index showed a -22% decrease of stocks with the 20EMA above the 50EMA; and (3) the percentage of stocks above their 20EMA and 50EMA decreased about -25% each. These were concrete signs that participation in the Technology Sector rally was fading, and that some kind of correction was likely.
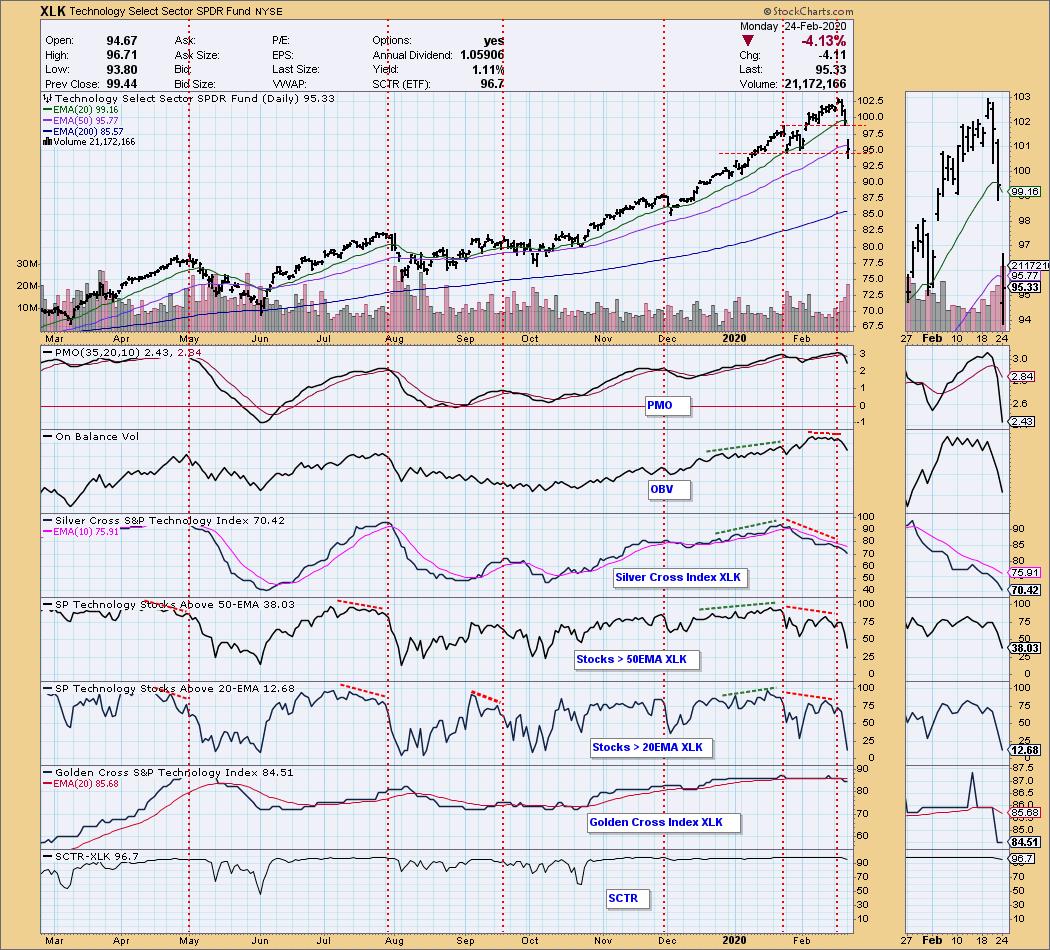
These negative divergences are a gift that we don't always get. Note how the indicators behaved during the rally from the December price low -- all they did was confirm the rally by moving higher themselves, and the January correction appeared without warning, at least not from these indicators.
The negative divergences are a strong hint that something untoward is probably about to happen, but they are not infallible. Participation can narrow, but the large-cap stocks may still be able to support the rising trend. Nevertheless, those divergences will nail it more often than not.

As investors we want to accomplish two basic things: (1) Determine the trend and condition of the market, and (2) select stocks that will ride that tide. The DecisionPoint Alert helps with the first step, and DecisionPoint Diamonds helps with the second. Go to DecisionPoint.com and SUBSCRIBE TODAY! (Charter Subscriber Discounts Available!)
Happy Charting! - Carl
Technical Analysis is a windsock, not a crystal ball.
Helpful DecisionPoint Links:
DecisionPoint Alert Chart List
DecisionPoint Golden Cross/Silver Cross Index Chart List
DecisionPoint Sector Chart List
Price Momentum Oscillator (PMO)
Swenlin Trading Oscillators (STO-B and STO-V)


