I remember years ago, when I was doing the flagship (now defunct) MarketWatchers LIVE show on StockCharts TV, Tom Bowley mentioned that, when the Dollar began to rise, it can hurt global companies (most are large-cap). Their exposure to buying overseas puts them at a disadvantage when the Dollar rises. Basically, it costs more to do business outside of the U.S. Using this same line of thinking, it makes me wonder if this war is going to put large-cap stocks, at least those with a global presence, at a disadvantage.
I decided to investigate further using our Silver and Golden Cross Index charts. You'll note on the Silver Cross Index (SCI) chart below that the SPX is seeing continued damage to participation as the SCI trends downward. Now look at IJH and IJR. Both have SCIs in a rising trend that began in early February. Don't get too excited; the readings themselves are very bearish, since they are below 40%. In fact, IJH and IJR have SCIs that are lower than the SPX. They may be rising, but the participation itself is still weak, given SCI readings are below 40%.
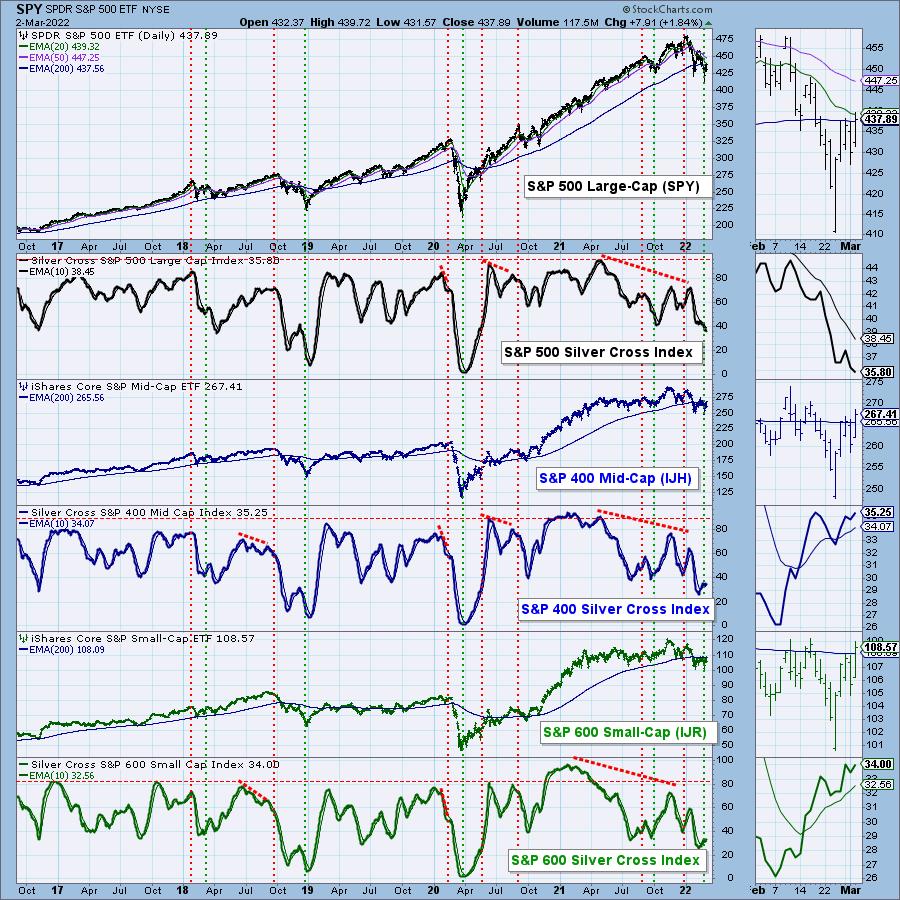

Longer-term, the Golden Cross Index (GCI) for all of these indexes are trending lower. We could be seeing the GCIs for IJH and IJR beginning to bottom, as they hold the same readings as they did yesterday, unlike the SPX's GCI.
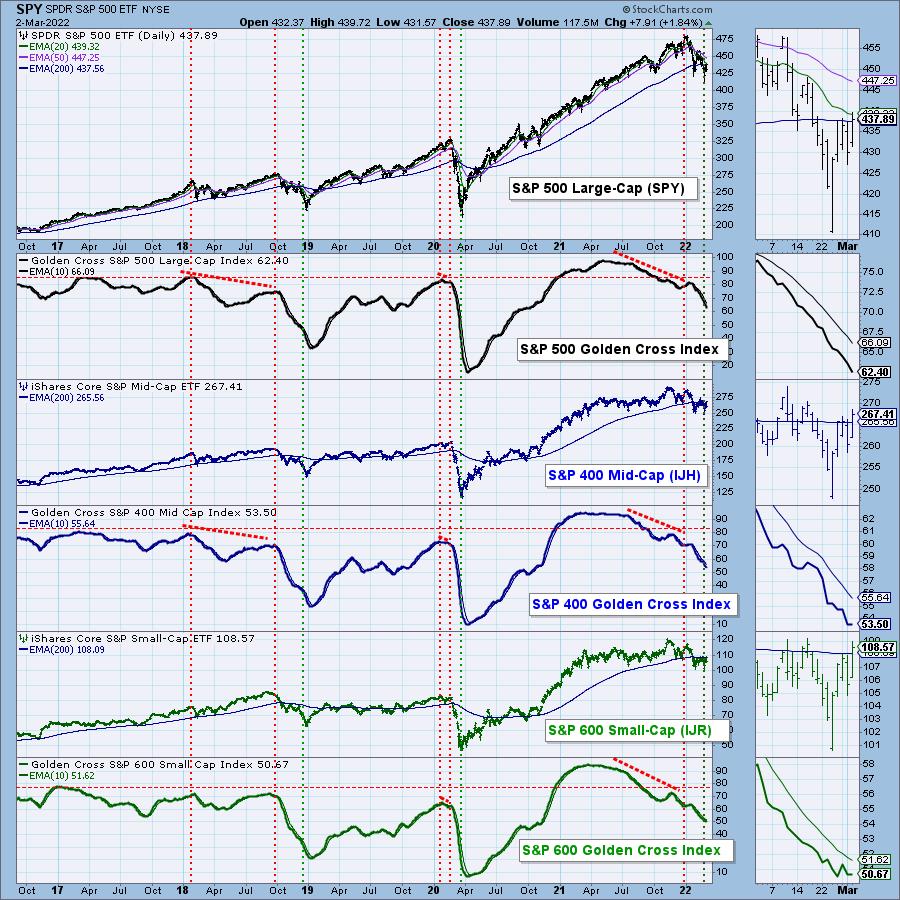
Conclusion: If I'm right about the pressure on global companies in the SPX, we will likely continue to see participation deteriorate. Small- and mid-cap companies tend to be domestic and less exposed to the war and sanctions. Just remember that the readings for all of these SCIs and GCIs are very bearish. We consider a reading above 70% as bullish. We are in a bear market and should temper all bullish expectations.
Good Luck & Good Trading!
Erin Swenlin
*PARTICIPATION: We objectively show the depth and trend of participation in two time frames as follows:
- Intermediate-Term - the Silver Cross Index (SCI) shows the percentage of SPX stocks on IT Trend Model BUY signals (20-EMA > 50-EMA). The opposite of the Silver Cross is a "Dark Cross" -- those stocks are, at the very least, in a correction.
- Long-Term - the Golden Cross Index (GCI) shows the percentage of SPX stocks on LT Trend Model BUY signals (50-EMA > 200-EMA). The opposite of a Golden Cross is the "Death Cross" -- those stocks are in a bear market.
 DON'T DELAY! IT'S FREE!
Recording Link for 2/28 Trading Room:
Topic: DecisionPoint Trading Room
Start Time: Feb 28, 2022 08:54 AM
Meeting Recording Link.
Access Passcode: Feb#28th
Technical Analysis is a windsock, not a crystal ball. --Carl Swenlin
(c) Copyright 2022 DecisionPoint.com
Helpful DecisionPoint Links:
DecisionPoint Alert Chart List
DecisionPoint Golden Cross/Silver Cross Index Chart List
DecisionPoint Sector Chart List
Price Momentum Oscillator (PMO)
Swenlin Trading Oscillators (STO-B and STO-V)
DecisionPoint is not a registered investment advisor. Investment and trading decisions are solely your responsibility. DecisionPoint newsletters, blogs or website materials should NOT be interpreted as a recommendation or solicitation to buy or sell any security or to take any specific action.


