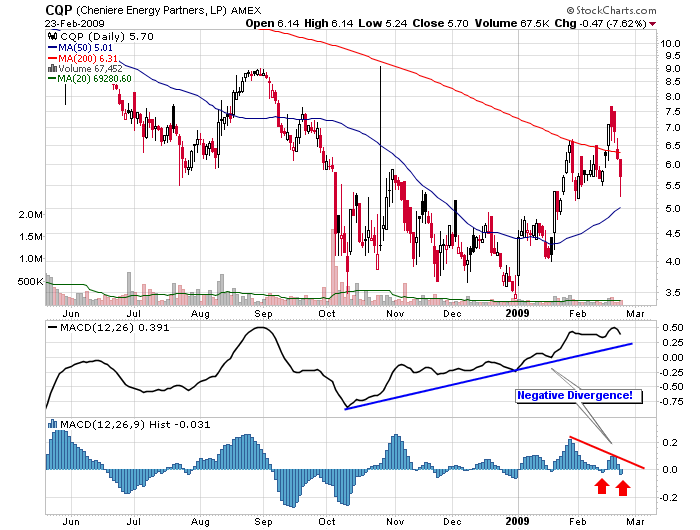
Click here for a live version of this chart.
The MACD Histogram shows the change in momentum of the MACD Line. The MACD Line - in turn - shows the change of momentum in the underlying stock. In the case of CQP, the MACD Line has been moving up pretty steadily since early October (blue trendline). Recently however the MACD Histogram has started moving lower and is now diverging significantly from the MACD Line. This signals trouble for the stock - something that may already be appearing on the chart.

About the author:
Chip Anderson is the founder and president of StockCharts.com.
He founded the company after working as a Windows developer and corporate consultant at Microsoft from 1987 to 1997.
Since 1999, Chip has guided the growth and development of StockCharts.com into a trusted financial enterprise and highly-valued resource in the industry.
In this blog, Chip shares his tips and tricks on how to maximize the tools and resources available at StockCharts.com, and provides updates about new features or additions to the site.
Learn More


