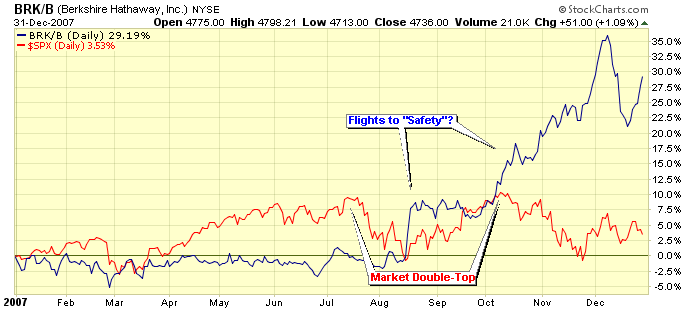
Click here for a live version of this chart.
Continuing to look for "leading" technical signals that pointed to the market's recent crash. It's always interesting to see how the country's "best" investor did. Warren Buffet's Berkshire Hathaway had a couple of interesting jumps in its stock price during the period in question. Comparing the percentage performance of BRK/B to $SPX, we can see two big jumps in 2007 (chart above) and one jump in 2008 (chart below). Of course, not all jumps in BRK/B are signs of an impending crash - but these charts show that they shouldn't be ignored either.

About the author:
Chip Anderson is the founder and president of StockCharts.com.
He founded the company after working as a Windows developer and corporate consultant at Microsoft from 1987 to 1997.
Since 1999, Chip has guided the growth and development of StockCharts.com into a trusted financial enterprise and highly-valued resource in the industry.
In this blog, Chip shares his tips and tricks on how to maximize the tools and resources available at StockCharts.com, and provides updates about new features or additions to the site.
Learn More


