Click here for a live version of this chart
How are your money management skills these days? Here's a real test for you:
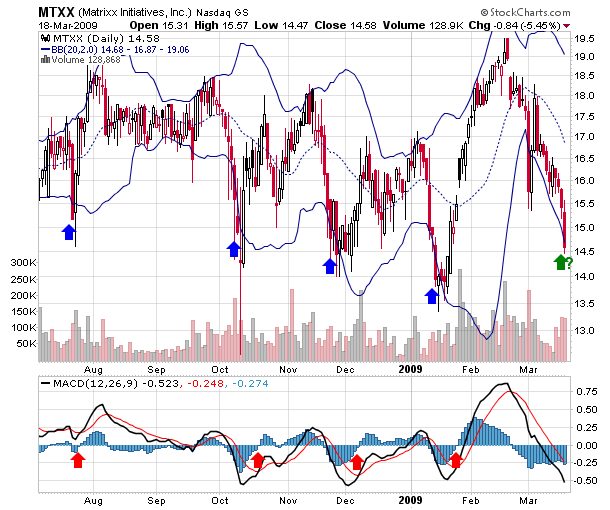
Over the past 10 months, MTXX has been bouncing up and down between roughly 14 and 19. One of the first signals that the stock is about to start moving higher again has been when it penetrates its lower Bollinger Band (blue arrows). While extremely risky by themselves, those signals have often been confirmed by MACD Histogram crossovers within a couple of days (red arrows).
By practicing good money management skills (tight stops, well defined exits, etc.), agile traders may be able to take advantage of MTXX's recent history now that it has gone and done it again (green arrow). The rest of us can watch with interest to see if history will repeat.

About the author:
Chip Anderson is the founder and president of StockCharts.com.
He founded the company after working as a Windows developer and corporate consultant at Microsoft from 1987 to 1997.
Since 1999, Chip has guided the growth and development of StockCharts.com into a trusted financial enterprise and highly-valued resource in the industry.
In this blog, Chip shares his tips and tricks on how to maximize the tools and resources available at StockCharts.com, and provides updates about new features or additions to the site.
Learn More