Click here for a live version of this chart.

Click here for a live version of this chart.
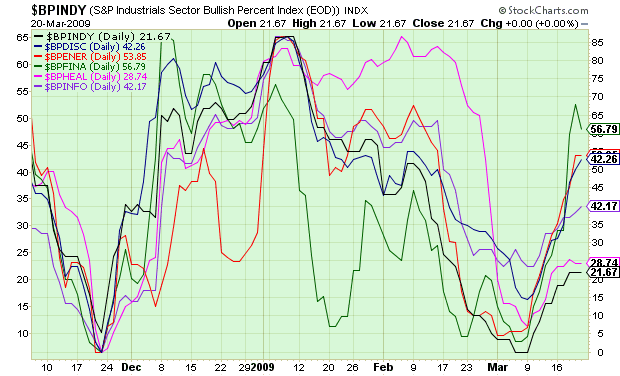
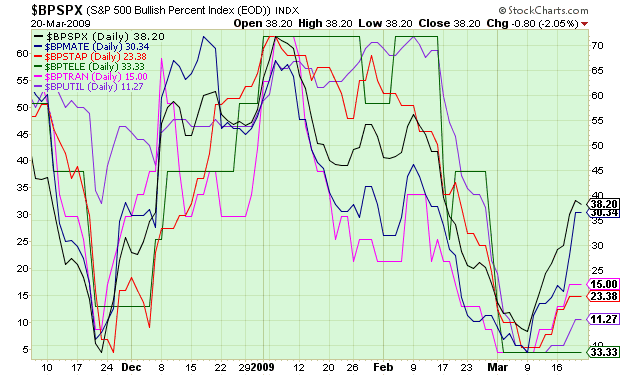
Bullish Percent indexes show the percentage of stocks in a given group that have a "Buy Signal" on their P&F chart. Above are charts with the 11 different sector-based Bullish Percent Indexes that we calculate here at StockCharts.com (with the S&P 500 BPI thrown in for good measure).
All of the BPIs started moving higher at the start of the month however some appear to be running out of steam right now. Financial stocks are leading right now with Energy stocks close behind. Smart investors always know where these Bullish Percent Indexes are going - they are some of the best market sentiment indexes available anywhere.
All of the BPIs started moving higher at the start of the month however some appear to be running out of steam right now. Financial stocks are leading right now with Energy stocks close behind. Smart investors always know where these Bullish Percent Indexes are going - they are some of the best market sentiment indexes available anywhere.

About the author:
Chip Anderson is the founder and president of StockCharts.com.
He founded the company after working as a Windows developer and corporate consultant at Microsoft from 1987 to 1997.
Since 1999, Chip has guided the growth and development of StockCharts.com into a trusted financial enterprise and highly-valued resource in the industry.
In this blog, Chip shares his tips and tricks on how to maximize the tools and resources available at StockCharts.com, and provides updates about new features or additions to the site.
Learn More


