Click here for a live version of this chart
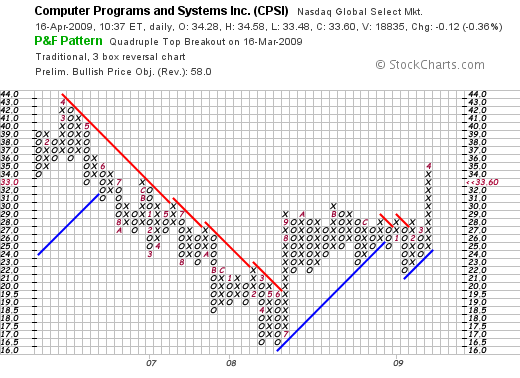
CPSI has had a pretty impressive P&F chart for a while now. On March 16th, it completed a Quadrupal Top Breakout pattern that is, technically, still in place today. The problem is that CPSI is dangerously close to reversing right now with the potential to fall back below that huge support/resistance level at 29-30.
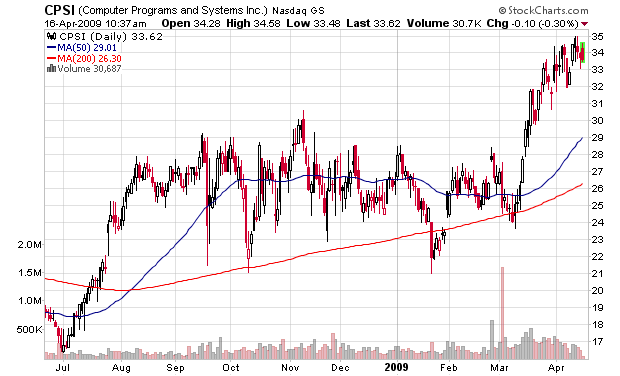
The key for this chart is to see if CPSI can remain above 33.0 (see the red number of the _left_ side of the chart?). If it can, the breakout will remain valid. A quick glance at the Candlestick chart however reveals that things don't look promising:

Click here for a live version of this chart
The volume picture in particular points to a breakout that is running out of steam and is ripe for some profit taking. Still, CPSI has made an impressive move that is worth watching closely.

About the author:
Chip Anderson is the founder and president of StockCharts.com.
He founded the company after working as a Windows developer and corporate consultant at Microsoft from 1987 to 1997.
Since 1999, Chip has guided the growth and development of StockCharts.com into a trusted financial enterprise and highly-valued resource in the industry.
In this blog, Chip shares his tips and tricks on how to maximize the tools and resources available at StockCharts.com, and provides updates about new features or additions to the site.
Learn More
