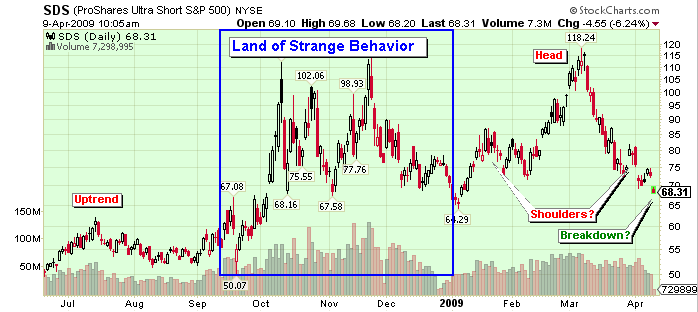
SDS is the ProShares Ultra Short S&P 500 ETF. It's a way to invest (gamble really) that the market is going to fall. It showed up today on our Ticker Cloud page as one of today's most popular charts. A close look at the chart shows why.
Prior to September of last year, SDS was in a pretty nice uptrend (something that's bad for the overall market obviously). Then, as we know, the markets went nuts and so did SDS. Since January however, the markets have gotten better organized with fewer huge jumps - just like SDS.
What's interesting is that if you mentally remove what I'm calling the "Land of Strange Behavior" from the chart, you are left with a pretty classic Head and Shoulders top pattern - the uptrend from last summer, followed by the left shoulder in January, the head in early March and the possible right shoulder at the start of April.
Today's gap down hints at a possible break below the neckline.
Obviously, selectively ignoring parts of a chart is "cheating" when it comes to pure technical analysis. But with this chart, I'm more interested in the psychology of the bears and right now, what this chart is saying is that the bears are nervous.
Regardless, SDS will be very interesting to watch over the next couple of hours/days. And be sure to check out the cloud from time to time to see what others are charting.


