Don't Ignore This Chart! January 31, 2011 at 02:30 PM
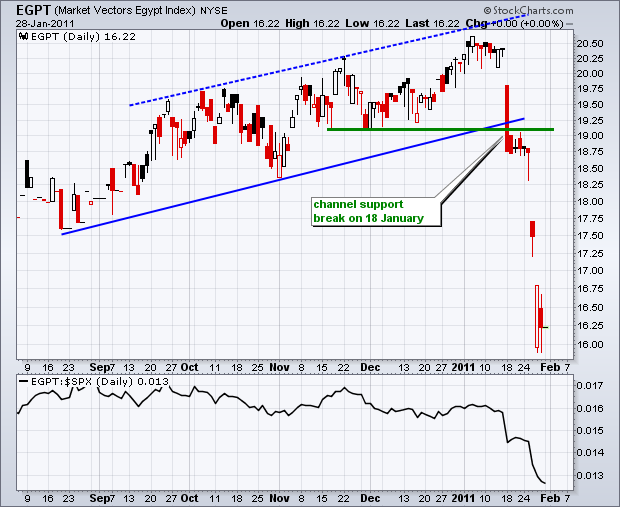
Last week's upheaval in Eqypt contributed to a sharp decline in US stocks on Friday. Even though the upheaval began early last week (Tuesday), the Egypt ETF (EGPT) gave fair warning with a support break a week earlier (January 18th)... Read More
Don't Ignore This Chart! January 28, 2011 at 02:56 PM
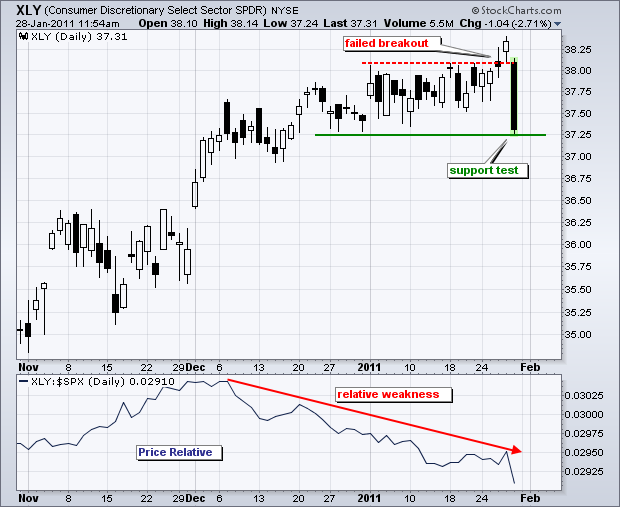
The Consumer Discretionary SPDR (XLY) broke above consolidation resistance on Thursday, but failed to hold this breakout after a sharp decline early Friday. XLY formed a long black candlestick that pushed the ETF to its lowest level since late December... Read More
Don't Ignore This Chart! January 27, 2011 at 06:02 PM
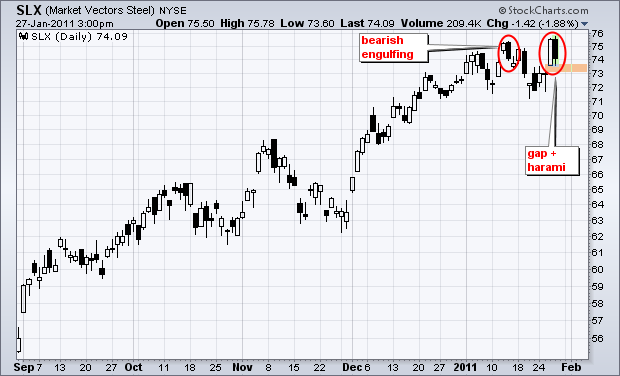
The Steel ETF (SLX) is running into stiff resistance just above 75 with a bearish engulfing two weeks ago and a potentially bearish harami today. After a gap and long white candlestick on Tuesday, the stock moved sharply lower today with a long black candlestick... Read More
Don't Ignore This Chart! January 26, 2011 at 08:59 PM
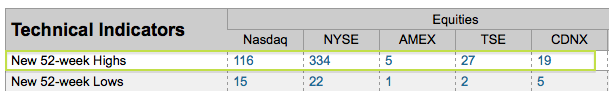
From the pre-defined scans page, the number of new 52-week highs continues to outpace the number of new 52-week lows. This is true for the Nasdaq, NYSE, Amex, TSE and CDNX. The latter two are Canadian exchanges. New highs are a show of strength, not weakness... Read More
Don't Ignore This Chart! January 25, 2011 at 03:50 PM
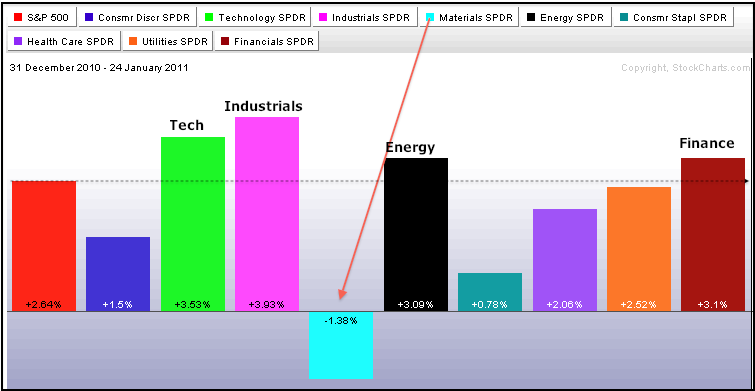
The year-to-date sector scorecard shows the Basic Materials SPDR (XLB) lagging the S&P 500. Moreover, XLB is the only sector sporting a loss for 2011. The technology, industrials, energy and finance sectors show relative strength with gains greater than the S&P 500... Read More
Don't Ignore This Chart! January 24, 2011 at 05:48 PM
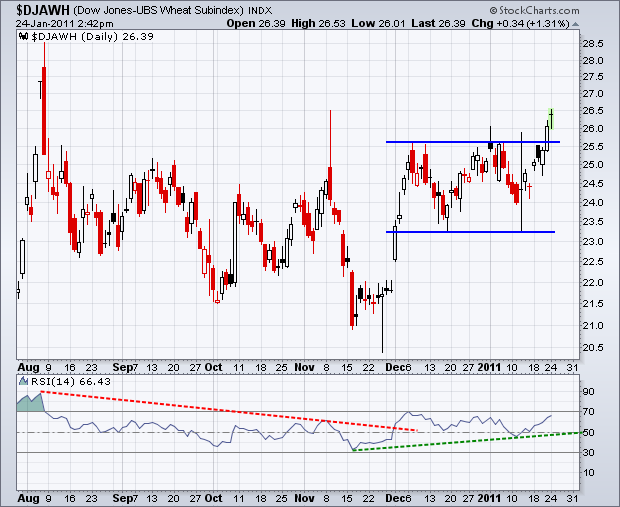
Grains are on the run with a breakout in the DJ-UBS Wheat Index ($DJAWH). The chart below shows the index surging in early December, consolidating for seven weeks and then breaking consolidation resistance the last few days... Read More
Don't Ignore This Chart! January 20, 2011 at 02:53 PM
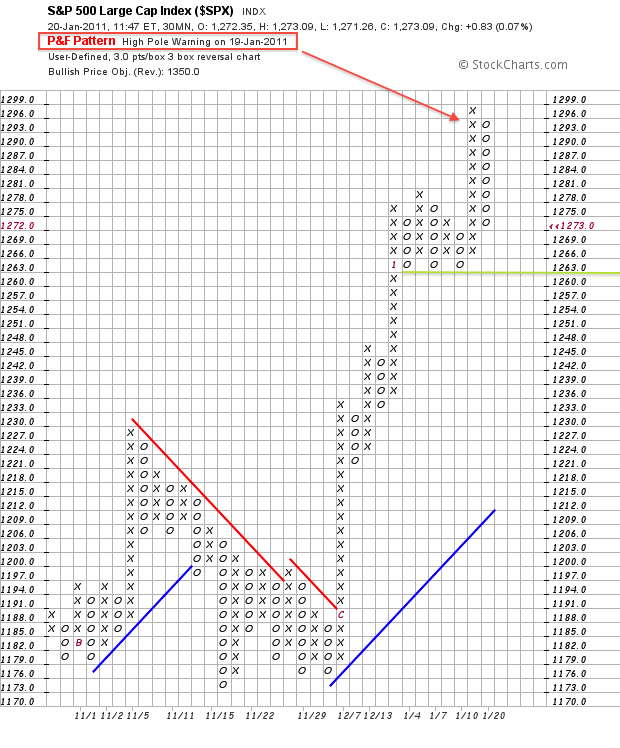
The S&P 500 surged above 1296 and then quickly fell below 1278 to forge a high-pole warning on the P&F chart. Despite this warning, the index remains above a clear support level marked by three reaction lows at 1263... Read More
Don't Ignore This Chart! January 19, 2011 at 02:18 PM
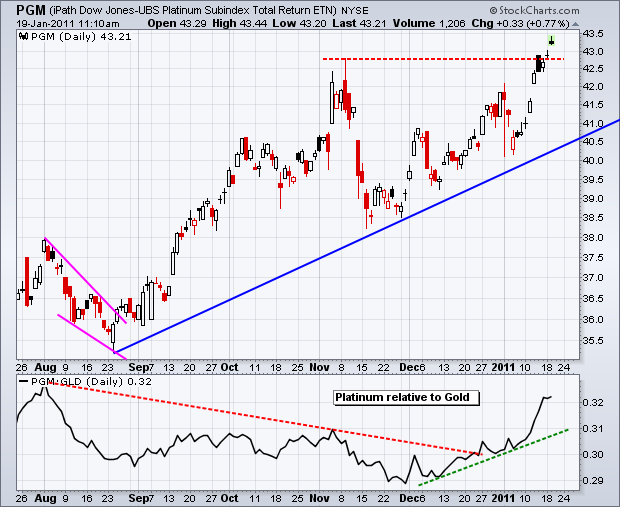
While the Gold Trust SPDR (GLD) pulled back rather sharply in 2011, the Platinum ETN (PGM) held strong and recorded a new 52—week high this week. Platinum was lagging gold until from early August until late November... Read More
Don't Ignore This Chart! January 18, 2011 at 05:51 PM
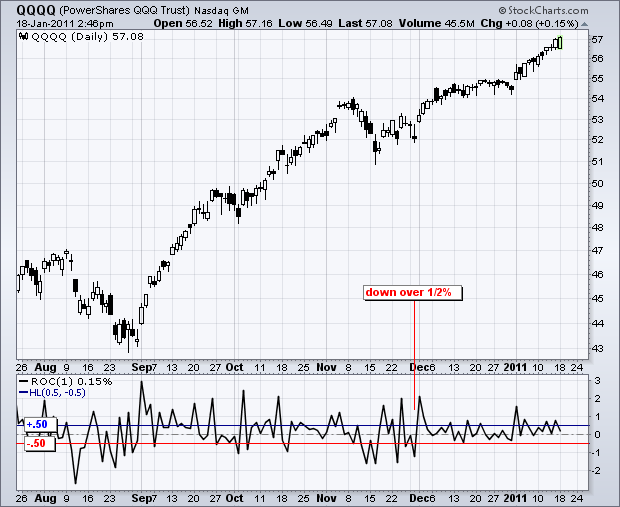
The Nasdaq 100 ETF (QQQQ) has not seen a loss greater than 1/2% since November 30th, around six weeks ago. There have been plenty of gains greater than 1/2% and even a few losses, but no painful losses... Read More
Don't Ignore This Chart! January 14, 2011 at 01:00 PM
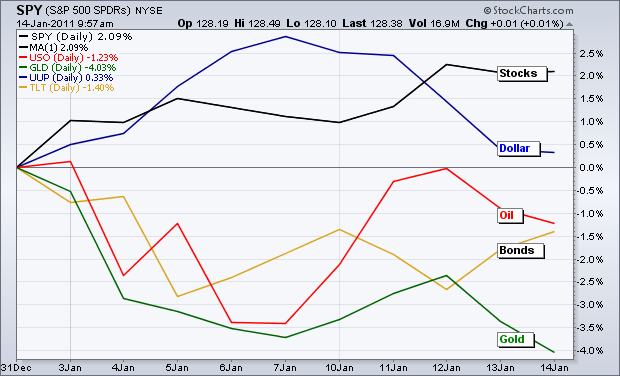
With two weeks underway, stocks are taking the lead and gold is taking the lag for 2011. Of the five inter-market related ETFs, the S&P 500 ETF (SPY) and the US Dollar Fund (UUP) are up this year. The USO Oil Fund (USO), 20+ year Bond ETF (TLT) and Gold SPDR (GLD) are down... Read More
Don't Ignore This Chart! January 13, 2011 at 05:36 PM
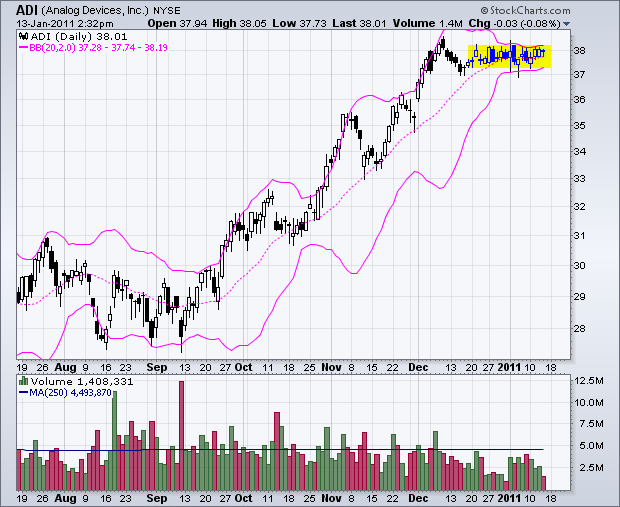
With a tight trading range the last several weeks, the Bollinger Bands have significantly narrowed for Analog Devices (ADI) - and the squeeze is on. A close above the upper band would be short-term bullish, while a close below the lower band would be short-term bearish... Read More
Don't Ignore This Chart! January 12, 2011 at 07:53 PM
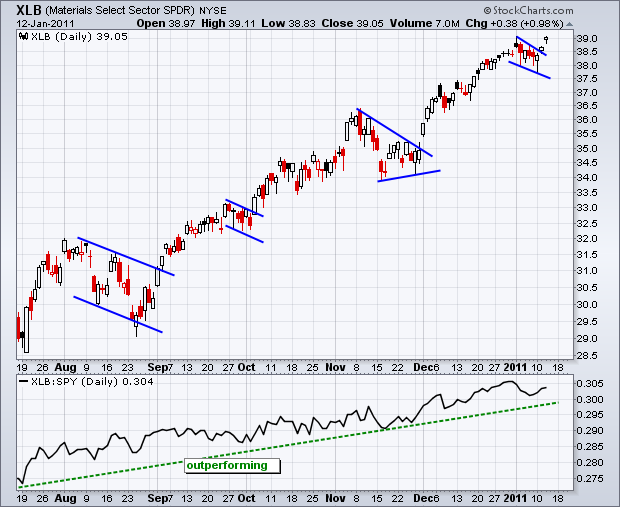
The Basic Materials SPDR (XLB) remains on of the top performing sectors in the market. Since breaking resistance in September, the ETF advanced with a series of consolidation breakout... Read More
Don't Ignore This Chart! January 11, 2011 at 05:47 PM
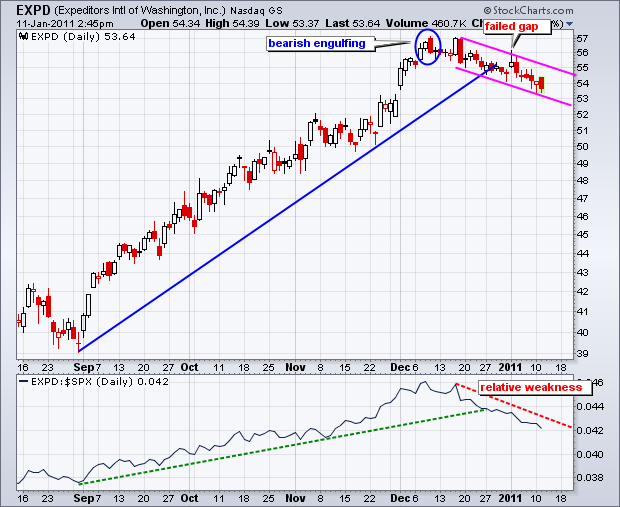
Even though the market has been moving higher since mid December, Expeditors has been under pressure and shown relative weakness. It all started with a bearish engulfing in early December... Read More
Don't Ignore This Chart! January 10, 2011 at 02:36 PM
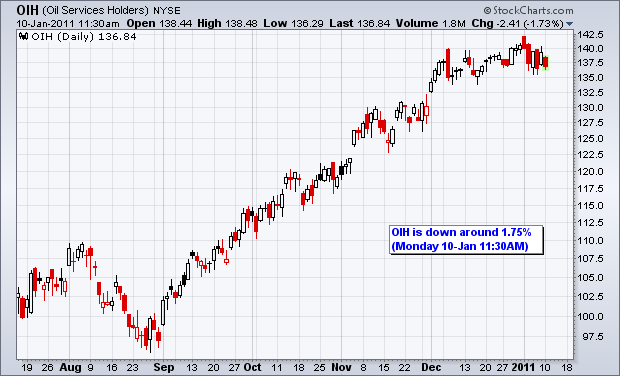
Oil is trading up over 1% early Monday, but the Oil Service HOLDRS (OIH) is down over 1.5%. OIH seems to have some doubts regarding this pipeline related pop in crude... Read More
Don't Ignore This Chart! January 07, 2011 at 03:05 PM
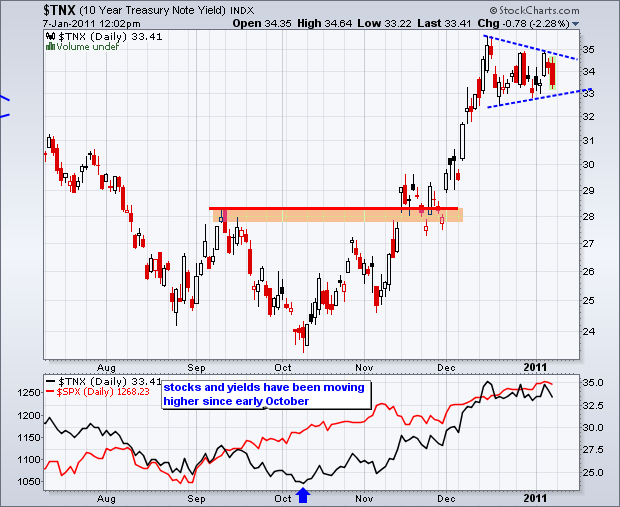
It has been a wild ride in the bond market this week. Treasuries fell and yields surged as the ADP employment report showed strong job growth on Wednesday. This move was reversed on Friday as bonds surged and yields fell after a disappointing non-farm payroll report... Read More
Don't Ignore This Chart! January 06, 2011 at 06:21 PM
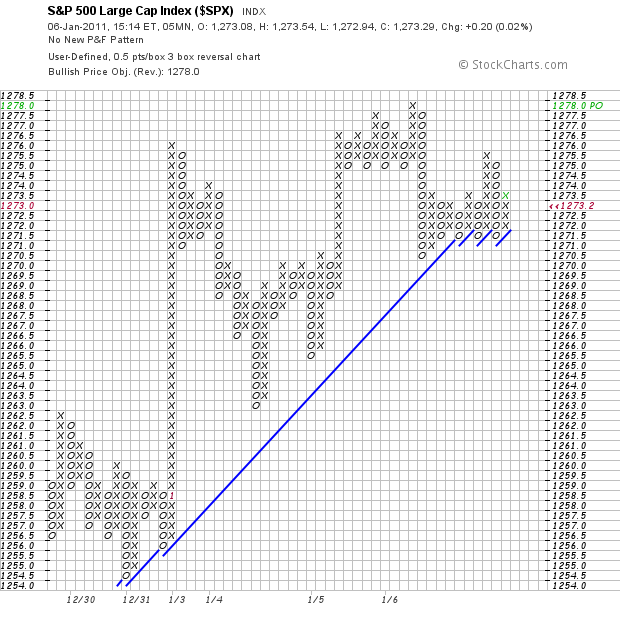
Even though this is very short-term oriented, the 5 minute P&F chart for the S&P 500 shows a clear support level around 1270. The ETF bounced off this area at least five times today. A break below would argue for some sort of short-term pullback... Read More
Don't Ignore This Chart! January 05, 2011 at 06:34 PM
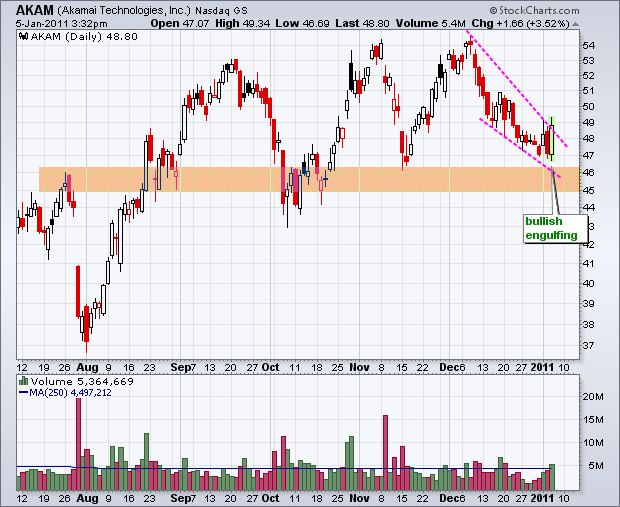
Akamai (AKAM) declined to support in December and formed a rather large bullish engulfing on Wednesday, provided the close is above the prior day's open. Volume also ticked up to exceed the 250-day SMA... Read More
Don't Ignore This Chart! January 04, 2011 at 06:14 PM
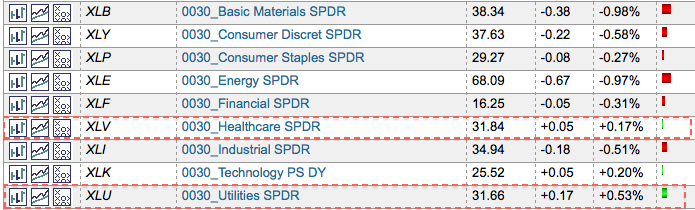
After a big bang to start the year, stocks turned defensive on day two as six of the nine sectors were down as of 3PM ET. Of the three that were up, the utilities and healthcare sectors come from the defensive end of the market... Read More
Don't Ignore This Chart! January 03, 2011 at 05:51 PM
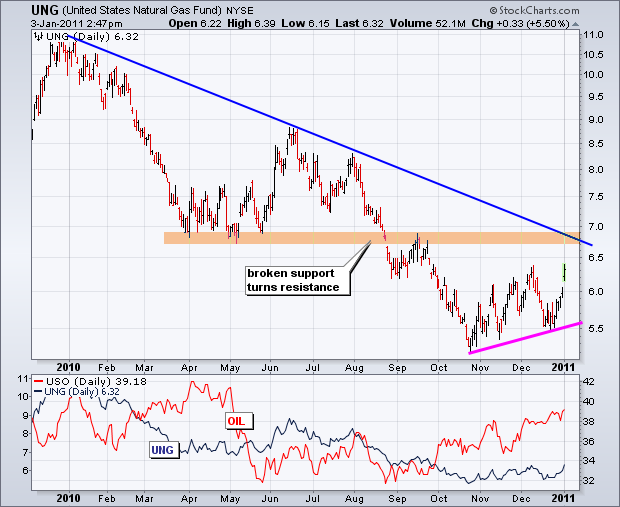
The US Natural Gas Fund (UNG) remains in a long-term downtrend, but the ETF shows signs of life with a higher low in late December and a surge in early January. Broken support and the January-2010 trendline combine to mark the next resistance around 6.7-6.9... Read More