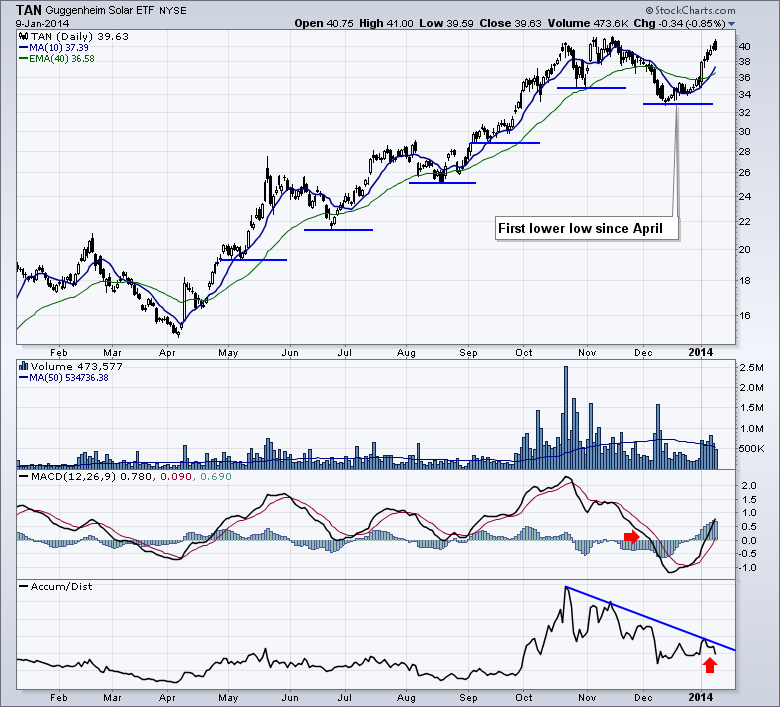
The solar industry has had a ray of sunlight shining on it all year. TAN and KWT were two huge performing ETFs in the space.
There are a few points on this chart that make it very timely. We are trying to break out to new highs currently. The first thing to be watching is that we made a lower low in price for the first time since April. Market oscillations are not uncommon. However, a lower low needs to be followed by a higher high to continue the uptrend.
The indicators are telling us to watch closely. The MACD is at a much lower level than at the previous high in October or November creating divergence. This can work itself out if TAN continues to push higher in price. However, You will notice the MACD also had divergence between October and November so there is some weakening in the trend. The Accumulation line is near its recent low and has been pointing down while the ETF has been going up so far in January 2014.
KWT, another Solar ETF, made a new high this week and reversed to create some question as to whether there is enough new buyers to take this higher.
Good Trading,
Greg Schnell, CMT


