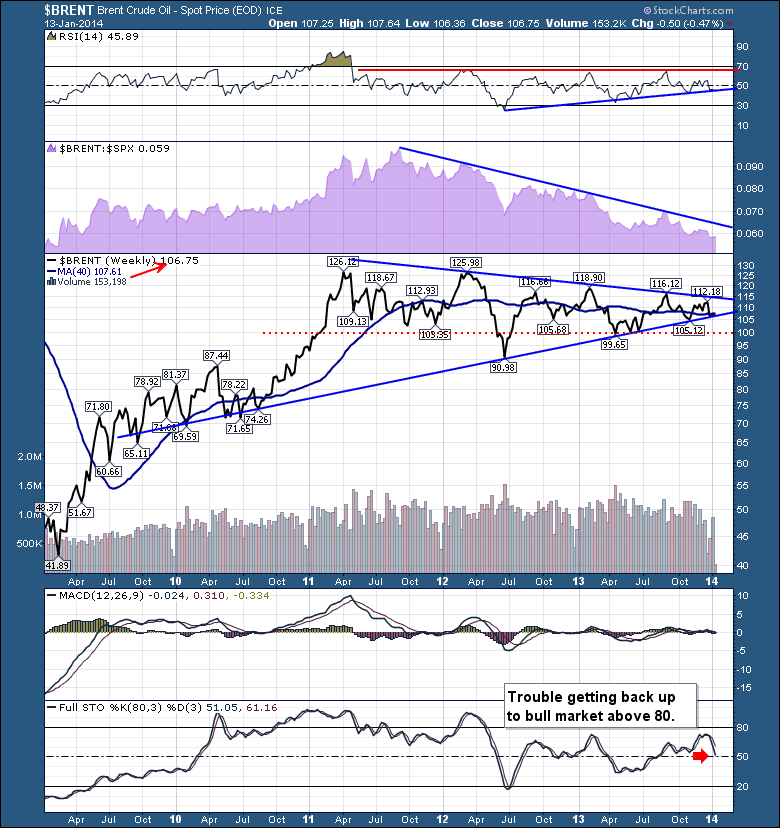
This compelling point in time on the $BRENT chart makes it very worthy of the 'Don't Ignore This Chart' blog.
Starting at the top, the RSI is still staying under 65 which we would associate with a bear market pattern. It is currently testing the 18 month uptrend line off the 2012 lows as well.
The relative performance in Purple is clear. $BRENT is underperforming the broad market so investors are flowing out of $BRENT.
$BRENT is in a massive pattern, somewhat similar to the $WTIC chart, but different in one major event. $WTIC broke above the pennant pattern and has now fallen back inside the pattern. $BRENT never took the trip above at all. Everything points to a major trend line break soon. Based on the abundant inventory levels, I would select down as my bias. We are trading just under the 40 WMA.
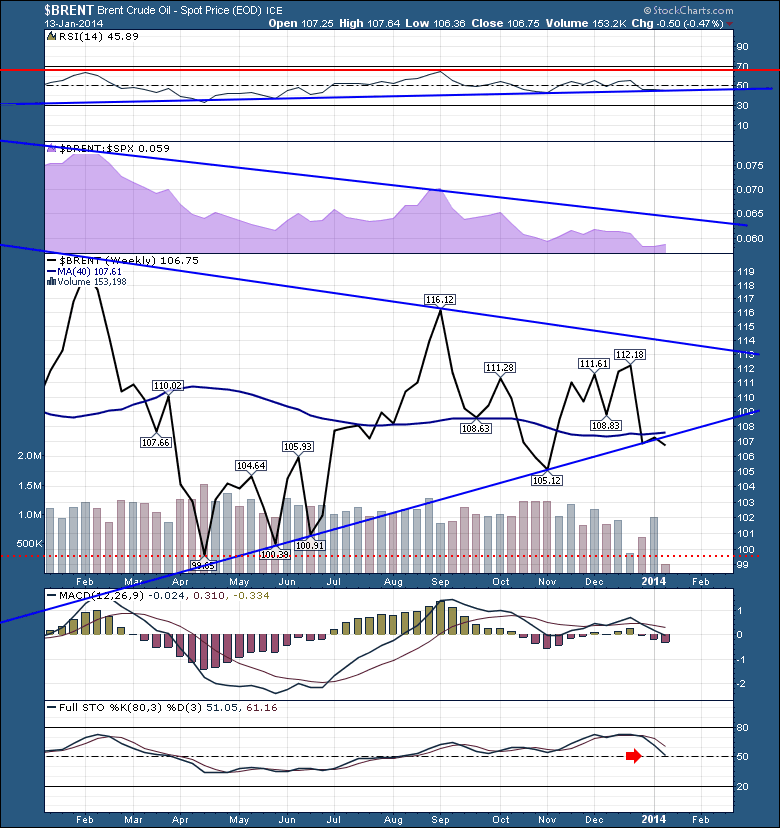
The MACD is in a calm before the storm pattern, where it goes to sleep and we would expect a significant breakout either way in price at some point. Lastly, the Full STO is pointed straight down. Below 50 is usually associated with downward prices. Currently $100 is the floor price of the horizontal action if the trendline breaks. If the lower trendline breaks, I would expect a large move down as the trendline held 12 times. Price action is critical here. Breaking and closing outside either of the pennant trendlines would be important.
You can see we just broke through the pennant today on the lower chart. We'll see if it closes the week below. It is at a critical point for either direction. The longer the trendline, the more touches on the trendline, the more meaningful the trendline. It needs to snap back above in short order to hold the uptrend.
Good trading,
Greg Schnell, CMT


