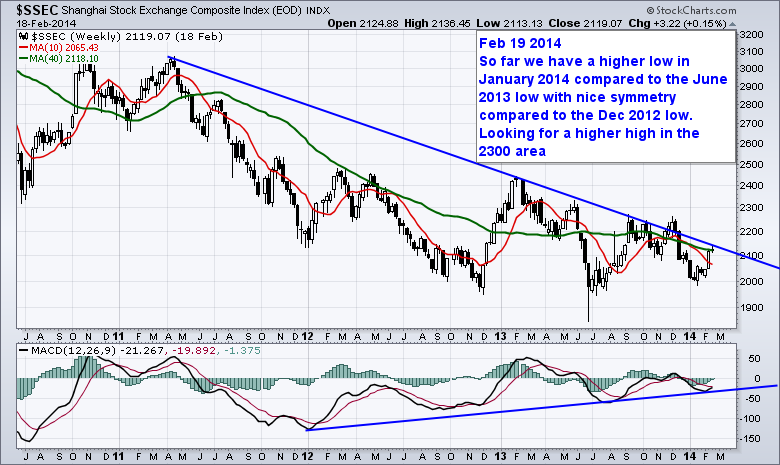
The $SSEC (Shanghai Composite) has been in a funk since 2011. It is approaching a meaningful area to look for a bullish reversal of the downtrend. As technicians, this is where we would expect to see the behavior change.
The Shanghai is testing the downsloping 40 WMA shown in green. As you can see, we have been here before. However, the negative momentum seems to have wained and the MACD is just points away from a bullish cross.We can see a series of higher lows on the MACD. We can also see the March 2013 MACD high is higher than the December 2013 high so a downsloping line could fit on top as well here. The pennant pattern on the MACD says that we should look for a big move either way.
The symmetry of the lows is a nice bullish pattern. The December low in 2012 sits higher than the deepest low in June 2013 (same low as the $SPX) and now the January 2014 low sits higher than the June 2013 low. As we approach the downsloping trendline that was briefly broken in November 2013 and the 40 WMA, the $SSEC has a lot of resistance here. A break through is extremely bullish. A fail here would be just as important a signal for us to remain defensive on the $SSEC.
Good trading,
Greg Schnell, CMT


