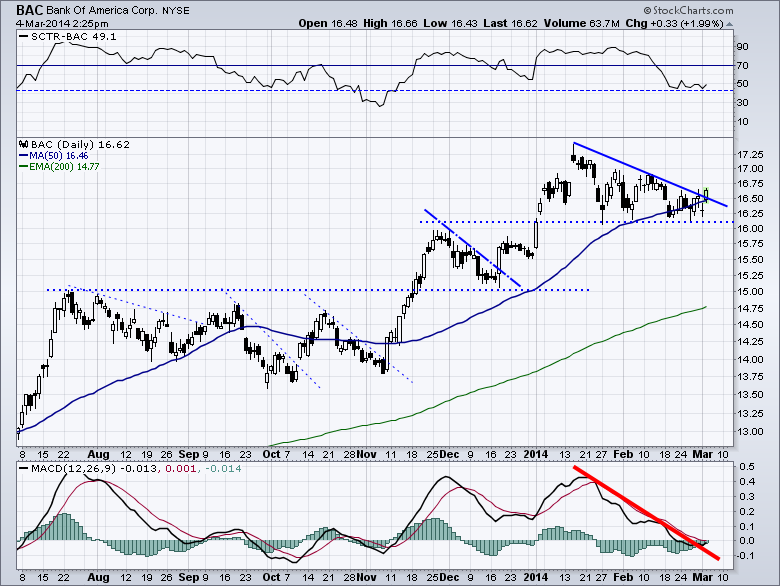
Bank of America has been running since Warren Buffet stepped in at around $5.00. Running up that is. It's pretty nice chart, with excellent support and resistance lines.
The SCTR seems to float between 45 and 90. The stock has been a large volume favorite and is a very nice swing stock with pullbacks and solid moves through trend line breaks.
You can see all the diagonal trend lines. It has been a great stock to see the acceleration from those break outs.
The MACD looks like it is resetting nicely at the zero line, and we may see a positive histogram as early as tomorrow.
Good trading,
Greg Schnell, CMT

About the author:
Greg Schnell, CMT, MFTA is Chief Technical Analyst at Osprey Strategic specializing in intermarket and commodities analysis. He is also the co-author of Stock Charts For Dummies (Wiley, 2018). Based in Calgary, Greg is a board member of the Canadian Society of Technical Analysts (CSTA) and the chairman of the CSTA Calgary chapter. He is an active member of both the CMT Association and the International Federation of Technical Analysts (IFTA).
Learn More


