When flipping through the charts, sometimes you see a certain sequence of events show up. Obviously the $COMPQ, $RUT, $SPX,$INDU track each other. Sometimes, different components rotate to outperform. Currently that is the case with the $INDU underperforming.
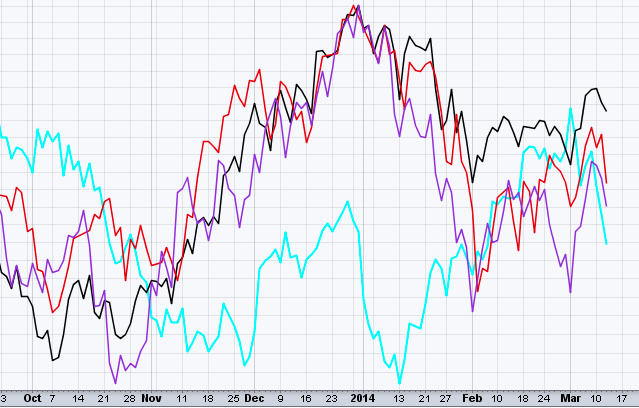
Here is a chart of some mystery assets over the last 6 months.
I would say they track each other pretty well. The degree of the moves is different, but in general they move with some similarity. The Cyan (light blue) line is a little different, but they all fell in October, rose in November December, fell in January, rose in February.
Keep reading to find out what they were.
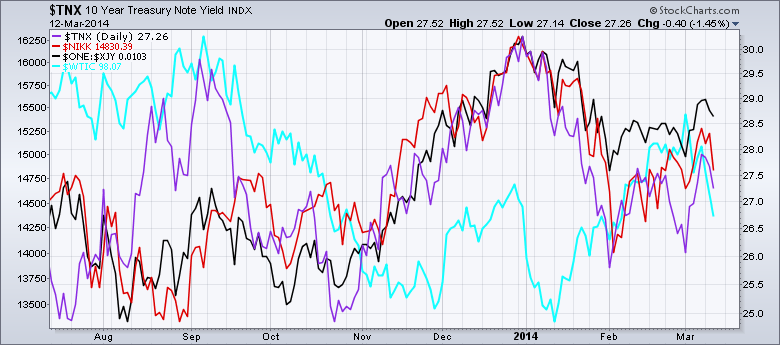
Red is a the $TNX. The US Bond Market.
Black is the Inverse of the $XJY chart, a currency.
Purple is the $NIKK, an Asian (Japanese) equity market.
Cyan, is the chart of $WTIC. Pretty much a domestic oil price.Even if you ignore the oil line, the other three are amazingly tight right down to the day.
It is important to see how tightly correlated world assets have become recently. Problems in the far east can become problems in the near west quite quickly.
The fact that the 10 year bond chart mimics the $NIKK is worrisome. The banks are quick to borrow in Yen, and buy other world assets. When the Japanese currency moves against them, they take the trade off or reduce position size. These correlations are important for watching our equities.
I am particularly concerned how the Japanese $NIKK chart and the $XJY chart look. They look ripe for major moves. First of all here is the chart from above with a legend. You can click on it to get to the actual chart.
Is everything correlated back to the $XJY in the last 6 months? If so, so what?
Well, let me show the $NIKK and why I think it might give us our next clue. Based on the above chart we could use the $NIKK or the $XJY. The $NIKK might help us see when equities are going to break down from a move in the $XJY currency.
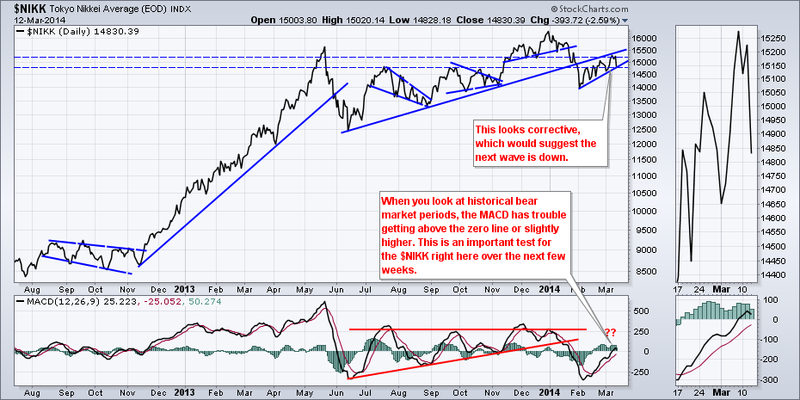
The $NIKK has been a classic pattern chart. Impulsive move up with QE 3 being released. Bullish wedge in July August, Pennant pattern (indecision but usually continuation) in October, and a Head/shoulders top with the top being the last trading day of December. It was only able to stay above the previous May high for one week. January was the longest impulsive move down since the May/June retracement in 2013. The difference now is that it has made a corrective flag pattern which would suggest a move down again. Bear market rallies usually fail around the zero line on the MACD with a small amount of room above zero. It's not over yet. But a move down to 13000 would be a reasonable target if this breaks the trend line. The $NIKK currently sits on the trend line and is having a modest session of 60 points higher in Asia tonight after falling almost 400 points as shown above.
It's time to watch closely as the Dow also made it's final high on December 31st and has not been able to take it out yet. If you click on the $NIKK chart you can check the comparison to the $INDU. The correlation is not as tight as the bond chart up top, but the $NIKK and $INDU broke out, topped, retraced , consolidated and climbed together since December of 2012.
Whether this is a leading signal or just a confirming signal, I am watching to see if the $NIKK loses this trend line. If it does, I would expect to see the US markets show some weakness as institutions sell/reduce the carry trade.
Good trading,
Greg Schnell, CMT


