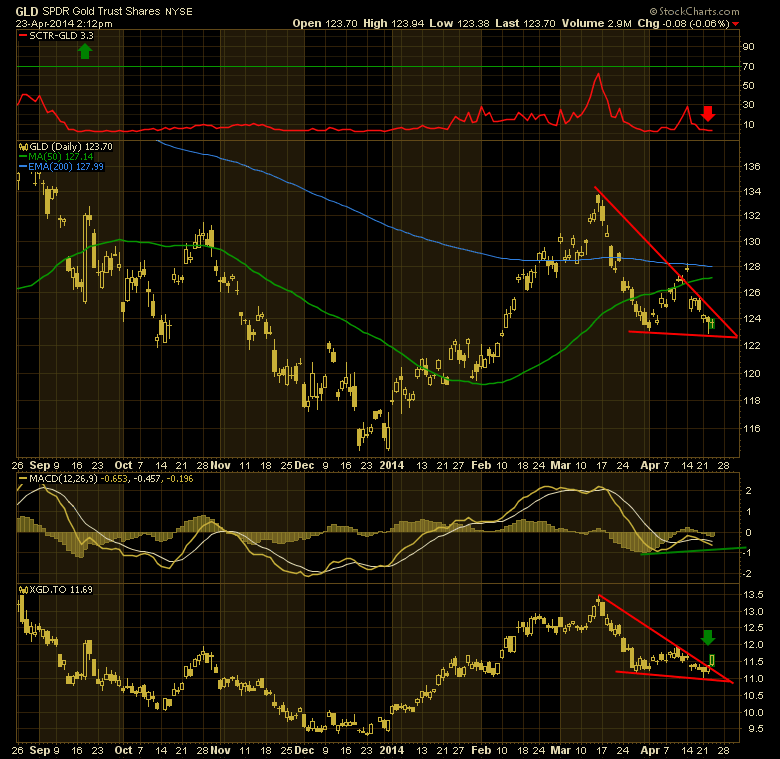
Some days, its about what is not moving. That would be $GOLD. Here is the chart of GLD the tracking ETF.
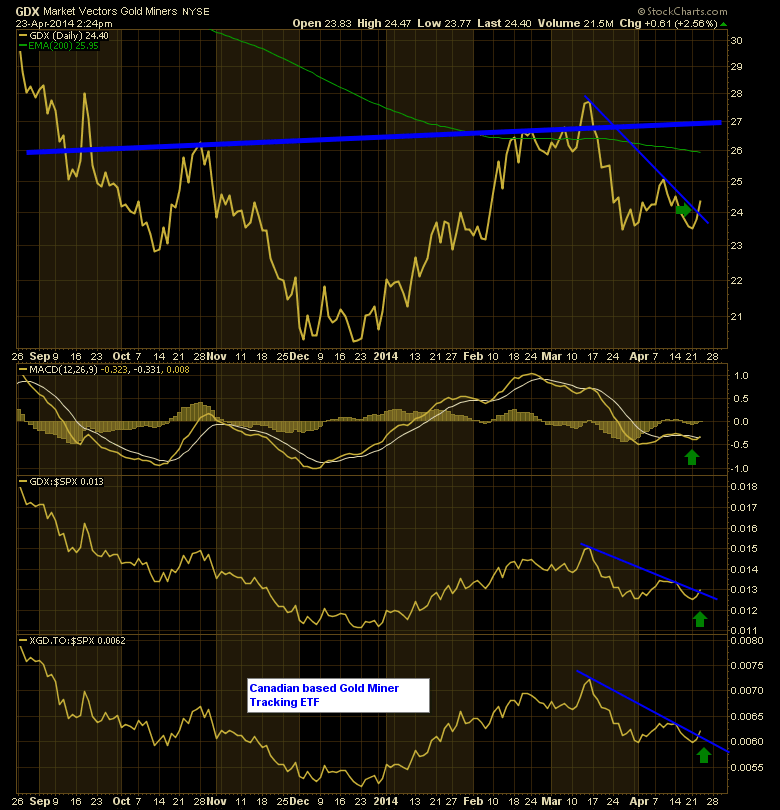
You can see the SCTR is at 3. This means it is behaving worse than 97% of the stocksand ETFs on the $TSX. We recently made a lower low and are below the 200 DMA. The MACD is diverging with a higher low, so that is very interesting. But look at the gold stocks as shown by XGD.TO. The Gold miners broke out today. Below is a chart with the GDX for the US gold miners tracking ETF.
GDX is breaking out on the mian price plot. The MACD is turning up as well. The SPURS relative strength lines are breaking out for both the GDX and the XGD.TO.
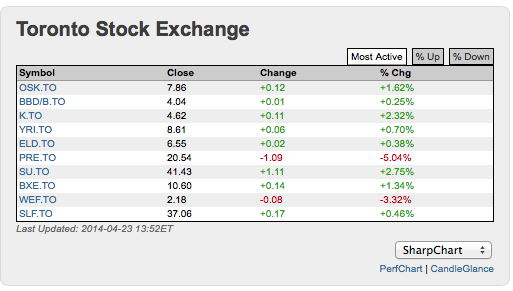
Here is something very interesting. Look at yesterdays and todays home page remembering that the price of gold has not started to move. This is yesterday's most active list. Gold was down $4.
Here is today's most active list .OSK,K, YRI and ELD are all gold stocks again. Gold is up $3.
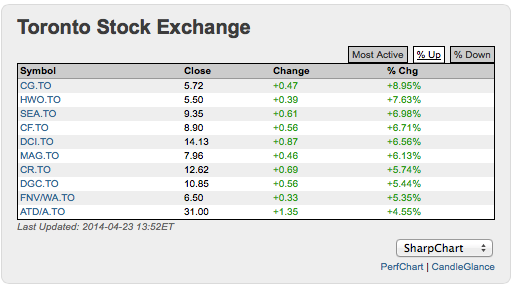
Here are the largest % up today. CG, SEA, MAG,DGC, FNV are all gold or silver. Gold is up $3.
I could go on, but the point is made. Some of the gold stocks are starting to move, well before gold starts to rise.
Good trading,
Greg Schnell, CMT
We try to keep our articles informative and entertaining. Make sure you check out the other blog writer articles in Mailbag, Chartwatchers, Traders Journal, Decision Point and The Canadian Technician. All of these articles are free to subscribe to. The subscriber button is top right on most articles. One of the little known secrets of StockCharts is our Blog or Articles section. The Blog tab will bring up a view of some of the most recent articles. StockCharts.com Subscribers have two additional daily feature articles.
Lastly, Chartcon 2014 in Seattle is rapidly booking up. Click here for more information.


