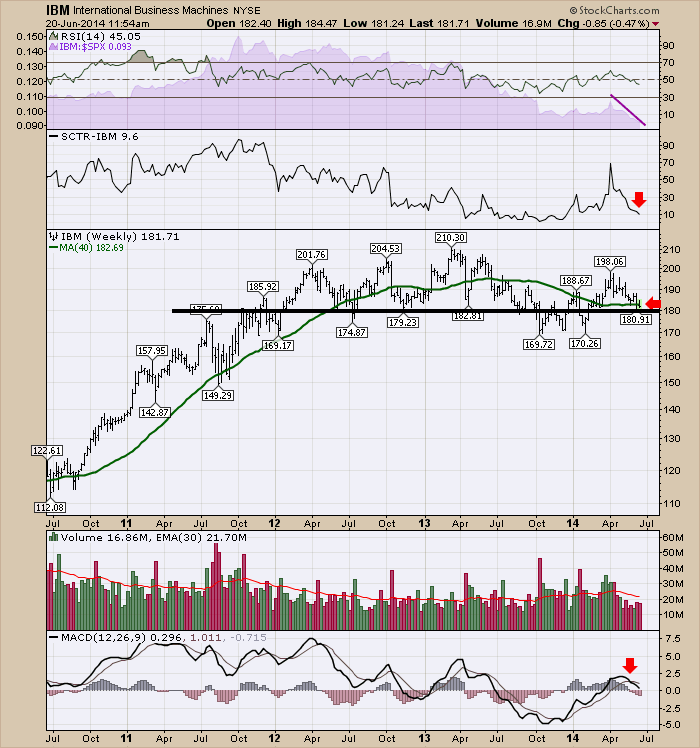
IBM Corporation (IBM) has been struggling over the last 2 years, but IBM surged off the February 5th, 2014 lows and kept climbing till April 1. 2014.
The technicals are really poor. IBM is starting to look like a better short than long. The RSI is trapped between 30 - 60 which is a bear trend. The purple area plot is the relative strength. It continues to under perform. The SCTR has returned to 10 which means it is one of the poorest performing stocks in the market. The price action is a huge rounding top. The black line broke in the 4th quarter and held close to the area of support. After a new push in February, IBM is at a clear decision zone. This is a strong place to consider shorting with a tight stop above.
The MACD rolling over just above zero is a confirming signal that short is better than long here. The volume continues to be subdued but the whole market has had the same trend. Longs should be prepared to use protection strategies if this fails to hold at the 40 WMA and the black support level. If IBM can find support here and push higher, that would be just as important a signal that this black support zone can hold. When stocks fall through the 40 WMA and then bounce back above, the next test of support at the 40 WMA is usually critical. This would start a new trend of higher highs and higher lows if it can go higher using the black line for support. IBM pays a big dividend so that is supportive and they continue to buy back stock which makes it harder to stay short.
Its a critical time for IBM. We'll watch to see if it can get some mojo.
Good trading,
Greg Schnell, CMT


