Gross Domestic Product ($$GDP) is the broad view on the economy. Normally there is some tracking of the stock market with Gross Domestic Product.
The top graph shows the USA GDP in Millions of Dollars.The left hand scale is for the SP500 ($SPX) shown as an area chart in behind the plot of GDP. We can see that GDP does not usually have a negative print but it did in the first quarter where the line changes to orange.
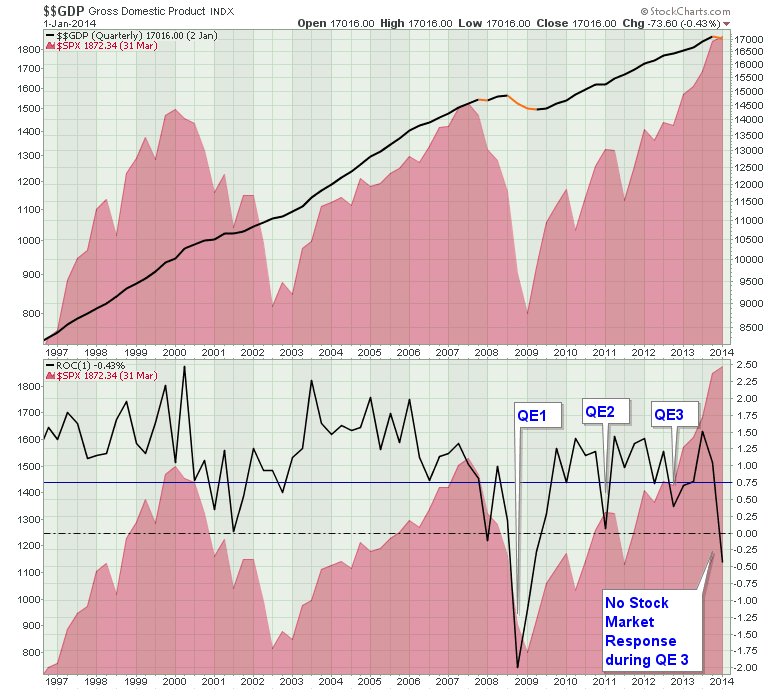
The bottom graph shows the quarterly Rate Of Change (ROC) in Percent of the GDP data shown in the top plot. So what is critically important ?
At the end of this month we will hear how much the economy bounces back after 2 declining Rate Of Change (ROC) readings. The world is expecting a large up bounce. In both 2000 and 2007, the stock market reacted violently to GDP below 1%. We can see the correlation of the 2000 and 2007 market drops in the GDP data as well. The Fed created new policy responses from 2008-2012 when GDP was not able to sustain a growth rate above 1% and the stock market reacted positively to the Fed. With the Fed's stimulus winding down I want to assess the health of the underlying economy. The declining Q1 2014 GDP data occurred while stimulus was still very high so we are led to wonder what will significantly improve GDP data without the economic stimulus being applied. The Q1 2014 rate of change in GDP was worse than the Q4 2007 drop and the SP500 ($SPX) is rising unabatedly. With the $SPX at all time highs while the GDP Rate of Change data is near 20 year lows, this would suggest the stock market is going with an all-in push on the health of the economy improving in a big way.
On July 30, the BEA will release Second Quarter GDP. The bottom chart will be very important to define if the market was right to overlook the data.
Janet Yellen's testimony this morning included the following paragraphs as part of her current outlook:
"Real gross domestic product (GDP) is estimated to have declined sharply in the first quarter. The decline appears to have resulted mostly from transitory factors, and a number of recent indicators of production and spending suggest that growth rebounded in the second quarter, but this bears close watching. The housing sector, however, has shown little recent progress. While this sector has recovered notably from its earlier trough, housing activity leveled off in the wake of last year's increase in mortgage rates, and readings this year have, overall, continued to be disappointing."
"Although the decline in GDP in the first quarter led to some downgrading of our growth projections for this year, I and other FOMC participants continue to anticipate that economic activity will expand at a moderate pace over the next several years, supported by accommodative monetary policy, a waning drag from fiscal policy, the lagged effects of higher home prices and equity values, and strengthening foreign growth. The Committee sees the projected pace of economic growth as sufficient to support ongoing improvement in the labor market with further job gains, and the unemployment rate is anticipated to continue to decline toward its longer-run sustainable level. Consistent with the anticipated further recovery in the labor market, and given that longer-term inflation expectations appear to be well anchored, we expect inflation to move back toward our 2 percent objective over coming years.
As always, considerable uncertainty surrounds our projections for economic growth, unemployment, and inflation. FOMC participants currently judge these risks to be nearly balanced but to warrant monitoring in the months ahead."
The next three weeks should give us substantial information for the economy with earnings and GDP being released. I think the lower plot on GDP data demonstrates a better correlation to the $SPX than the top plot. Hopefully this change in view helps clarify the importance of the upcoming data.
Good trading,
Greg Schnell, CMT


