The Emerging Markets ETF (EEM) is an all encompassing ETF for the emerging markets. Currently, the world is very bullish, but the EEM has traded sideways for years. Recently, I published a blog on the EEM back in May. You can read that blog here by clicking through on this link. Are Emerging Markets Emerging?
Let's look at the updated chart.
Starting at the top, the RSI is trying to break the bear market trend. At 67.75 it is the second highest reading since 2010. So it is trying to break the bear market indicator.I would suggest it has. Behind that is the relative strength in the shaded area and it continues to just perform with the S&P 500 ($SPX). The SCTR has broken into top quartile territory at 76.3 which is hugely bullish! Moving to the price plot, we can see a new closing high of 44.16 for the first time in years. That takes us back to 2011 so that is a 3 year break out. The volume is undeniably weak. I have drawn a horizontal line at last weeks level. Now arguably, the Canadian and USA traders were on an all day holiday (Tuesday & Friday respectively) with the market closing early on Thursday, and the World Cup and Wimbledon were on stage so a quiet market was ultra quiet. Back in May I pointed to quiet volume as a concern, and it has only gotten quieter almost every week. Spooky quiet. In 2011, the quiet volume marked the top.The lowest volume in July 2011 preceded the huge sell off, so low volume is not an indicator of "all-is-well". Back to price, we are making higher lows and higher highs which is a definition of an uptrend.
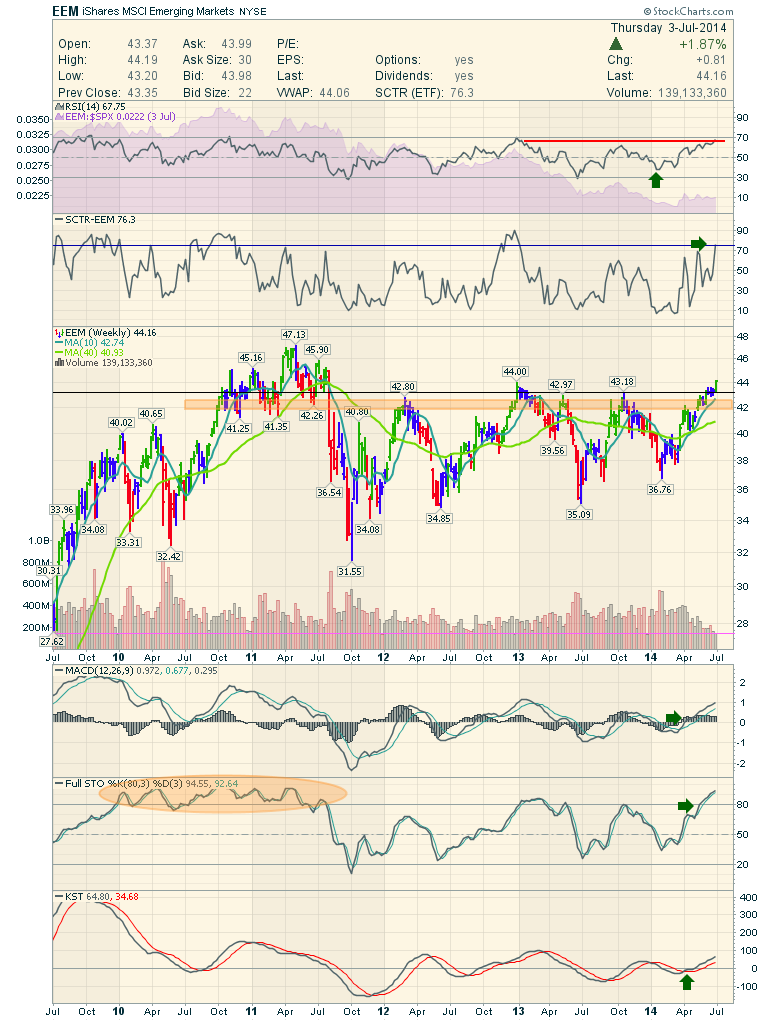
Continuing through, we can see the MACD is back to the level it rolled over in 2013.The Full Sto's look bullish and can stay that way for years. The KST is making higher highs and higher lows. Bullish.
An entry here at $44.16 is nice with a very tight stop just below the previous highs. I put a line on the chart at the October 2013 high, which was our most recent high to take out. That is at $43.18 and our breakout should hold above there or there is a problem.
Manage your own trade, but EEM is breaking out to higher highs. Bullish!
Don't forget Chartcon 2014. We are in the final few days to still get into the hotel block booking. It expires tomorrow! Yes Tomorrow!
Good trading,
Greg Schnell, CMT


