The Consumer Cyclicals Sector ETF (XLY) is testing a very important level technically this week. The RSI uptrend line is being tested and has been in place since March 2014. The SCTR ranking is very interesting. The SCTR was in the top quartile almost all of 2013. This year it has spent very little time above the 75% level. As it slowly climbs up to this 70 level, it is important to watch. If it has enough momentum to become a top quartile stock, we will probably see more buying as it really starts to outperform. Until that point in time, it looks weak to me. The price action in 2013 had excellent momentum with the slope being very steep. In 2014, the advance is a lot slower. We are currently testing the 2014 uptrend line. A breakdown here on the XLY in the primary quarter for consumer cyclicals would have to be considered a big bear stain for the broader market. Staying above this uptrend line is very important.
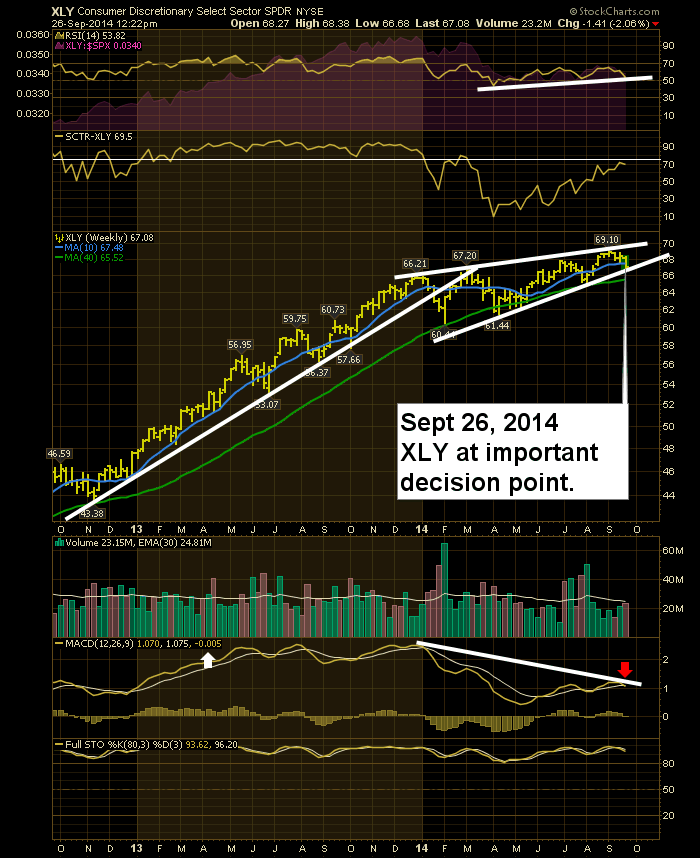
The MACD looks really weak. At the time of writing, the MACD had crossed below its signal line. We can see the negative value above the white arrow in the MACD panel. We can also see the major divergence between the price trend and the MACD trend. The long term Full Stochastics still suggest lots of support by staying above 80.
The real issue is since December 2013 to today, you would be up less than a dollar on a $66 investment in December of 2013. A break below the white trend line would be a significant long term change for the sector. Watch closely for a bounce off this level. Even in years with a weak third quarter period between July and September, Amazon usually makes a thrust in October towards Christmas. This XLY chart might not move aggressively either way if that is the case, but charts of GM and F are looking weak so the large ticket items are not as strong as we would like to see right now. GM is back to testing its original $32 IPO level and F is sitting on the 200 DMA and a 2 year major trend line. AMZN's chart structure looks very very similar to the XLY, so the Amazon chart could be a big indicator of the entire sector. Key reason for showing this chart: Decision Time!
Good trading,
Greg Schnell, CMT


