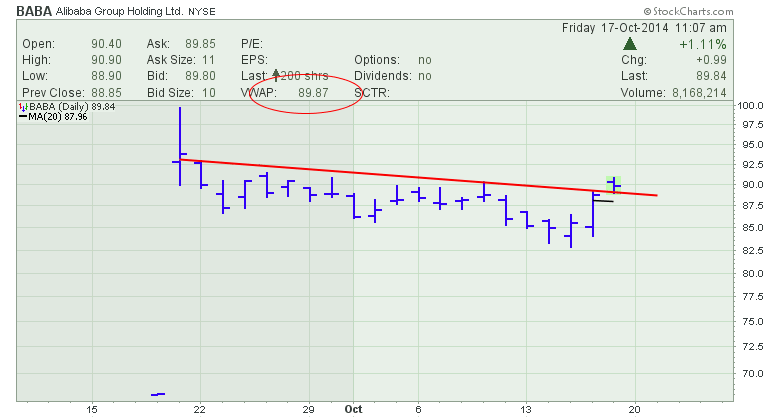
Alibaba (BABA) has been sliding sideways since the IPO. The $SPX made its high on Alibaba (BABA) initial public offering day which was September 19, 2014. Most stocks have been pulling back since the quadruple witching day of September 19, 2014. The stock has gently pulled back while other sectors fell faster than stones on a mountainside. Today, Alibaba gapped up and broke above the horizontal resistance. It also gapped above the Volume Weighted Average Price (VWAP) which I have circled in the full quote panel above. At the time of writing it has pulled back below the VWAP level. However, investors looking for Alibaba to become the next great growth stock might have got a clue today. After a month of pulling back, Alibaba was able to gap above the trend line resistance on the first strong day for the broader markets.
Coming out of a low is always volatile, but maybe a glimmer of hope has shown up on the NYSE's largest IPO. Now that the IPO baby is awake, will it walk or run?
Good trading,
Greg Schnell, CMT


