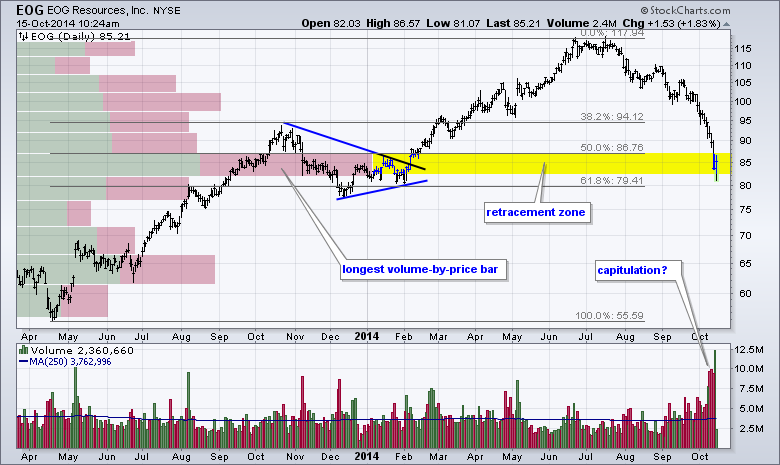
Most energy stocks have been in a free fall this month and EOG resources is no exception. The stock plunged over 25% from its summer highs and retraced 50-62% of the prior advance (Apr-2013 to July-2014). The stock shows signs of capitulation as downside volume surged for three days and the stock advanced on the fourth day with even higher volume. Also notice that the longest volume-by-price bar resides in the 82-86 area. Combined with the Fibonacci retracements, this area could offer support and lead to at least an oversold bounce.

Click this image for a live chart.

About the author:
Arthur Hill, CMT, is the Chief Technical Strategist at TrendInvestorPro.com. Focusing predominantly on US equities and ETFs, his systematic approach of identifying trend, finding signals within the trend, and setting key price levels has made him an esteemed market technician. Arthur has written articles for numerous financial publications including Barrons and Stocks & Commodities Magazine. In addition to his Chartered Market Technician (CMT) designation, he holds an MBA from the Cass Business School at City University in London.
Learn More


