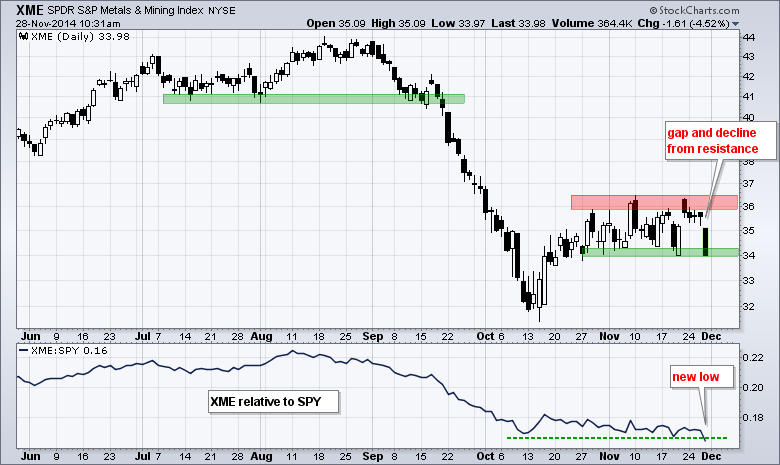
The Metals & Mining SPDR (XME) got a bounce with the stock market in the second half of October, but struggled in November with a trading range between 34 and 36.5. This struggle turned to weakness as the ETF gapped down on Friday and fell sharply. A follow through support break would signal a continuation of the bigger downtrend and target a move to new lows. The indicator window shows the XME:SPY ratio hitting a new low already as XME shows relative weakness. Note that copper fell sharply on Friday, Caterpillar gapped down and gold is down sharply.
Click this image for a live chart.

About the author:
Arthur Hill, CMT, is the Chief Technical Strategist at TrendInvestorPro.com. Focusing predominantly on US equities and ETFs, his systematic approach of identifying trend, finding signals within the trend, and setting key price levels has made him an esteemed market technician. Arthur has written articles for numerous financial publications including Barrons and Stocks & Commodities Magazine. In addition to his Chartered Market Technician (CMT) designation, he holds an MBA from the Cass Business School at City University in London.
Learn More


