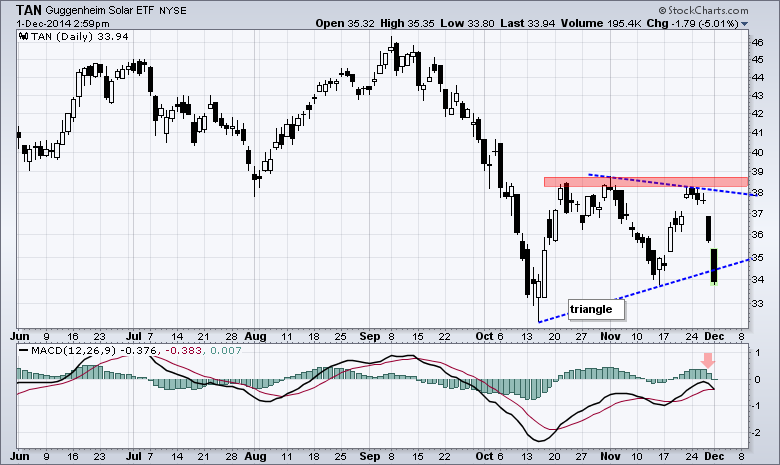
Lower energy prices may be making solar less competitive and putting pressure on solar-related stocks. The chart shows the Solar Energy ETF (TAN) breaking down in Sep-Oct, consolidating with a triangle and breaking triangle support with a sharp two-day decline. This break signals a continuation of the prior decline and targets a move to new lows. The indicator window shows MACD in negative territory and moving back below its signal line.
Click this image for a live chart.

About the author:
Arthur Hill, CMT, is the Chief Technical Strategist at TrendInvestorPro.com. Focusing predominantly on US equities and ETFs, his systematic approach of identifying trend, finding signals within the trend, and setting key price levels has made him an esteemed market technician. Arthur has written articles for numerous financial publications including Barrons and Stocks & Commodities Magazine. In addition to his Chartered Market Technician (CMT) designation, he holds an MBA from the Cass Business School at City University in London.
Learn More


