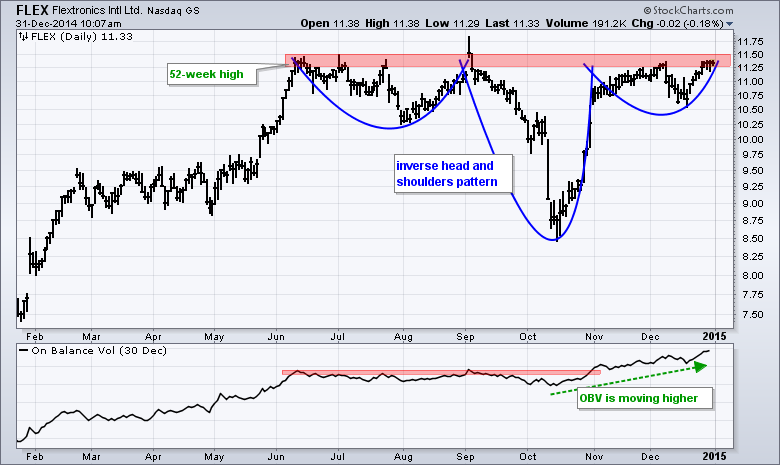
Flextronics (FLEX) hit a 52-week high in June and then formed an extended consolidation that looks like an inverse head-and-shoulders pattern. It is not picture perfect, but the "essence" of the pattern is there. There is a prior uptrend, a left shoulder dip, a deeper dip for the head and a right shoulder dip. The red area marks neckline resistance and a break above 11.50 would confirm this pattern. Note that I made a judgment call and drew through the September spike. Also note that On Balance Volume (OBV) is bullish because it broke out in late October.
Click this image for a live chart.

About the author:
Arthur Hill, CMT, is the Chief Technical Strategist at TrendInvestorPro.com. Focusing predominantly on US equities and ETFs, his systematic approach of identifying trend, finding signals within the trend, and setting key price levels has made him an esteemed market technician. Arthur has written articles for numerous financial publications including Barrons and Stocks & Commodities Magazine. In addition to his Chartered Market Technician (CMT) designation, he holds an MBA from the Cass Business School at City University in London.
Learn More


